Looking to map and analyze local sports infrastructure? Download Sports Club Data easily and accurately using GIS Data by MAPOG. This intuitive platform supports over 15 GIS-compatible formats such as Shapefile, KML, GeoJSON, and MID, ensuring smooth integration with your preferred GIS tools. Whether you’re working on recreational planning, infrastructure development, or urban mapping, MAPOG offers structured, high-quality datasets to support your spatial analysis and decision-making process.
What is Sports Club Data?
Sports Club Data includes location-based information on fitness centers, community sports halls, athletic clubs, football academies, and other recreational facilities. This data, when visualized on a map, provides insights into regional accessibility, development gaps, and planning opportunities across urban and rural settings.
Download Sports Club Data of any countries
Note:
- All data is provided in GCS datum EPSG:4326 WGS84 CRS (Coordinate Reference System).
- Users need to log in to access and download their preferred data formats.
Step-by-Step Guide to Download Sports Club Data
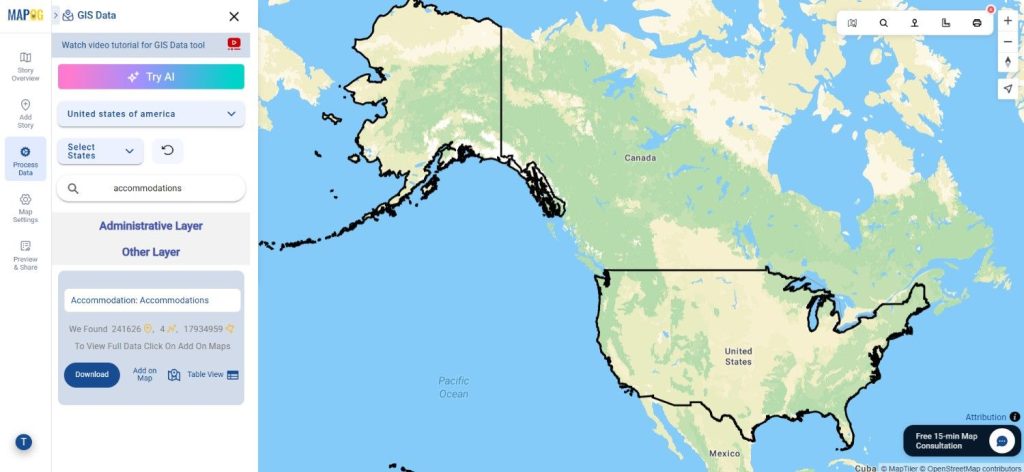
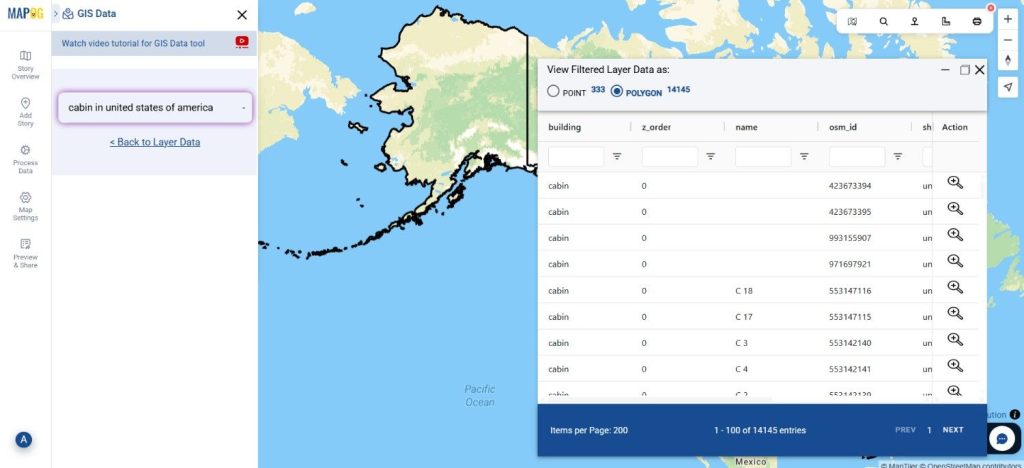
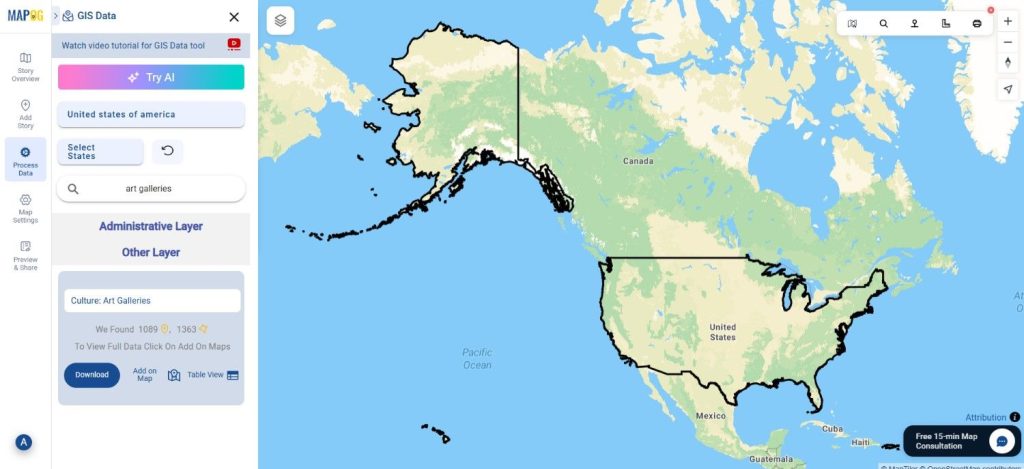
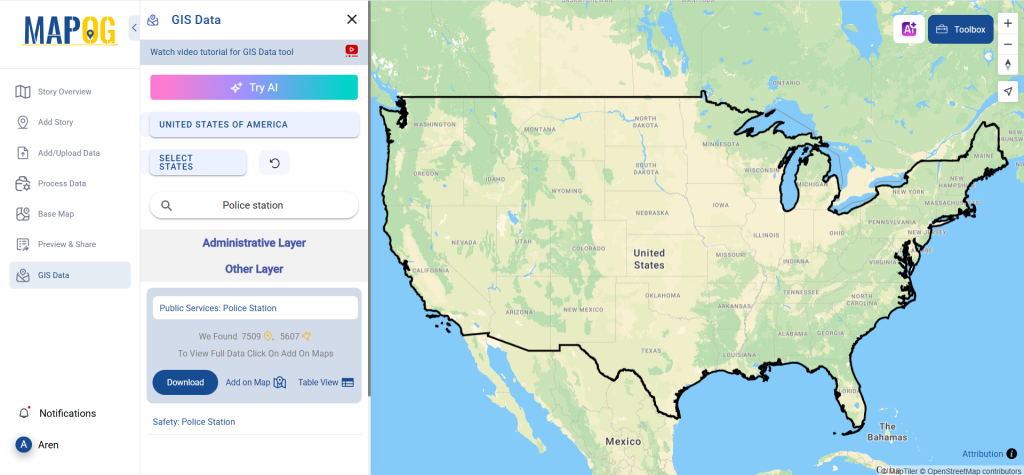
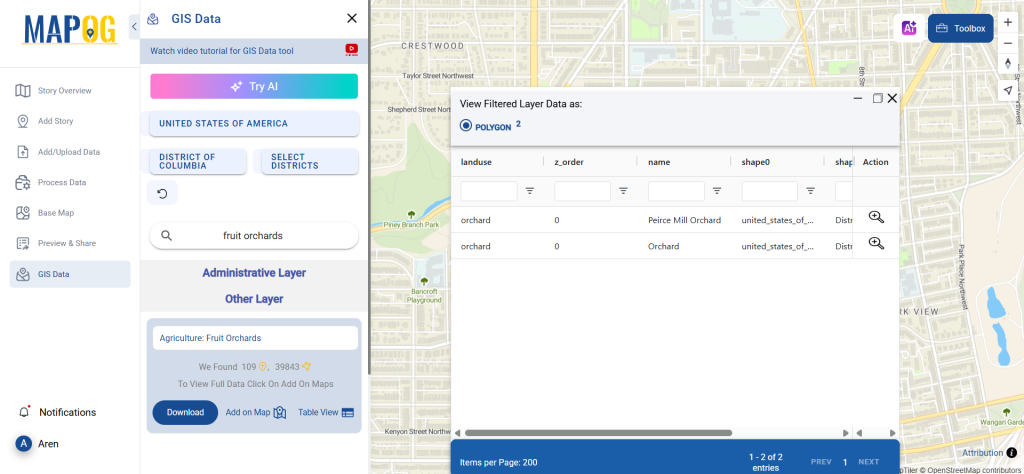
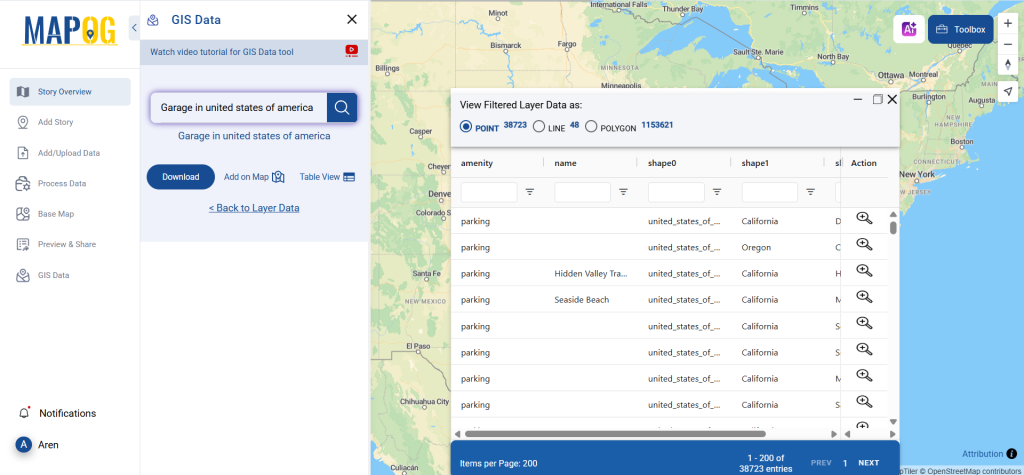
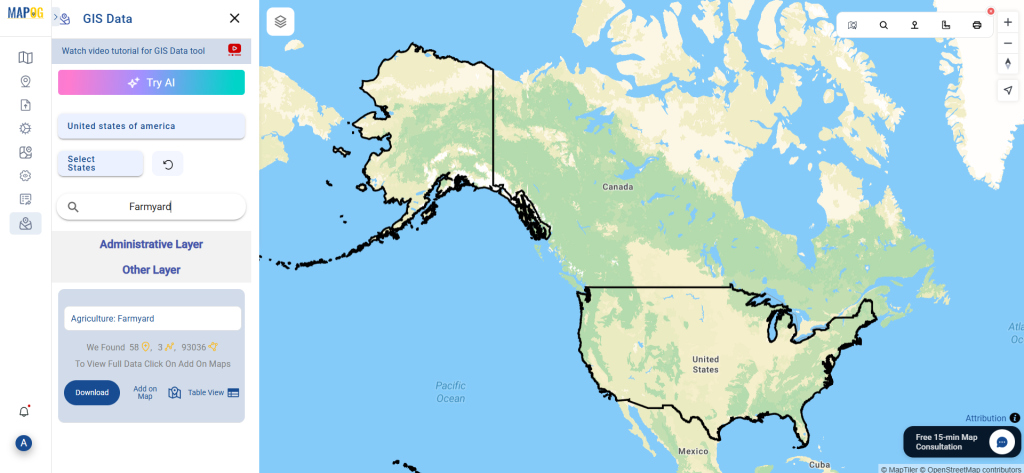
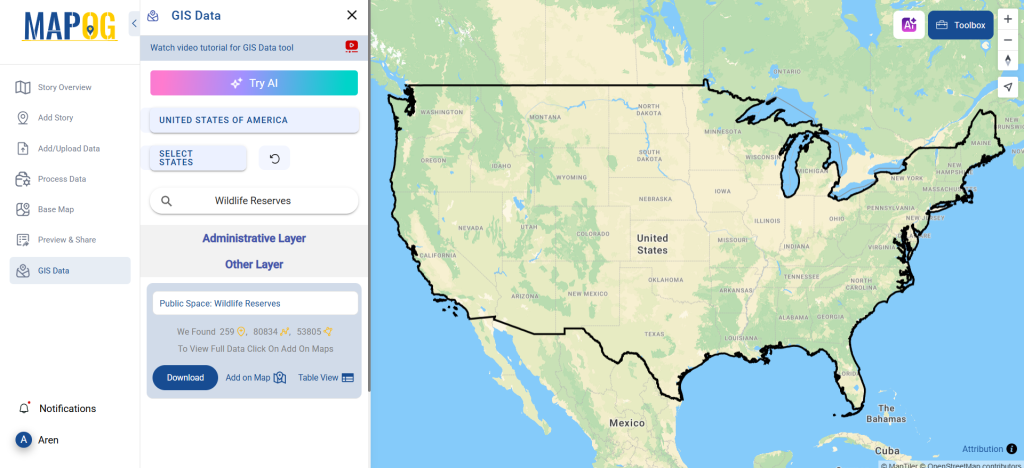
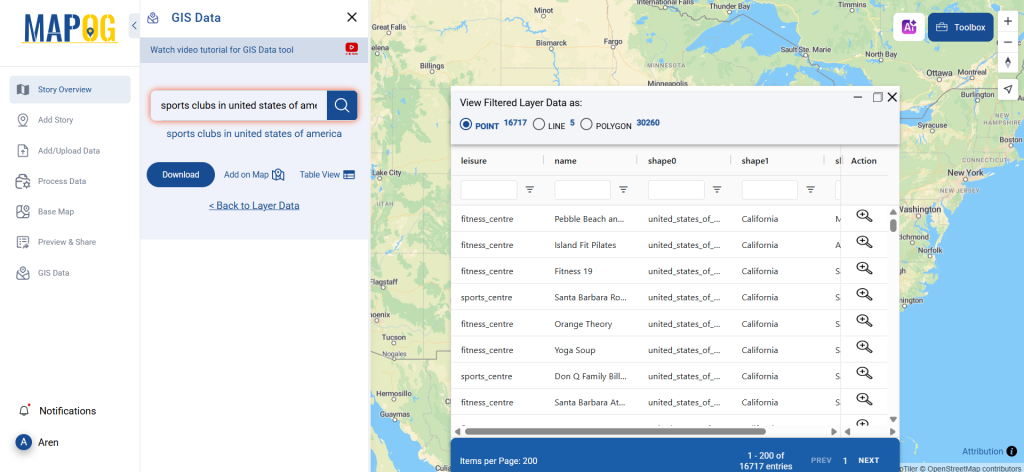
Step 1: Search for Sports Club Data
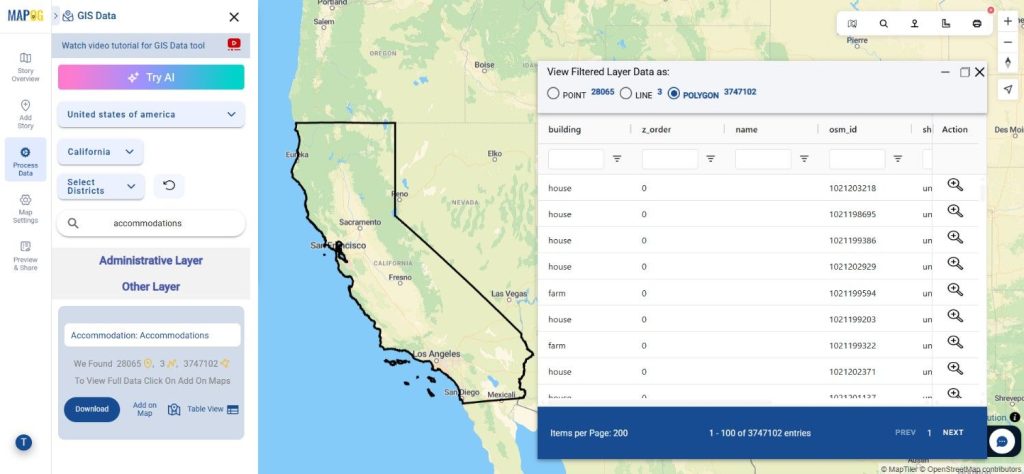
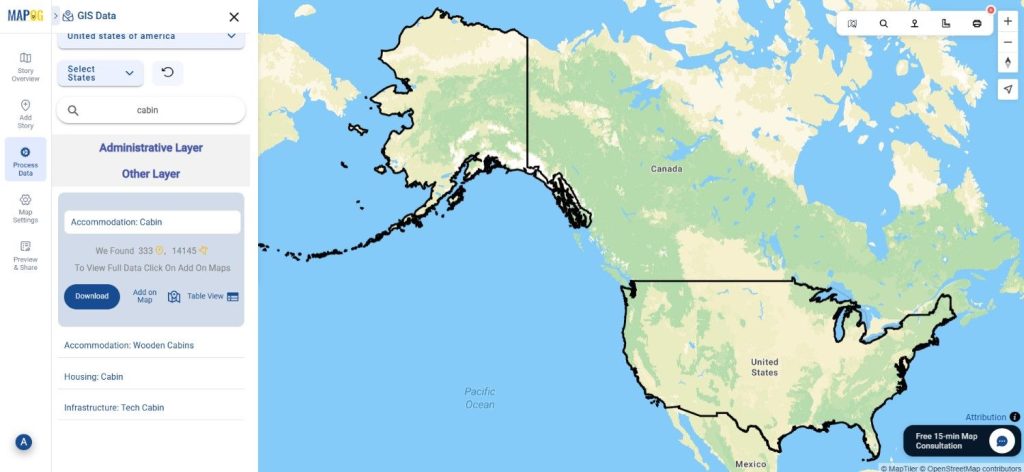
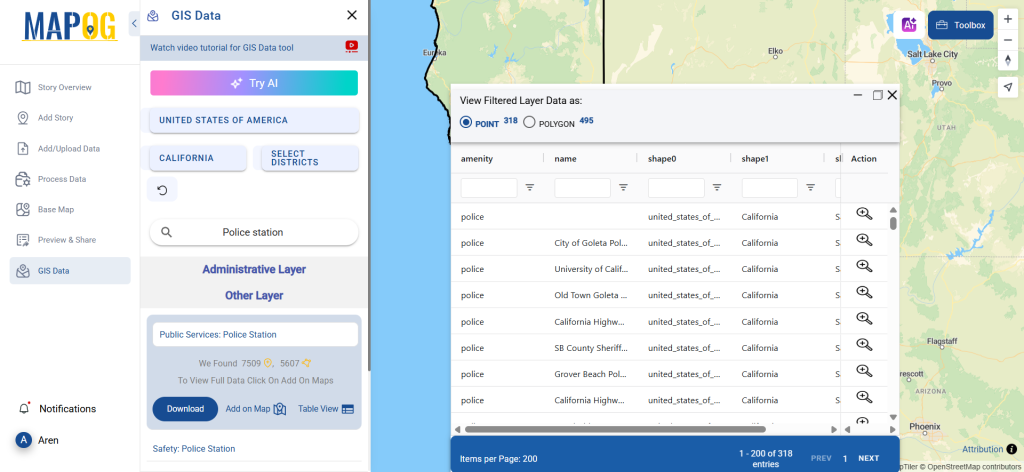
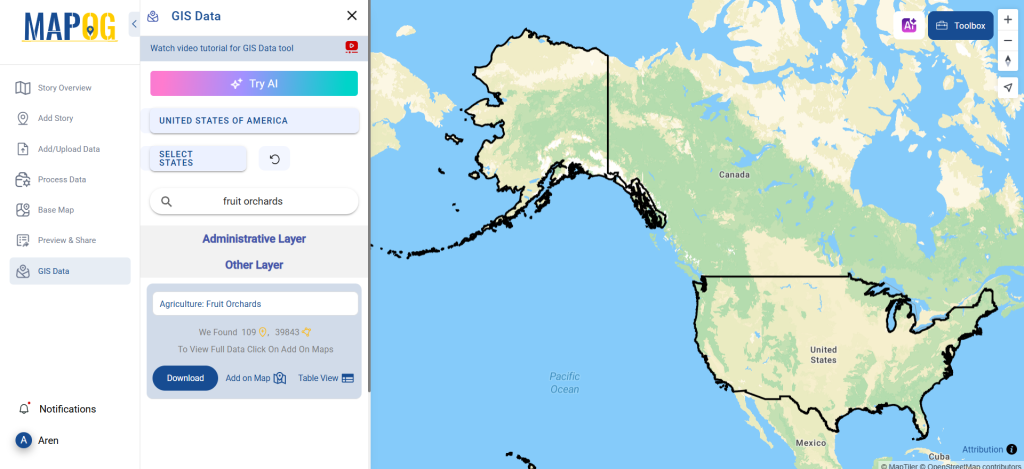
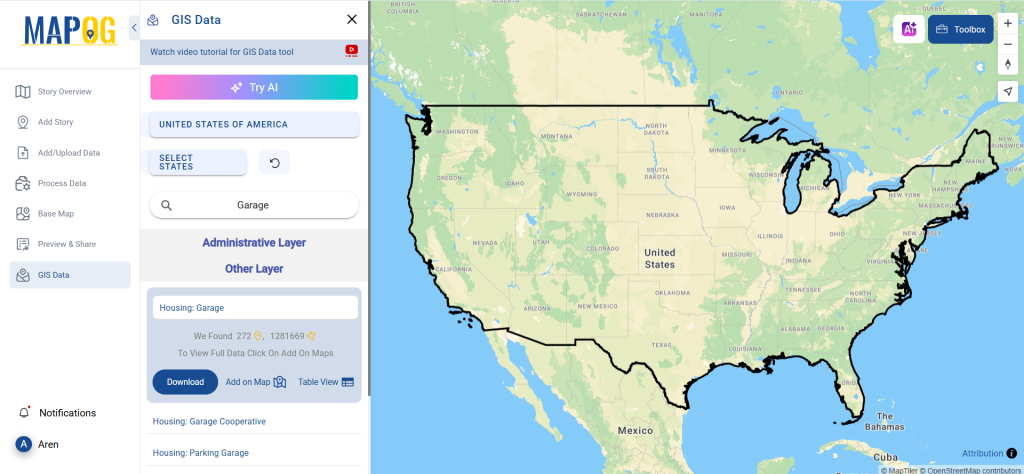
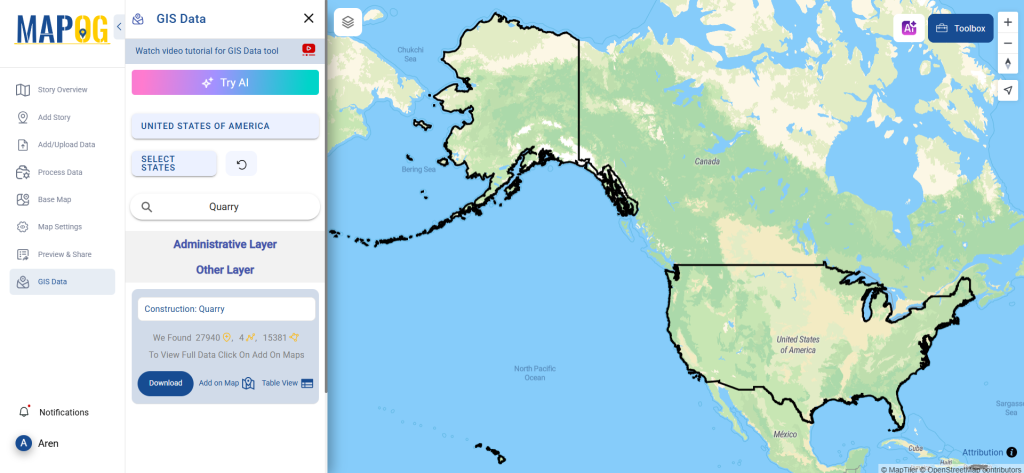
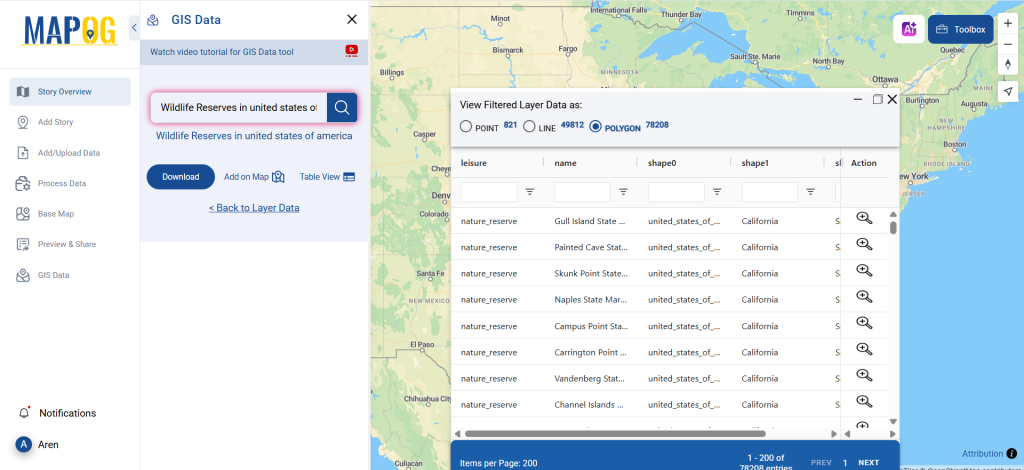
Begin by navigating the GIS Data by MAPOG interface. Use the “Search Layer” tool and enter “Sports Club Data ”. Each dataset contains essential attributes like facility type, ownership, and spatial format (point or polygon).

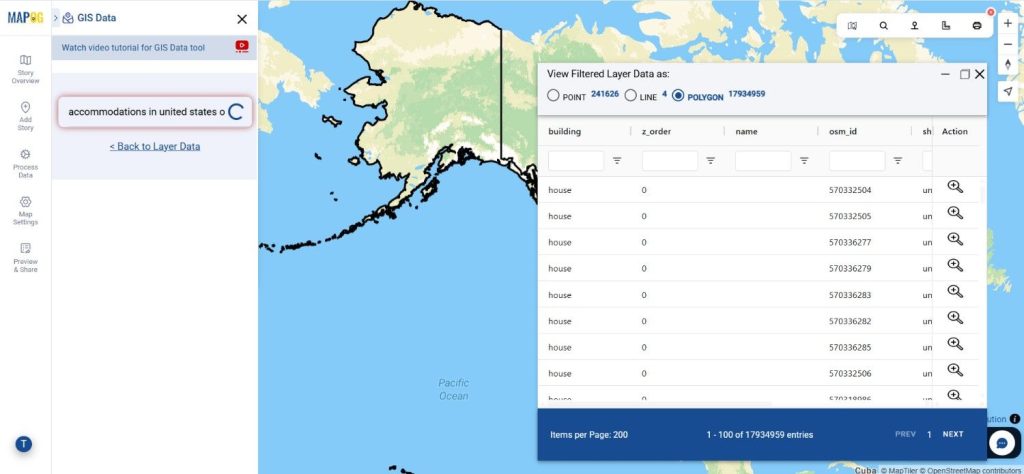
Step 2: Use the AI Search Tool
Speed up your search using MAPOG’s “Try AI” feature. Simply type keywords such as “sports facilities in area,” and let the AI assist in fetching the most relevant and updated datasets for you.
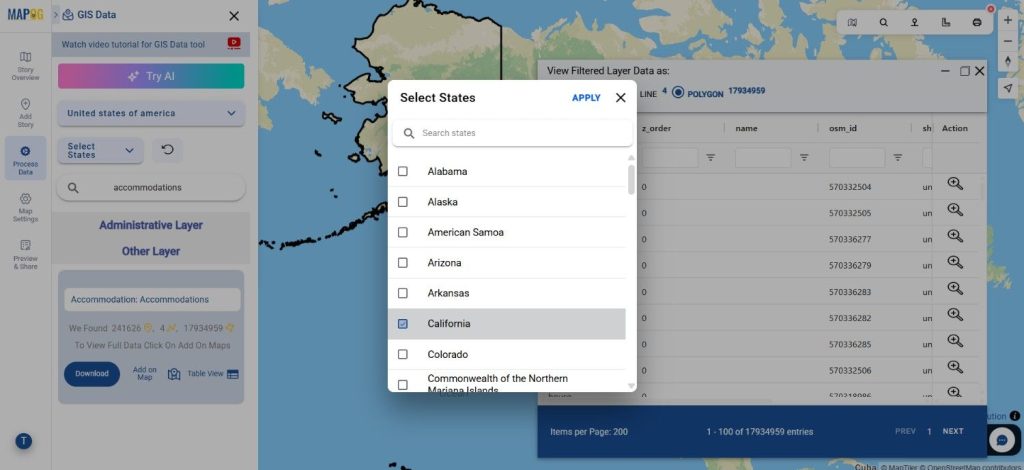
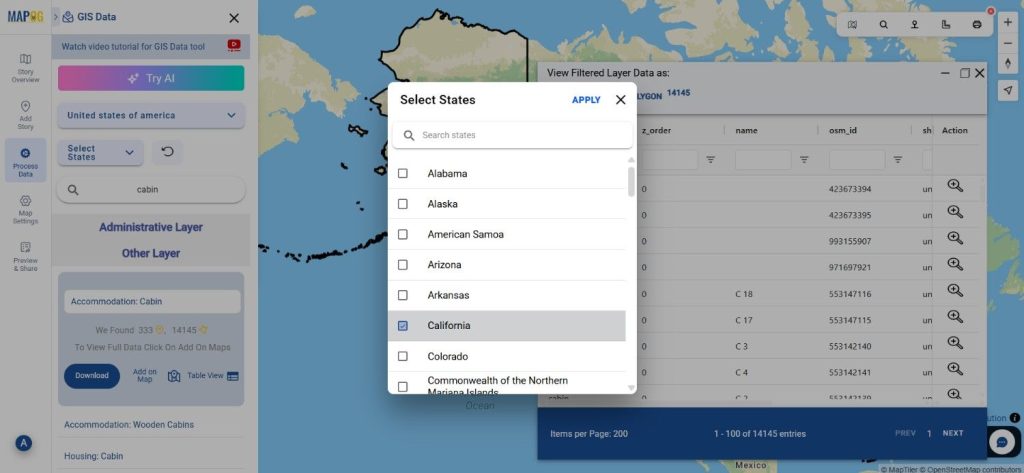
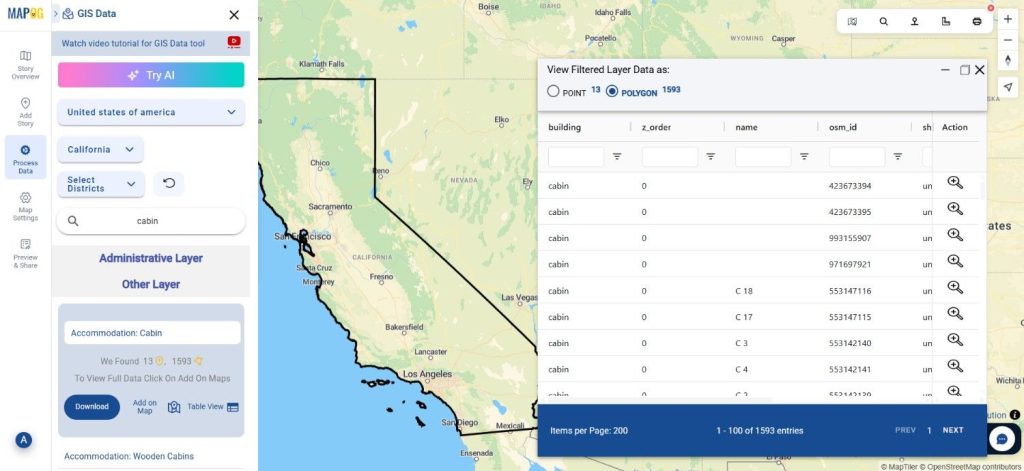
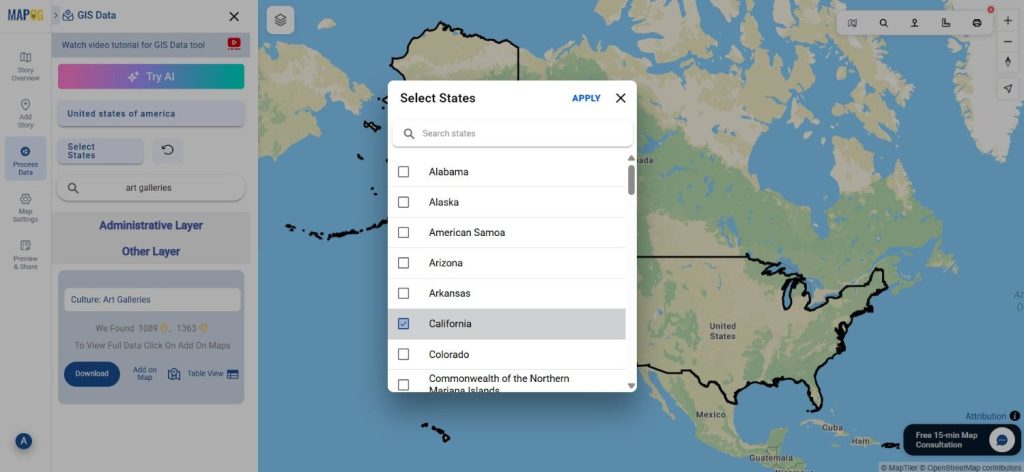
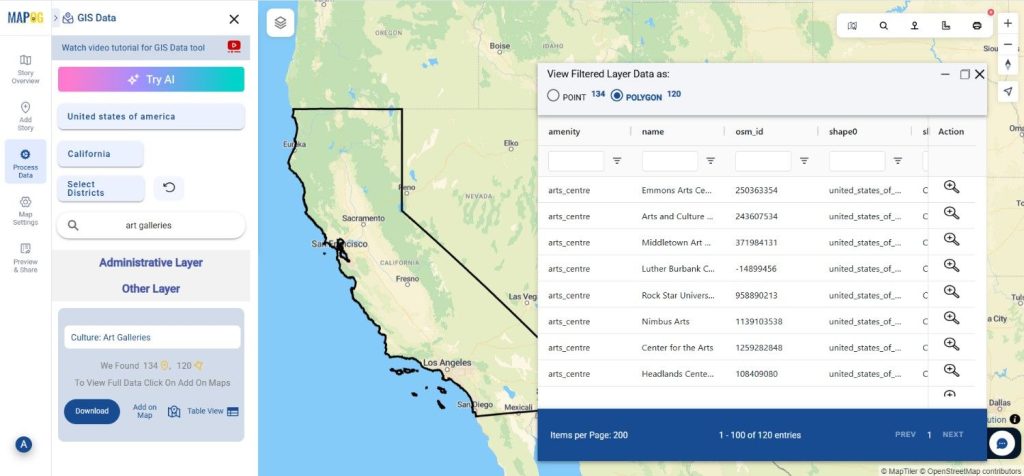
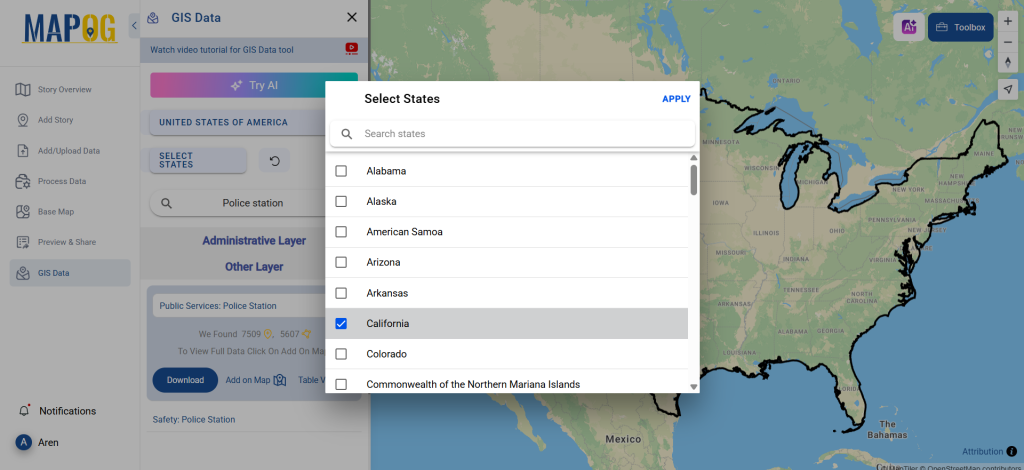
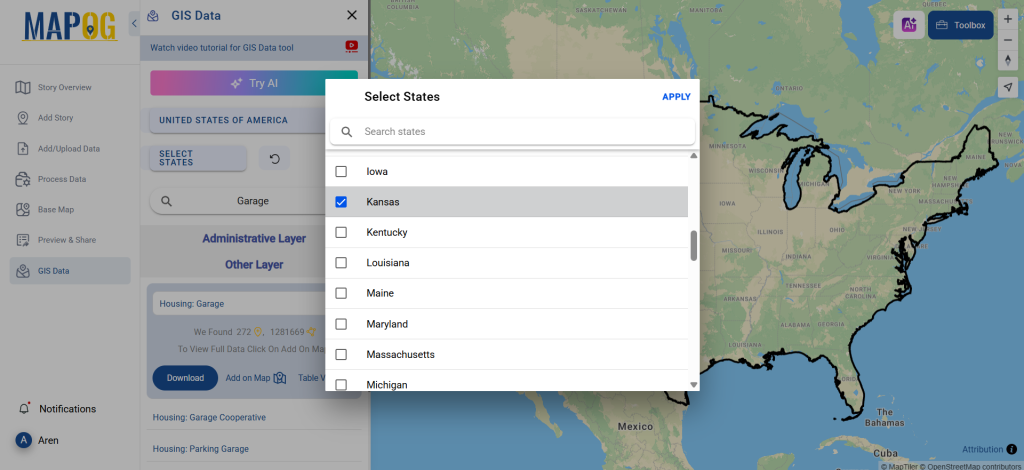
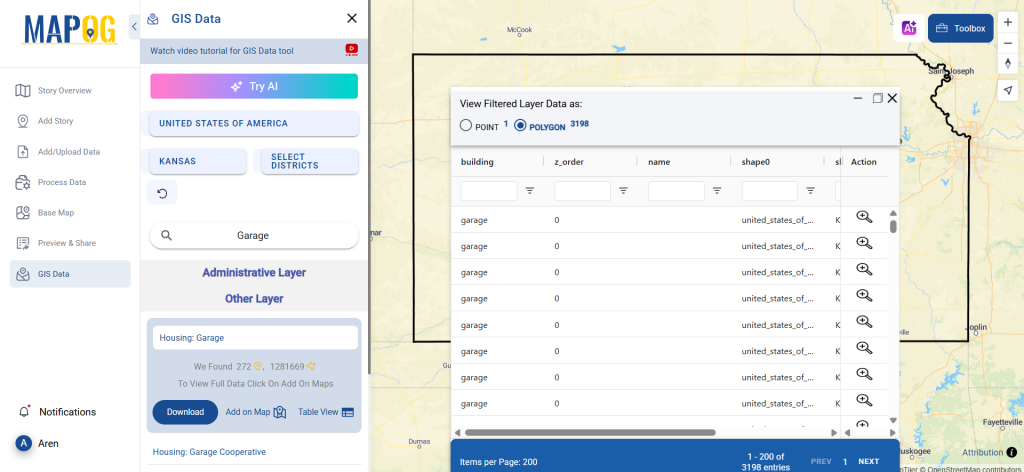
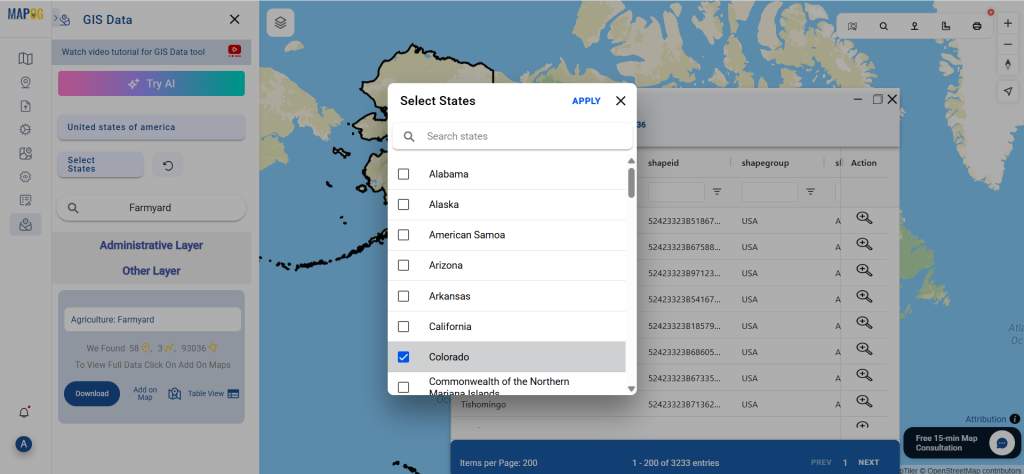
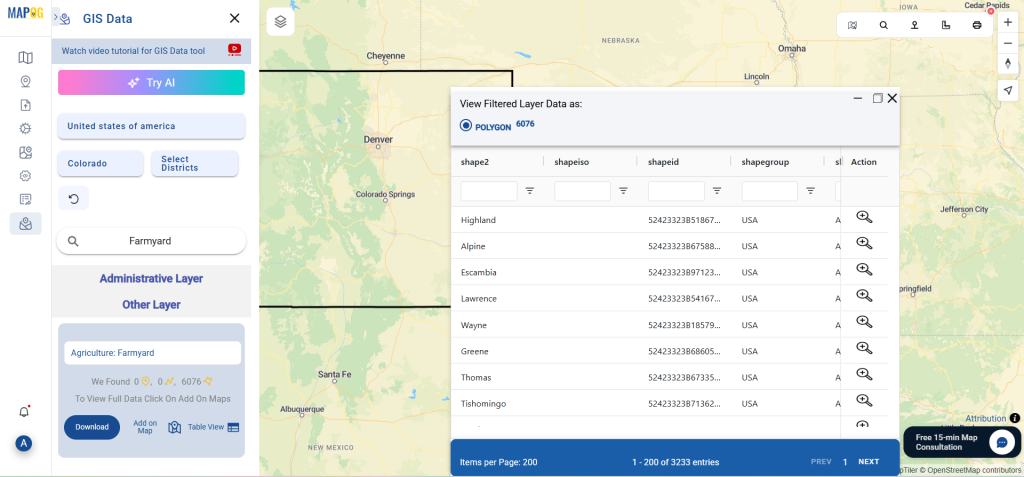
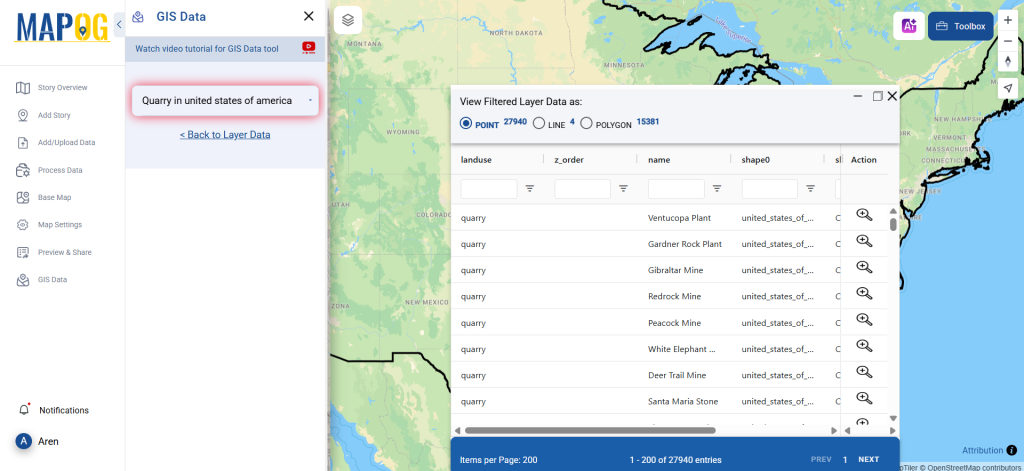
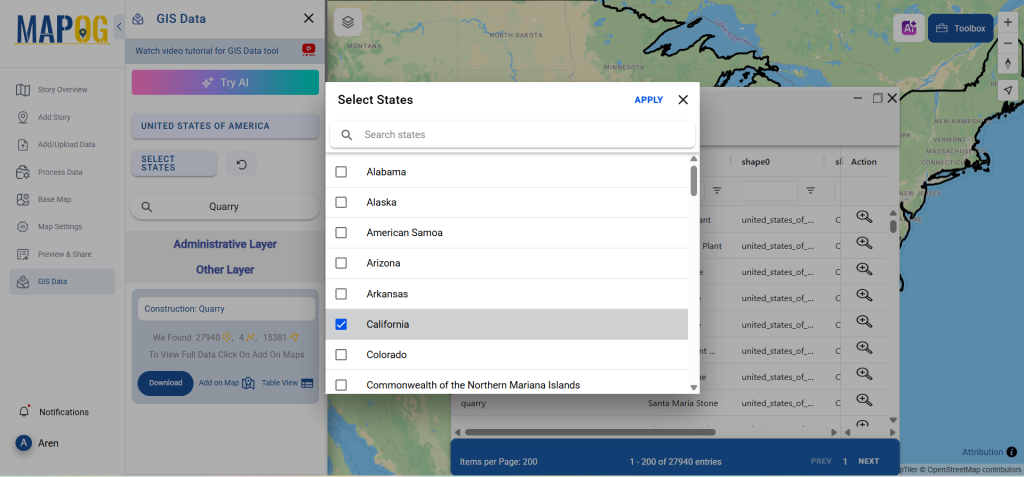
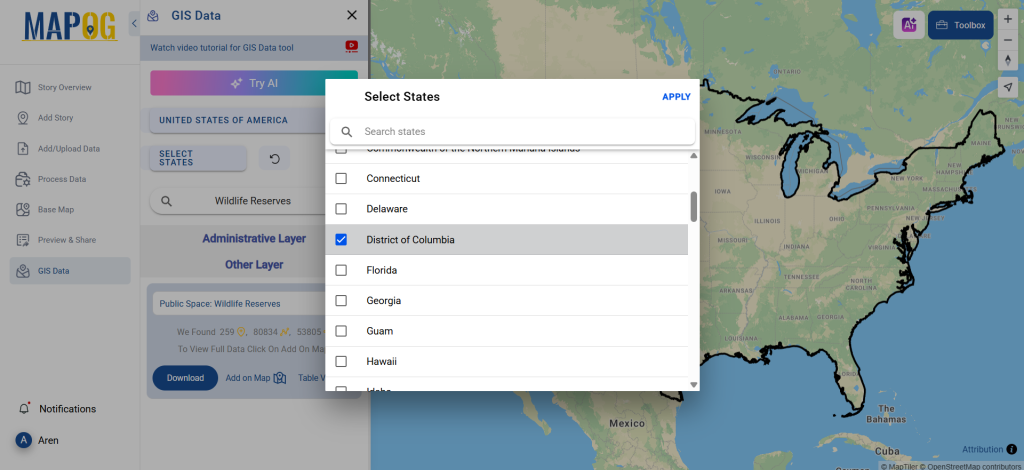
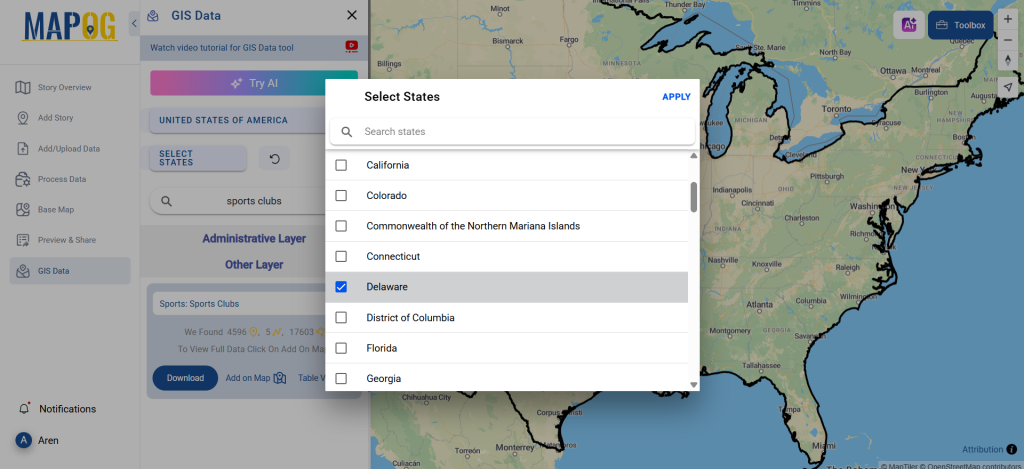
Step 3: Apply Filters for Accuracy
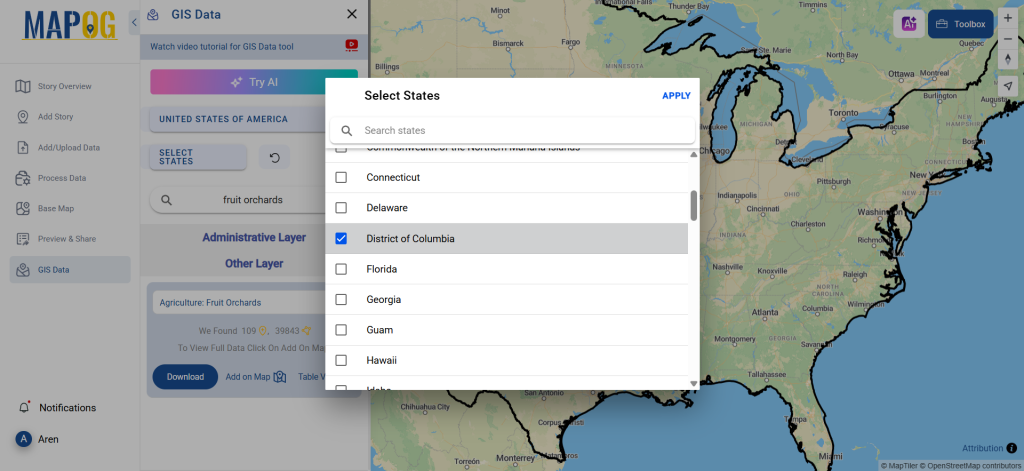
Refine the search results using the Filter Data option. You can narrow the scope to specific states or districts, ensuring the downloaded data is highly targeted and relevant to your area of interest.
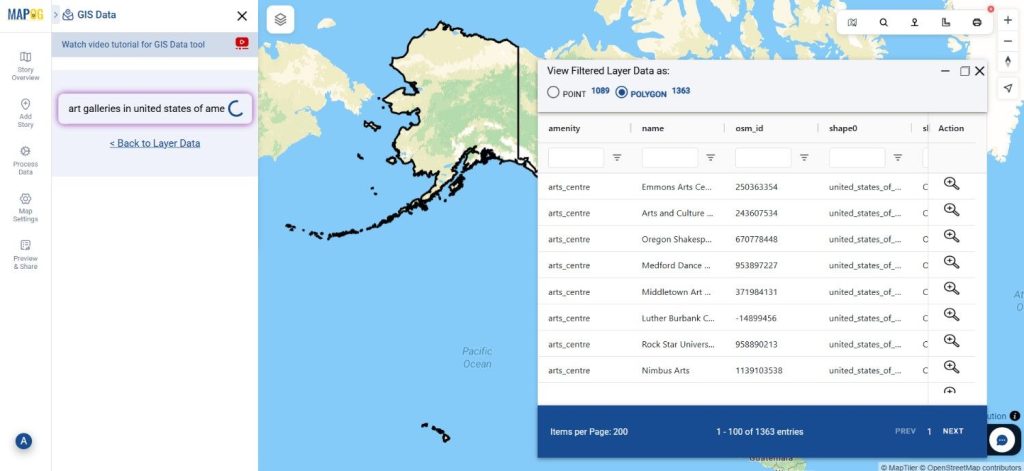
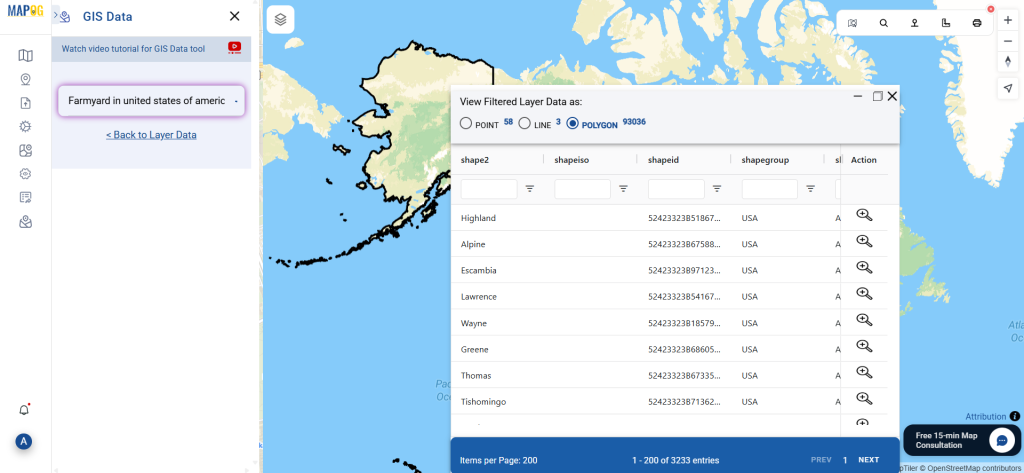
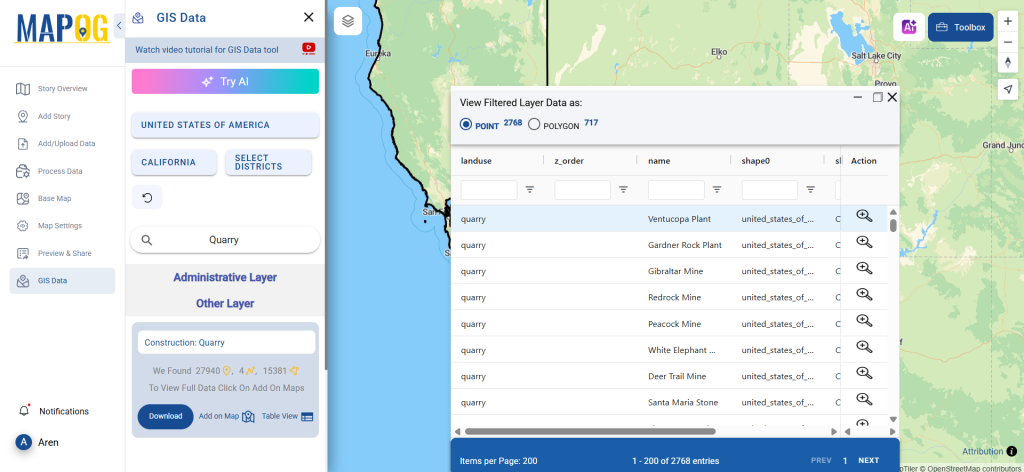
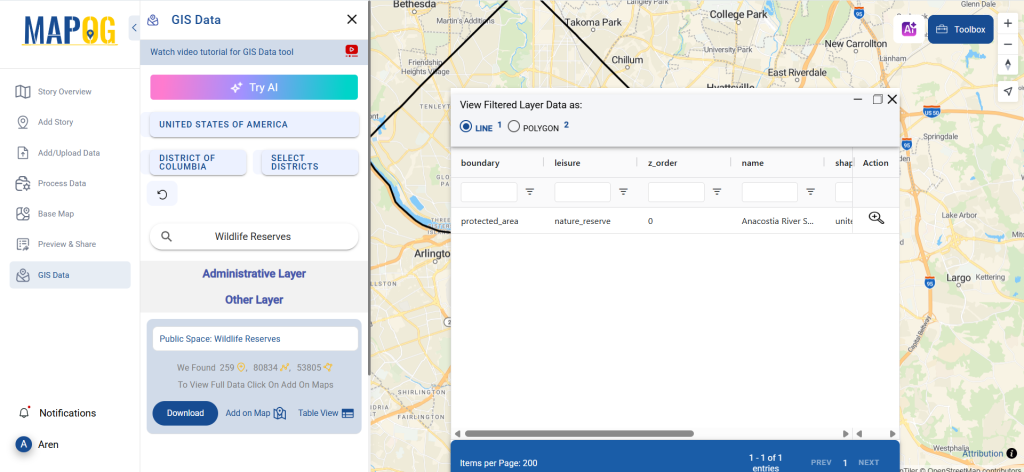
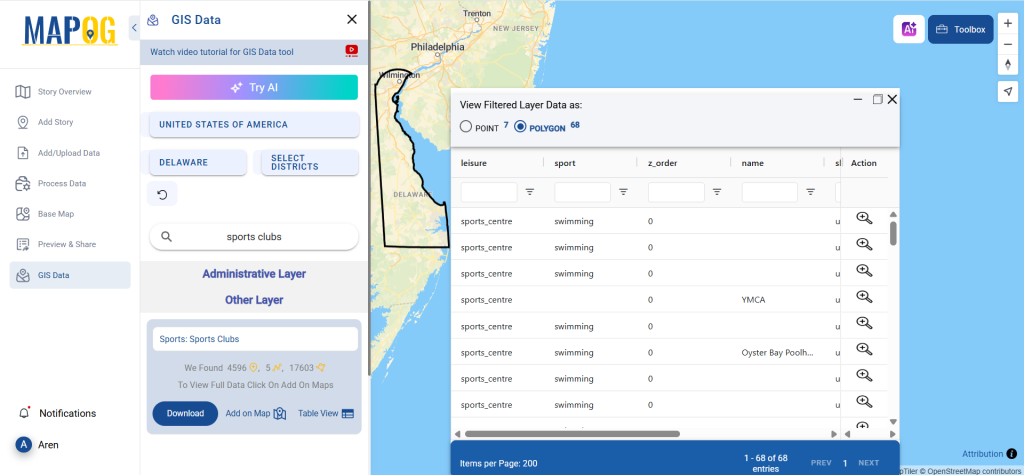
Step 4: Visualize Using ‘Add on Map’
With the Add on Map feature, users can preview and analyze the chosen data directly within MAPOG’s map interface. This interactive tool enhances spatial analysis by allowing users to overlay different layers, assess coverage, and plan infrastructure accordingly.
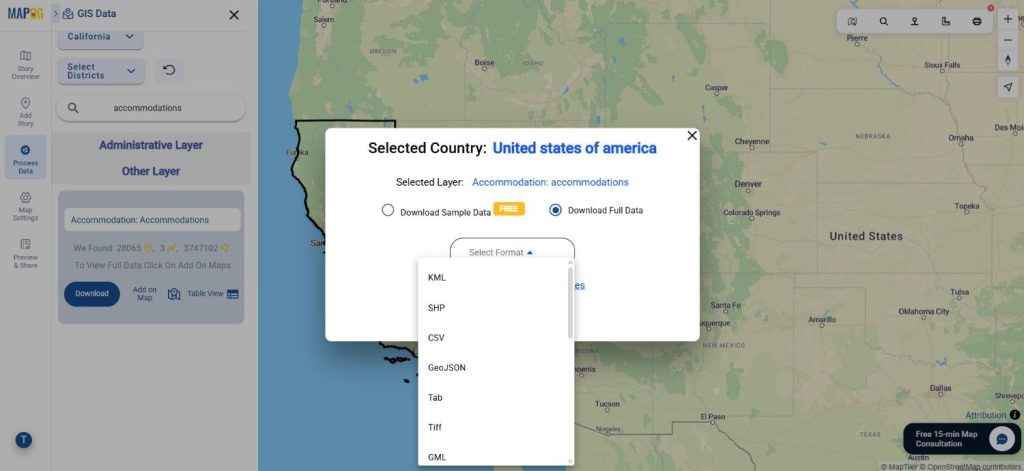
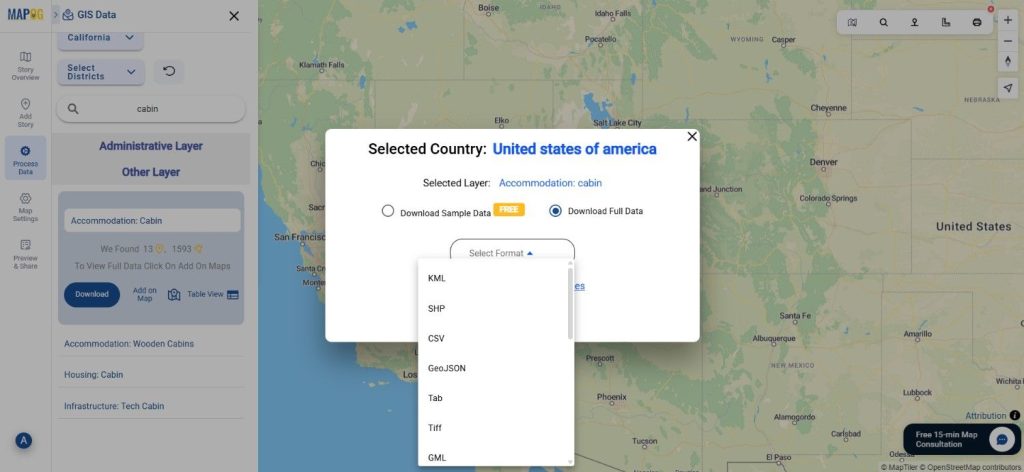
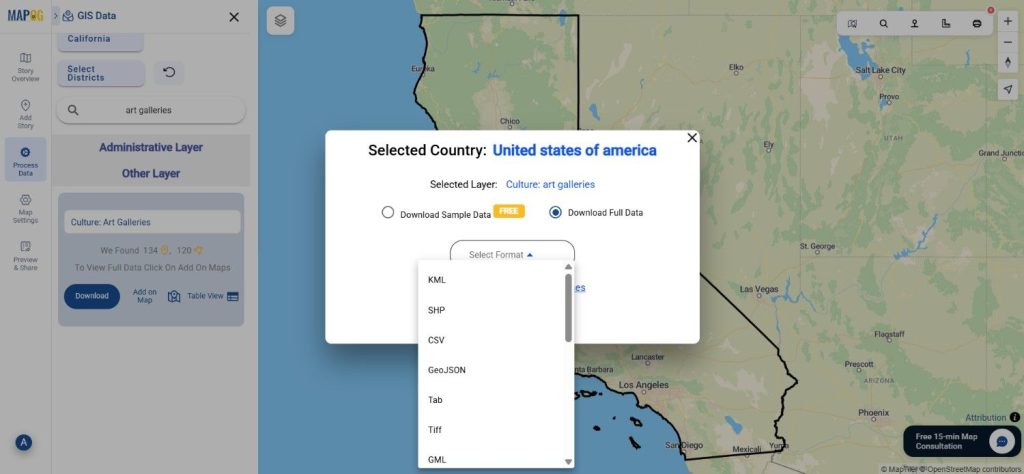
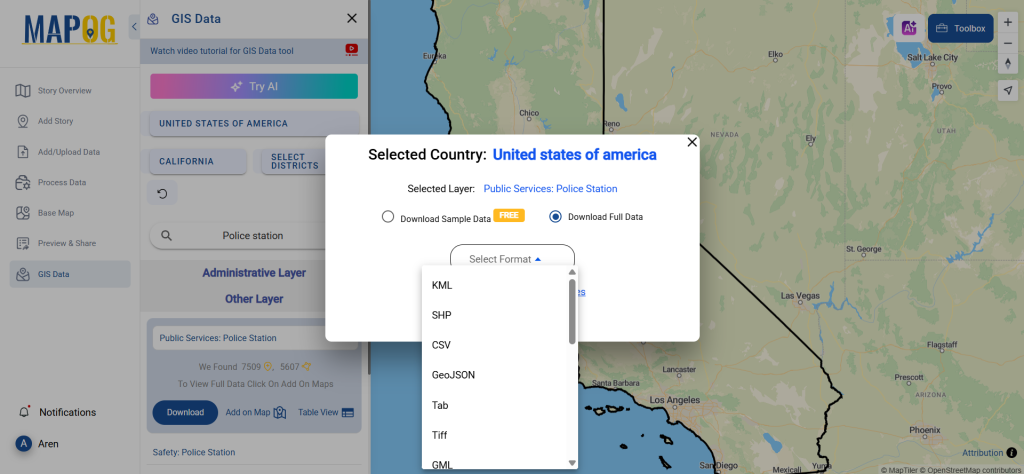
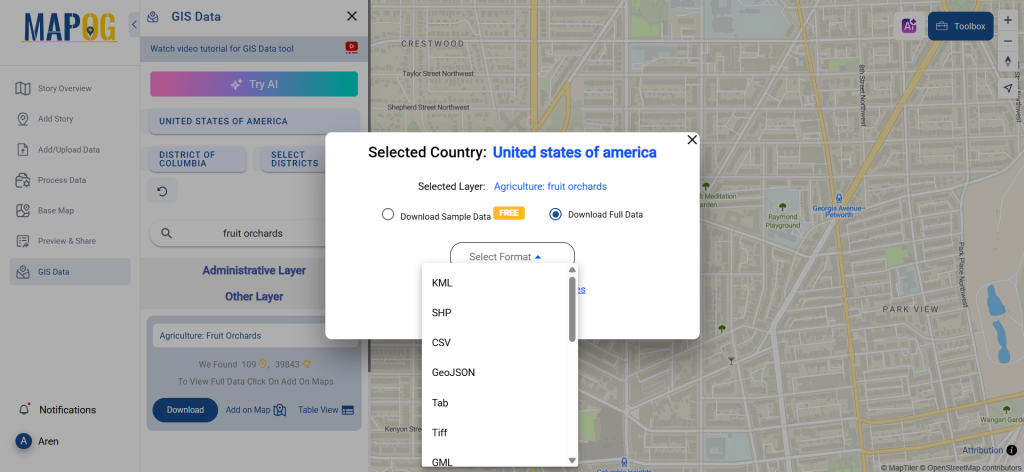
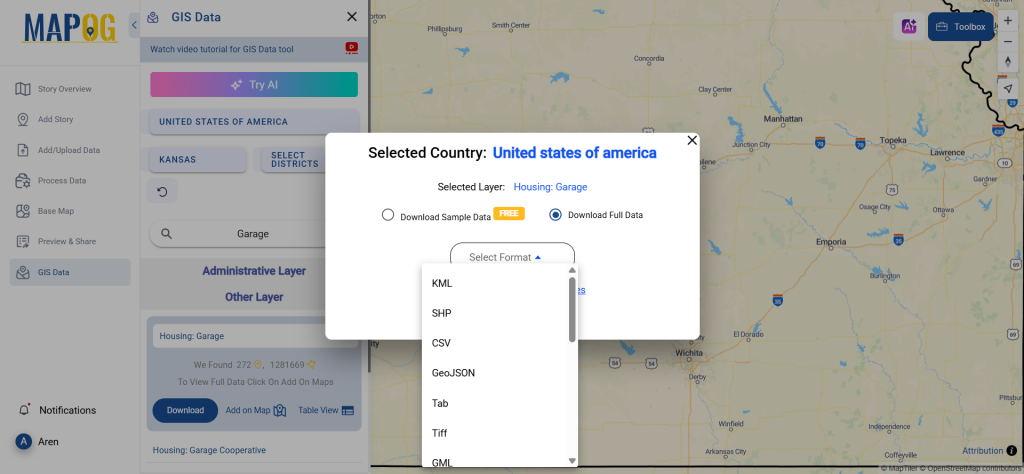
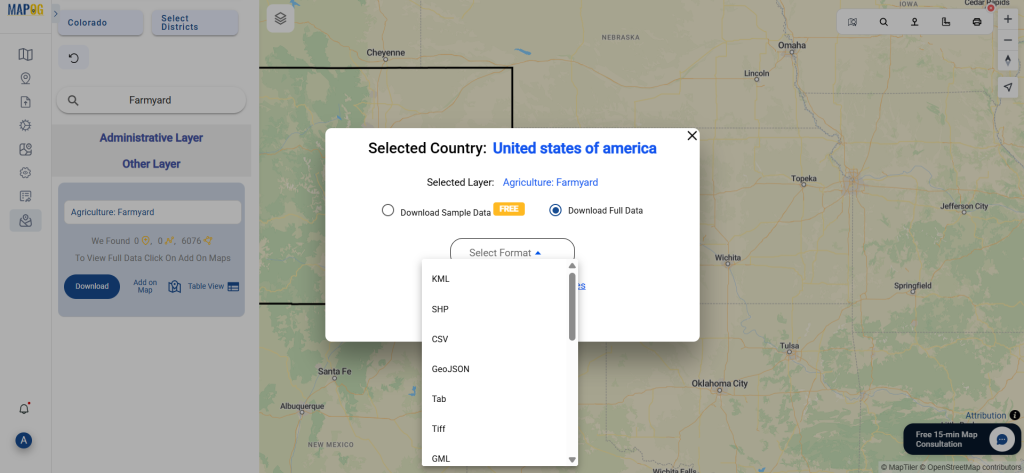
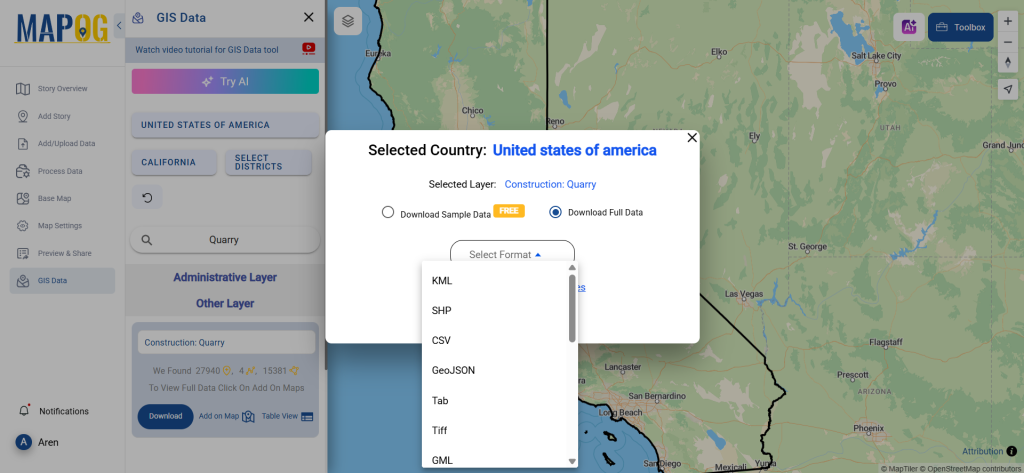
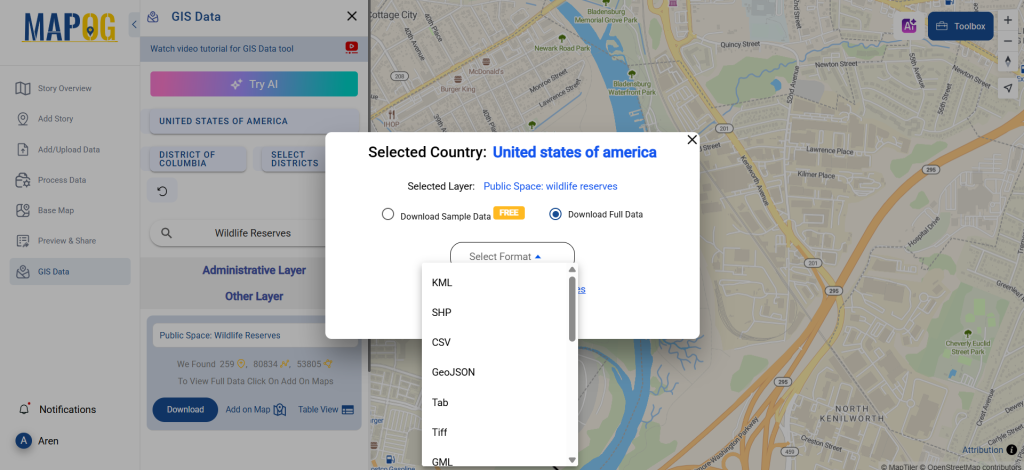
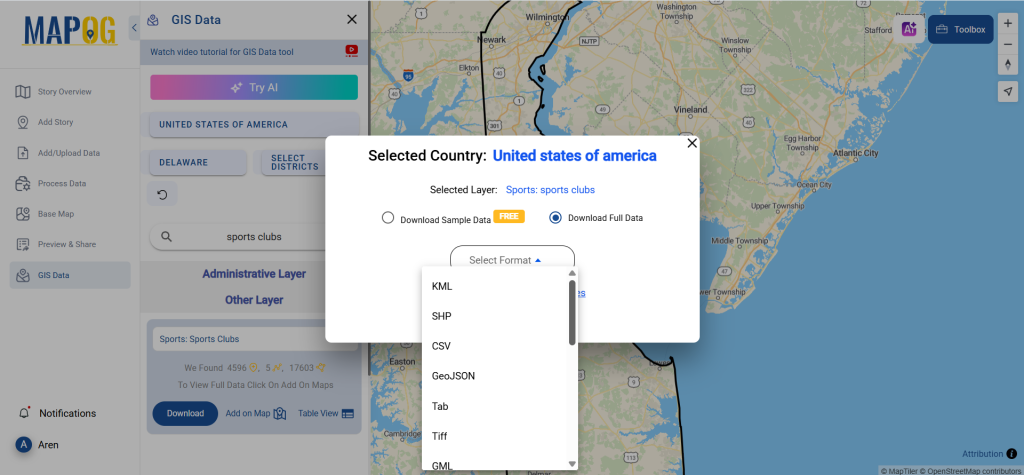
Step 5: Download Sports Club Data
After reviewing your dataset, click on “Download Data.” Choose between a sample or the full dataset. Select your desired format—Shapefile, KML, GeoJSON, MID, or others—agree to the terms, and complete your download
Final Thoughts
GIS Data by MAPOG makes it incredibly easy to download Sports Club Data in multiple GIS formats, catering to a wide range of users—from urban developers to academic researchers. With its powerful search, filtering, and visualization tools, MAPOG ensures that every user can access reliable, location-based sports infrastructure data for smarter, data-driven decisions.
With MAPOG’s versatile toolkit, you can effortlessly upload vector and upload Excel or CSV data, incorporate existing layers, perform polyline splitting, use the converter for various formats, calculate isochrones, and utilize the Export Tool.
For any questions or further assistance, feel free to reach out to us at support@mapog.com. We’re here to help you make the most of your GIS data.
Download Shapefile for the following:
- World Countries Shapefile
- Australia
- Argentina
- Austria
- Belgium
- Brazil
- Canada
- Denmark
- Fiji
- Finland
- Germany
- Greece
- India
- Indonesia
- Ireland
- Italy
- Japan
- Kenya
- Lebanon
- Madagascar
- Malaysia
- Mexico
- Mongolia
- Netherlands
- New Zealand
- Nigeria
- Papua New Guinea
- Philippines
- Poland
- Russia
- Singapore
- South Africa
- South Korea
- Spain
- Switzerland
- Tunisia
- United Kingdom Shapefile
- United States of America
- Vietnam
- Croatia
- Chile
- Norway
- Maldives
- Bhutan
- Colombia
- Libya
- Comoros
- Hungary
- Laos
- Estonia
- Iraq
- Portugal
- Azerbaijan
- Macedonia
- Romania
- Peru
- Marshall Islands
- Slovenia
- Nauru
- Guatemala
- El Salvador
- Afghanistan
- Cyprus
- Syria
- Slovakia
- Luxembourg
- Jordan
- Armenia
- Haiti And Dominican Republic
- Malta
- Djibouti
- East Timor
- Micronesia
- Morocco
- Liberia
- Kosovo
- Isle Of Man
- Paraguay
- Tokelau
- Palau
- Ile De Clipperton
- Mauritius
- Equatorial Guinea
- Tonga
- Myanmar
- Thailand
- New Caledonia
- Niger
- Nicaragua
- Pakistan
- Nepal
- Seychelles
- Democratic Republic of the Congo
- China
- Kenya
- Kyrgyzstan
- Bosnia Herzegovina
- Burkina Faso
- Canary Island
- Togo
- Israel And Palestine
- Algeria
- Suriname
- Angola
- Cape Verde
- Liechtenstein
- Taiwan
- Turkmenistan
- Tuvalu
- Ivory Coast
- Moldova
- Somalia
- Belize
- Swaziland
- Solomon Islands
- North Korea
- Sao Tome And Principe
- Guyana
- Serbia
- Senegal And Gambia
- Faroe Islands
- Guernsey Jersey
- Monaco
- Tajikistan
- Pitcairn
Disclaimer : The GIS data provided for download in this article was initially sourced from OpenStreetMap (OSM) and further modified to enhance its usability. Please note that the original data is licensed under the Open Database License (ODbL) by the OpenStreetMap contributors. While modifications have been made to improve the data, any use, redistribution, or modification of this data must comply with the ODbL license terms. For more information on the ODbL, please visit OpenStreetMap’s License Page.
Here are some blogs you might be interested in:
- Download Airport data in Shapefile, KML , MIf +15 GIS format – Filter and download
- Download Bank Data in Shapefile, KML, GeoJSON, and More – Filter and Download
- Download Railway data in Shapefile, KML, GeojSON +15 GIS format
- Download Farmland Data in Shapefile, KML, GeoJSON, and More – Filter and Download
- Download Pharmacy Data in Shapefile, KML, GeoJSON, and More – Filter and Download
- Download ATM Data in Shapefile, KML, MID +15 GIS Formats Using GIS Data by MAPOG
- Download Road Data in Shapefile, KML, GeoJSON, and 15+ GIS Form