Labeling is the art of arranging text on a map in relation to map symbols, which together represent features and attributes in the real world. It specifically refers to the process of automatically generating and setting descriptive text for features in a map. So here in this article, steps are provided on how to upload gis data and label the features.
GIS helps users to understand patterns, relationships, and geographic context. Its benefit includes improved communication and efficiency, as well as improved management and decision-making. GIS combines datasets with maps, and integrated regional datasets with any type of descriptive information or data. It provides mapping and assessment prerequisites for technology and almost every industry.
IGISMap is a web platform providing multiple GIS applications that are most important in the field of geospatial analytics. Label Feature tool from IGISMap is designed to label the region’s GIS data. In this IGISMap tool, we can easily plot the text data. Users can format text data according to presentation requirements. The color of the text, its size, everything can be adjusted.
In IGISMap there is using the Label Feature tool which is a powerful GIS tool to plot text data of the point GIS data. Let’s see the process of labeling the text data of a region as shown below.
If you have data then upload using the following steps if not download from gis data. For Adding data from IGISMAP check this – Add GIS data and label features in map.
How to upload GIS data and label the features
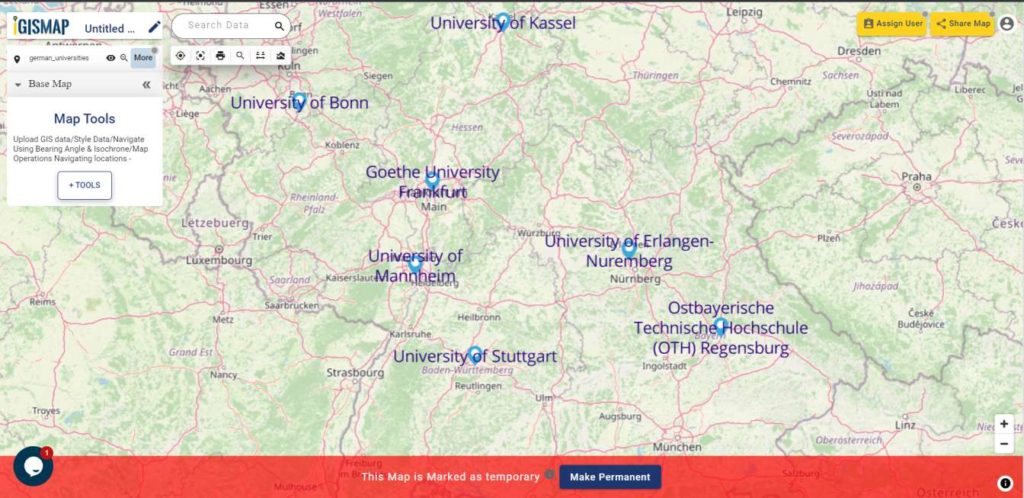
In this article, we will discuss the labeling of points GIS data. For this, we will upload the GIS data by using the Upload Vector File tool of IGISMap. Here we describe labeling the University locations in Germany using the Label Feature tool of IGISMap.
to assess the Upload Vector File tool directly click-https://story.mapog.com/app/tools/vector
Upload the point GIS data
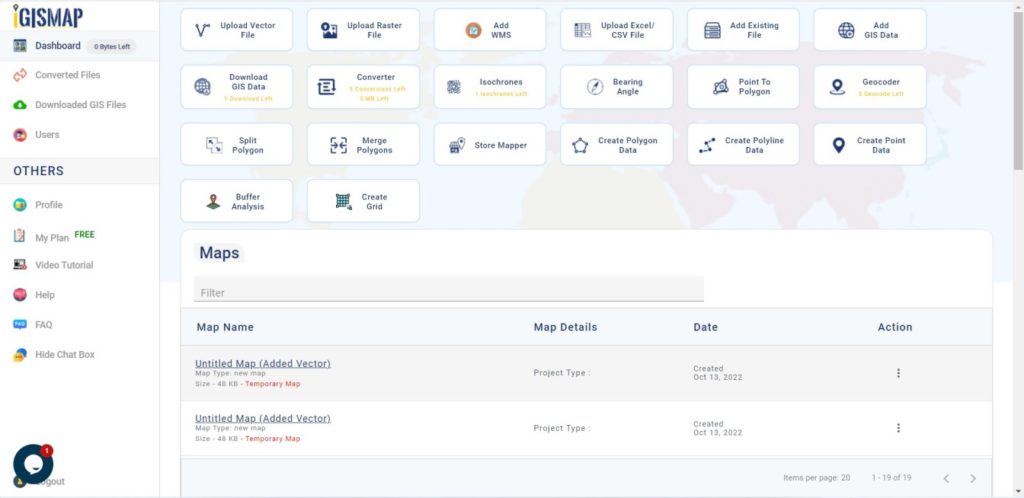
After login in to the IGISMap on the dashboard, there are many tools. From them, we have to click on the Upload Vector File tool.
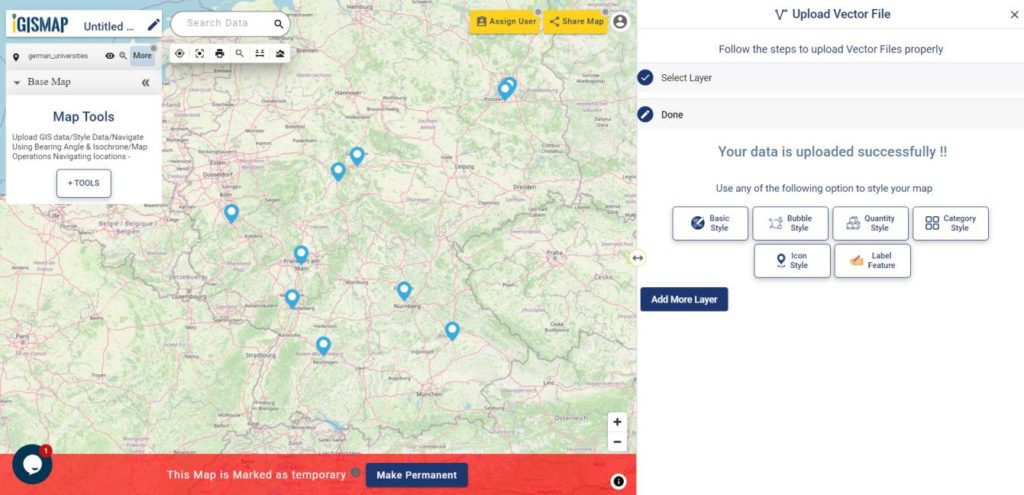
That will open the Upload Vector File tool. First step is Select Layer.
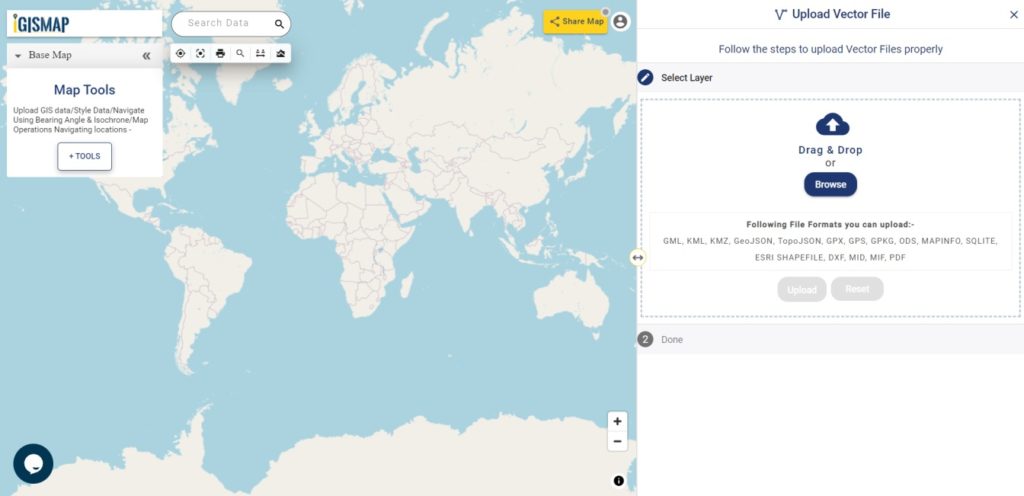
Upload Vector File tool
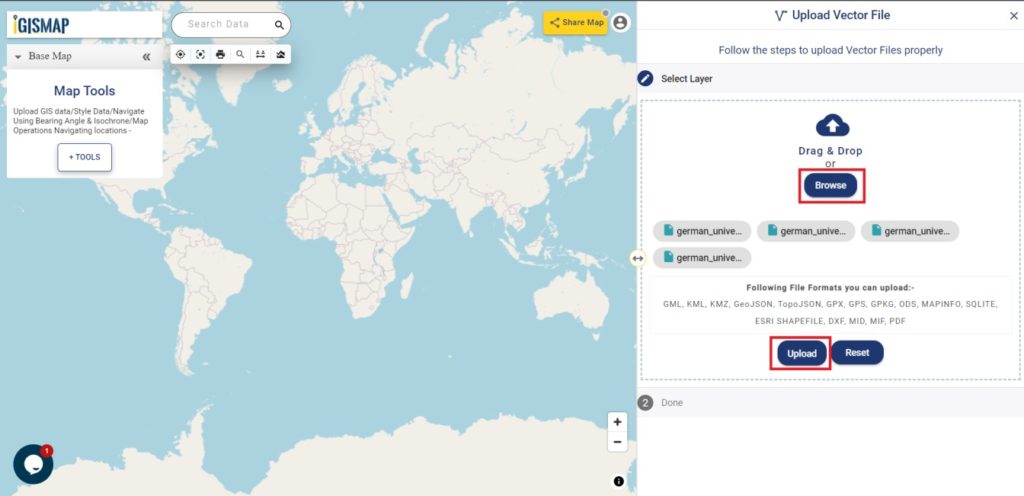
After opening the Upload Vector File tool, we can upload the vector file of various file formats that we have e.g. GML, KML, KMZ, GeoJSON, TopoJSON, GPX, GPS, GPKG, ODS, MAPINFO, SOLITE, ESRI SHAPEFILE DXF MID, MIF, PDF. In the Select Layer section we can Drag &Drop the file or we can Browse the file. For this article, we Browse the file by clicking Browse and selecting the file (german _universities shapefile) from the desktop and then Upload it.
After uploading the data point layer is visible on the screen of IGISMap.
Opening Label Feature tool
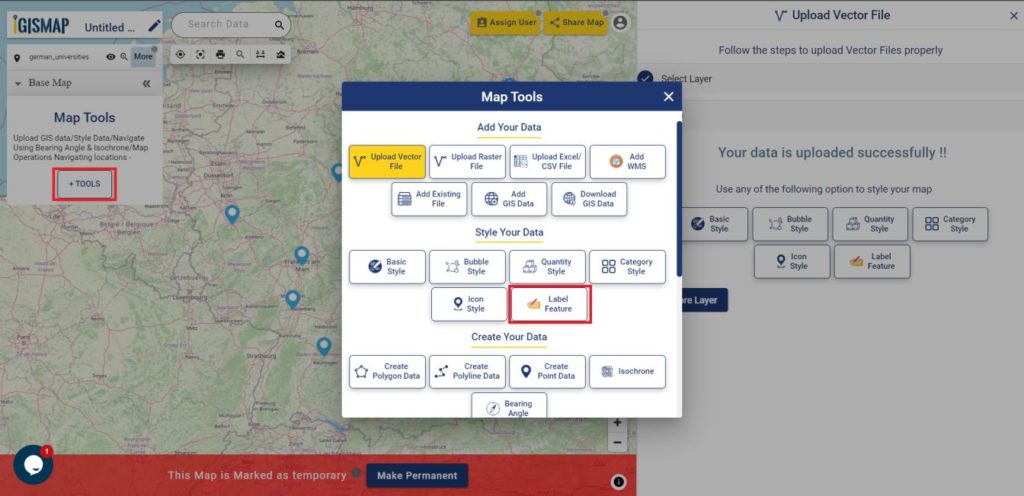
After uploading the point GIS data from Upload Vector File, we can label the German university’s point GIS data using the Label Feature tool. For accessing the tool, click the Tools button at the upper left side of the screen to open the map tools popup. Then select the Label Feature tool listed under the Style Your Data section.
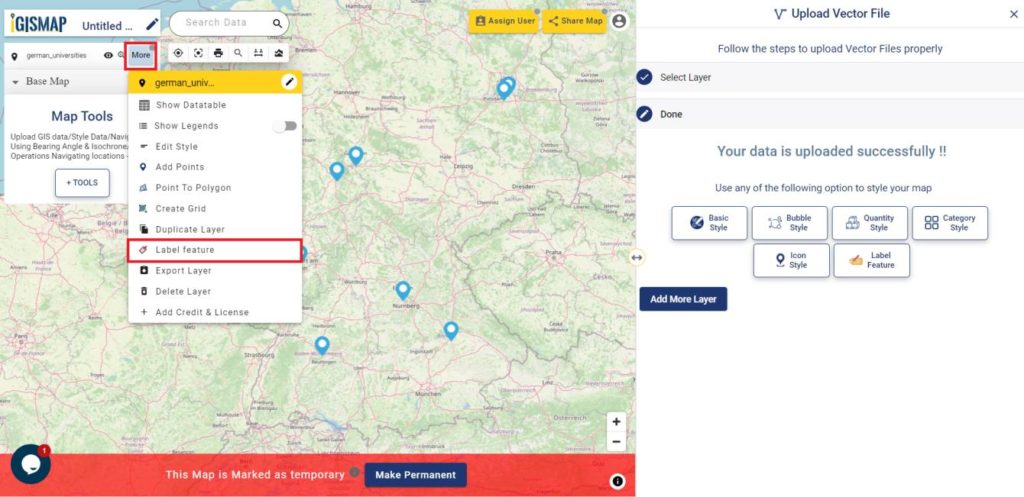
We can also open the Label Feature tool by going to the More option of the polygon GIS data and choosing the Label Feature tool.
Labeling the point GIS data
Then the tool appears on the screen of IGISMap.
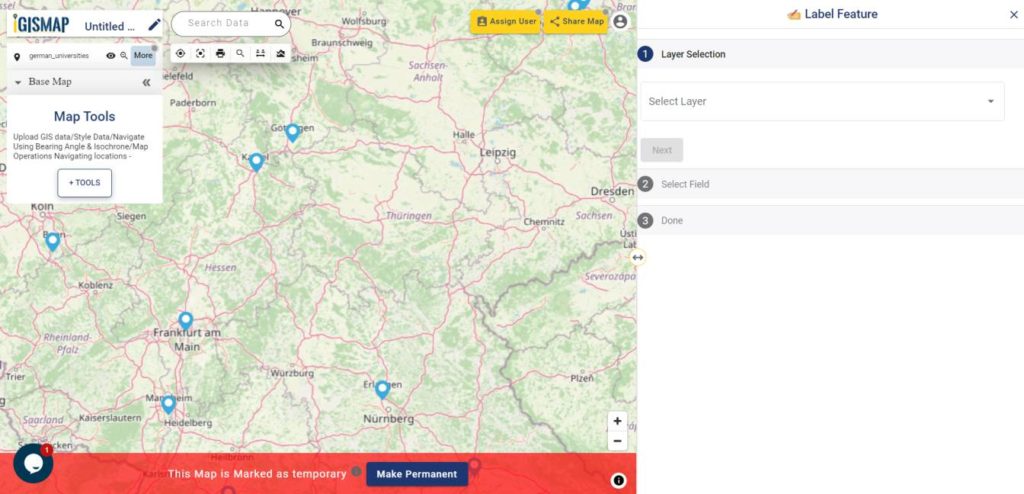
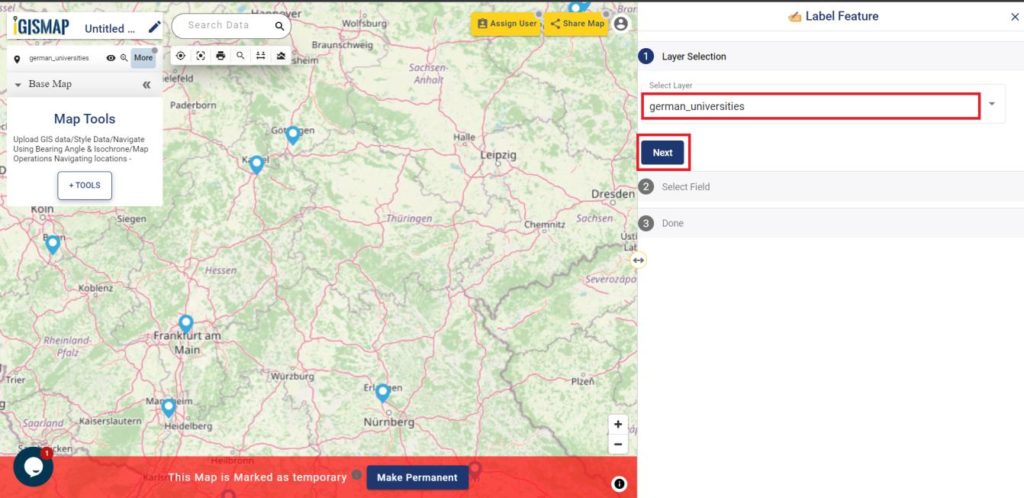
Then the tool appears and we have to select the layer from the Select Layer section which is the ‘German_universities’ data that is published in this map and then we have to click the Next option.
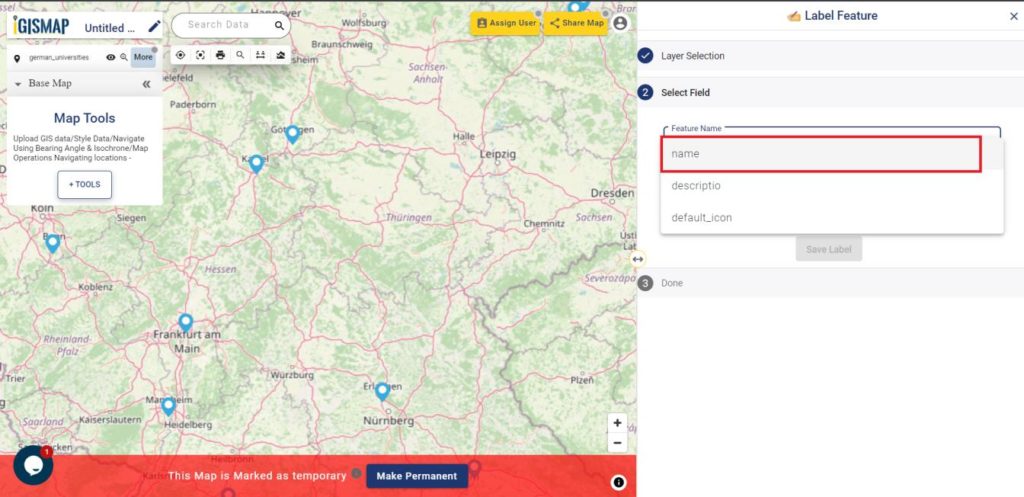
After clicking Next, in the Select Field section, Here we have to select the appropriate field in the Feature Name section from the drop-down box as required.
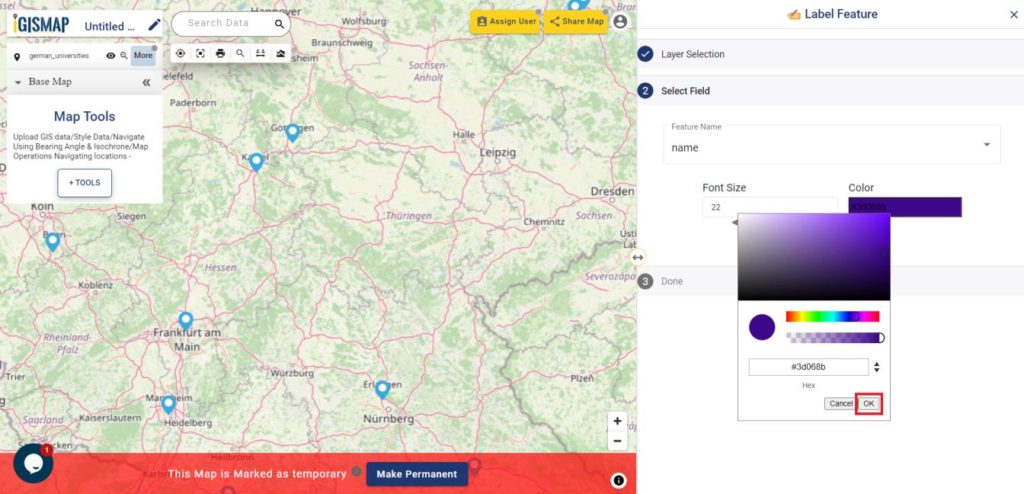
We can change the size of text which will be plotted on the map by Font Size and select the appropriate color from the drop-down box as required by the Color section. Then we have to click OK.
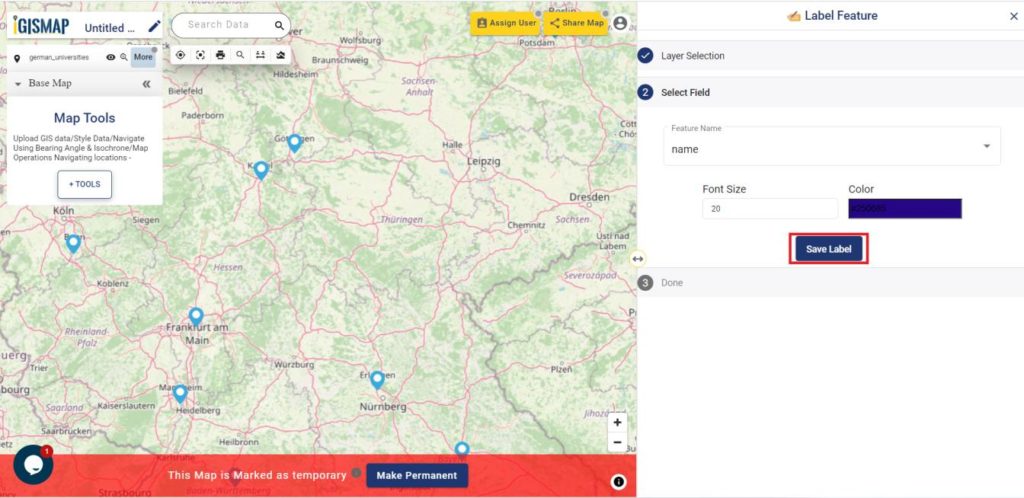
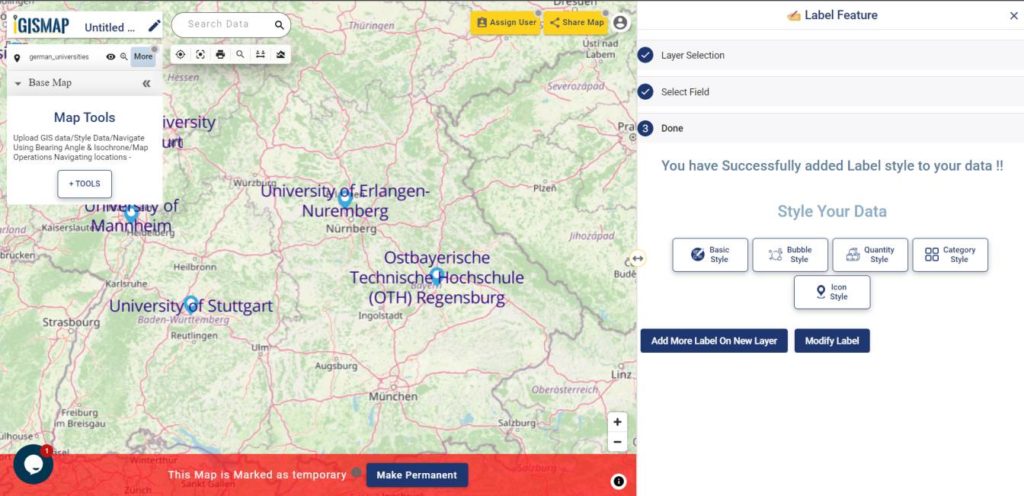
After selecting the features name and changing the color and size of the features we have to click on Save Label for labeling the German Universities point GIS data.
Following all steps properly we get the desired output of universities point GIS data on the screen of IGISMap.
In the above steps, you learn how to upload gis data and label the features of the map. If you want to share, export, or embed the map on your website.
Try our online polygon merge feature in one layer.