QGIS 3.2.1 works well for creating interactive maps, using good set of tools and symbology its become easy to implement. In the previous post we learn how to open and view vector data. So, today we are Creating a Basic Map – QGIS. For creating basic map we work with the vector data. Vector data is very common data format it describes the information in points, lines and polygons.
Creating a Basic Map: Adding vector layer
If you are not familiar with QGIS user interface then check our previous article QGIS 3.2.1 GUI
- Open QGIS, we have a new blank map.
- Add vector layer by choosing the icon.
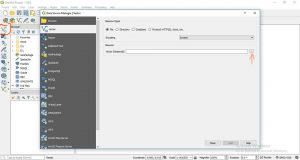
- In the dialog box, click on the Browse button. And navigate to the exercise data. (before using make sure to download the Exercise data)

- Select the appropriate file, let say select road.shp
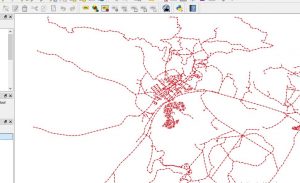
- Here you are, this is your basic map
- Save the project.
View attributes
If you are absolute beginners then question comes in your mind what is attributes. No worries when we are here, attributes is a data which store information about spatial data. It gives where, what and why about spatial data in tabular form.
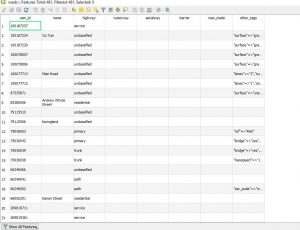
So for roads, the layer we loaded in our basic map we will view its attributes. ->> Click on ![]() this icon for opening attribute table or you can use F6 or Go to Layer>> Open attribute table.
this icon for opening attribute table or you can use F6 or Go to Layer>> Open attribute table.
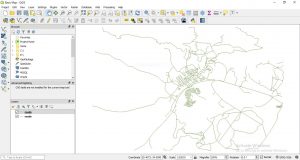
->> This attribute table provides more data about road layer, the lines that you see in the map are spatial data. These lines represents the roads.
Current basic map is not so easy to read. We will make it more understandable and interactive using Symbology (use of symbol).
Symbology
In the cartography design, symbology is technique to use symbols to represent graphic features of map. Visual appearance is very much important. Follow the steps for making your map more attractive –
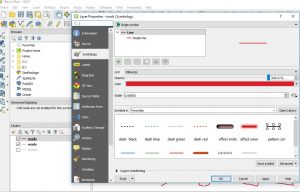
- Click two times on layer>> Layer properties dialog box will appear. Select symbology OR right on the layer>> click the layer properties in the menu. Symbology window shown below.
This all the creating a basic map – QGIS. Symbology is useful but the information contained in the layer is still hidden. In the next blog we will learn how to represent this data on map.
Hope it will be useful for GIS professional. Suggestions and feedback are most welcomed.
More on QGIS:
