Download Macedonia Administrative Boundary Shapefiles – National , Regions , Villages and More

Download Macedonia administrative boundary shapefiles- Macedonia National , Regions , Villages Shapefile and more.

It’s fantastic to hear that IGISMAP has expanded its GIS data collection to include data for more than 100 new countries, bringing the total coverage to over 150 countries. This is undoubtedly a valuable resource for GIS enthusiasts and professionals around the world. The availability of detailed information on administrative divisions, rivers, roads, and airports can greatly enhance various geospatial projects and analyses.

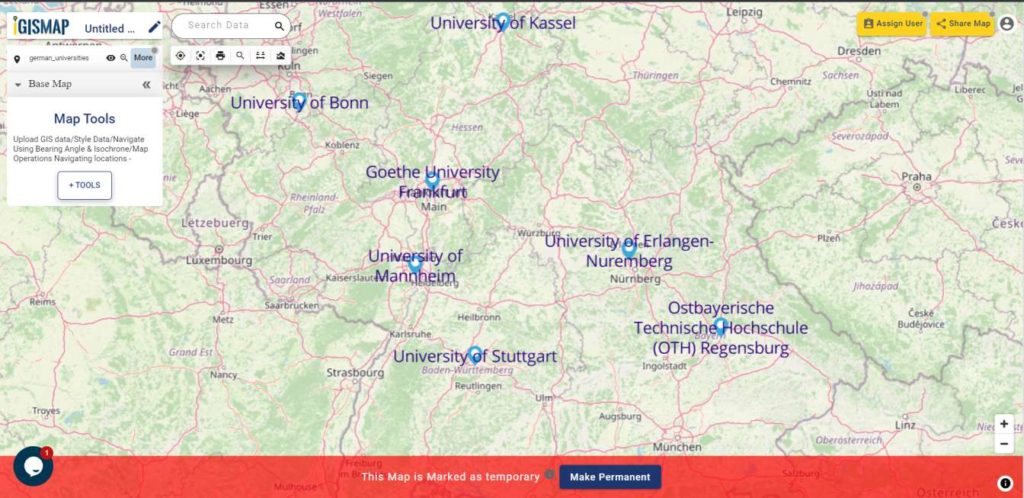
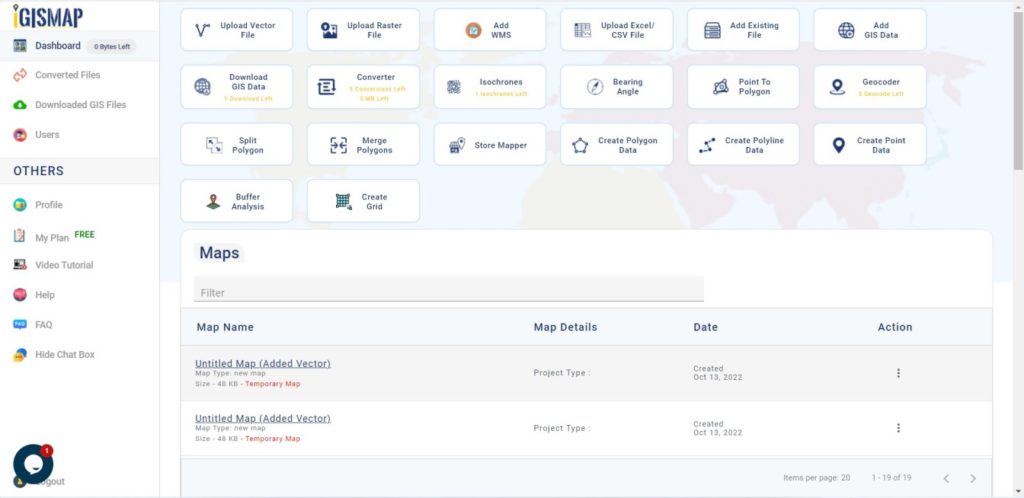
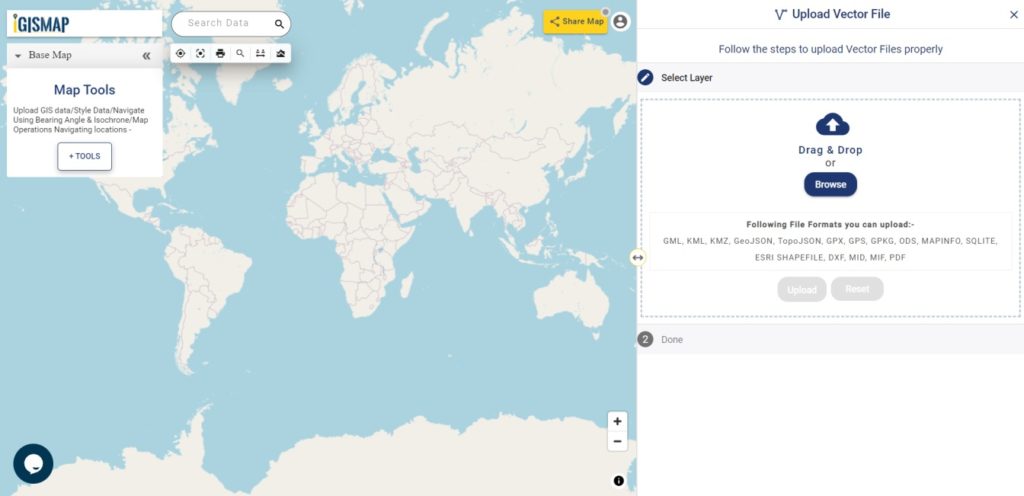
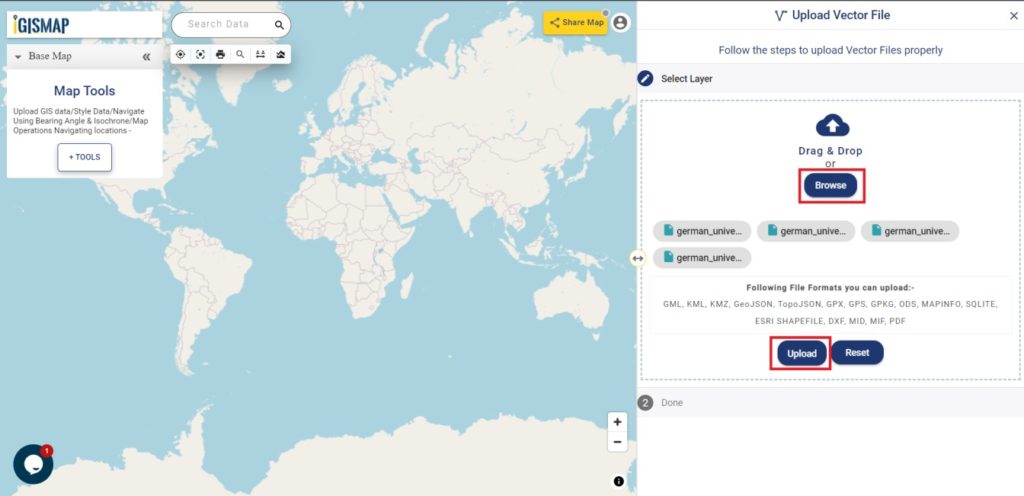
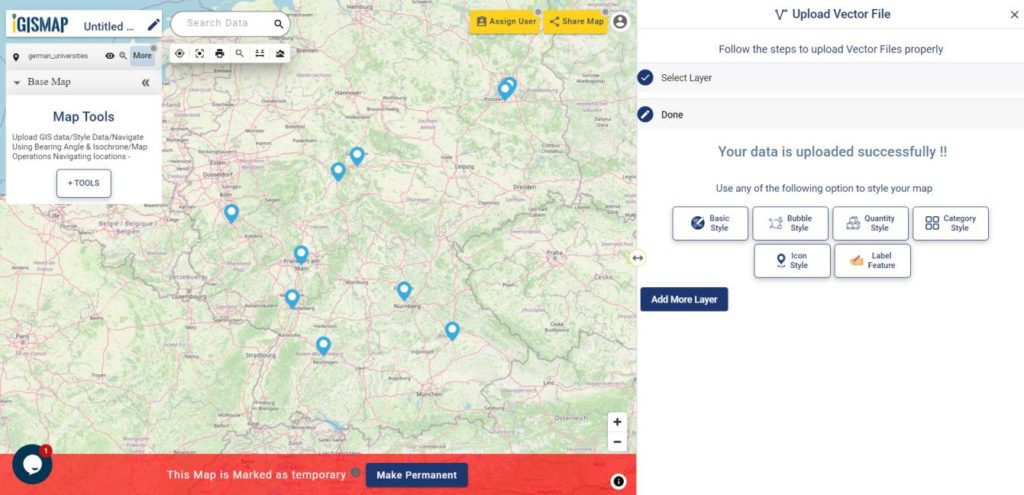
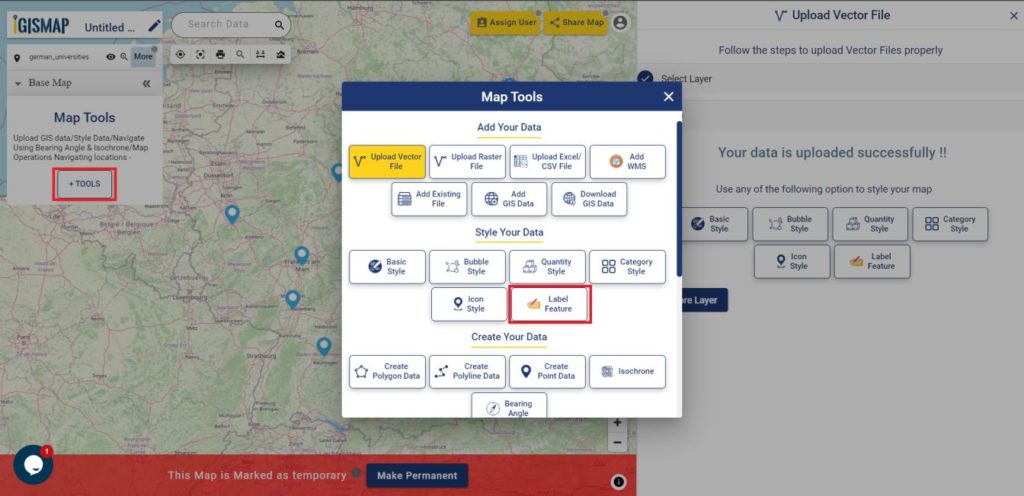
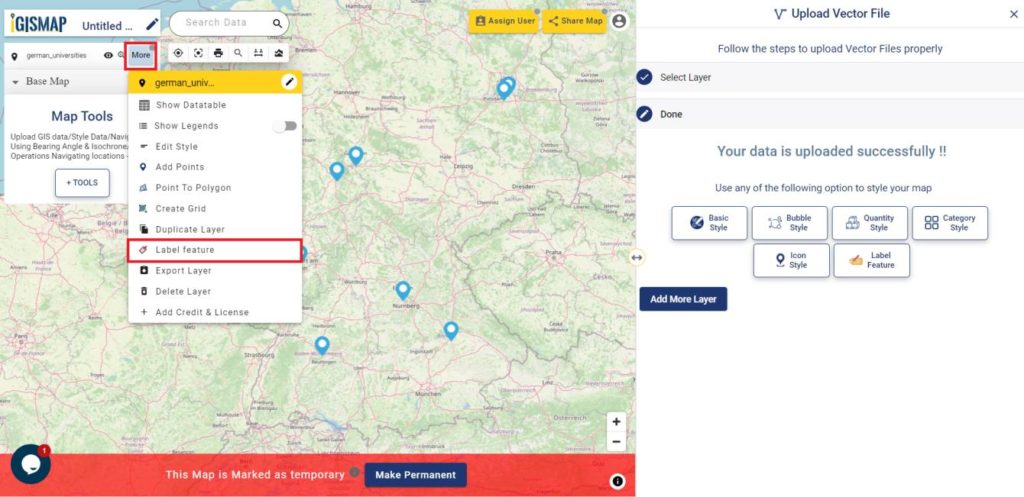
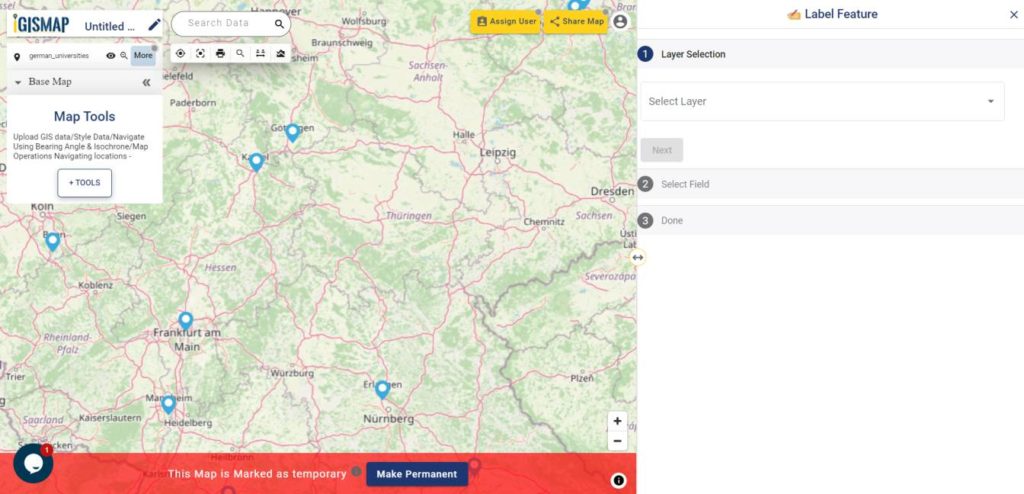
The option to access the data through tools like “Download GIS Data” and “Add GIS Data” seems convenient and user-friendly. Providing data in different formats such as Shapefile, KML, GeoJSON, and CSV ensures compatibility with a wide range of GIS software and applications, making it easier for users to integrate the data into their workflows.

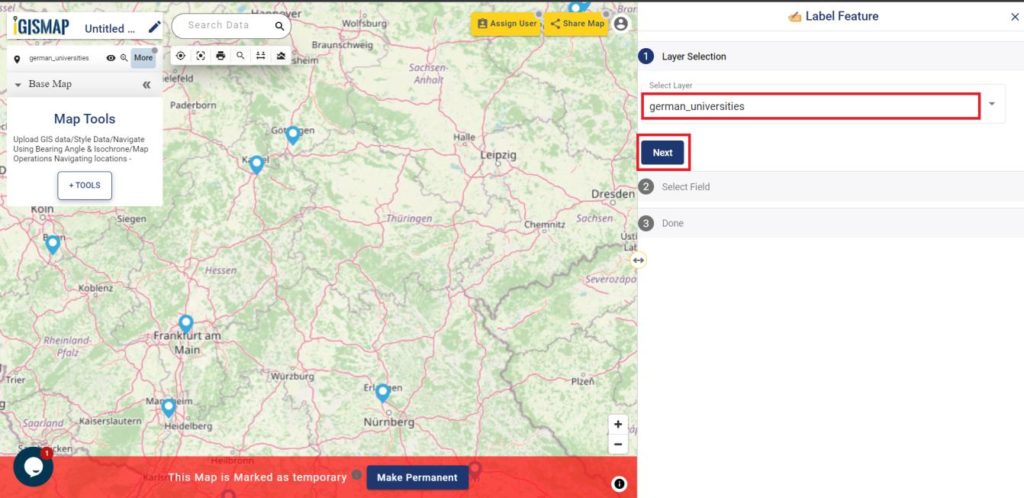
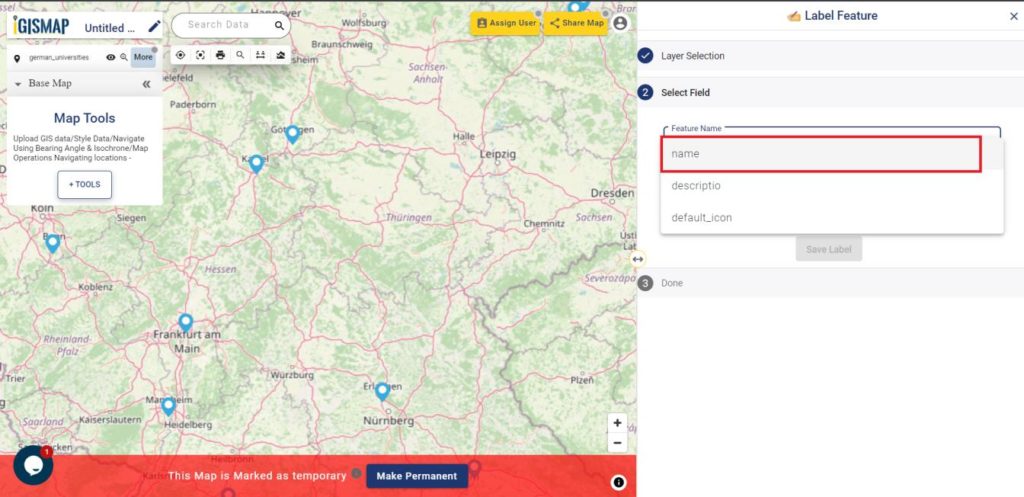
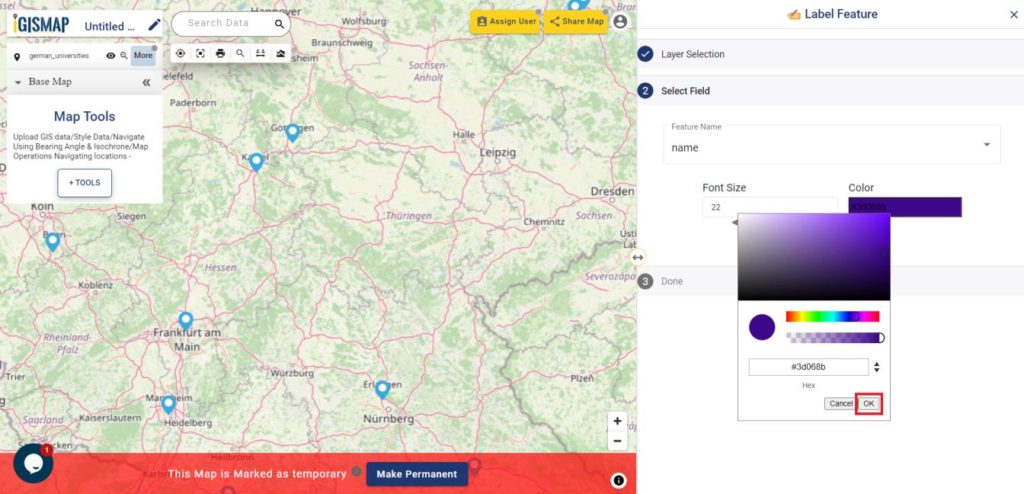
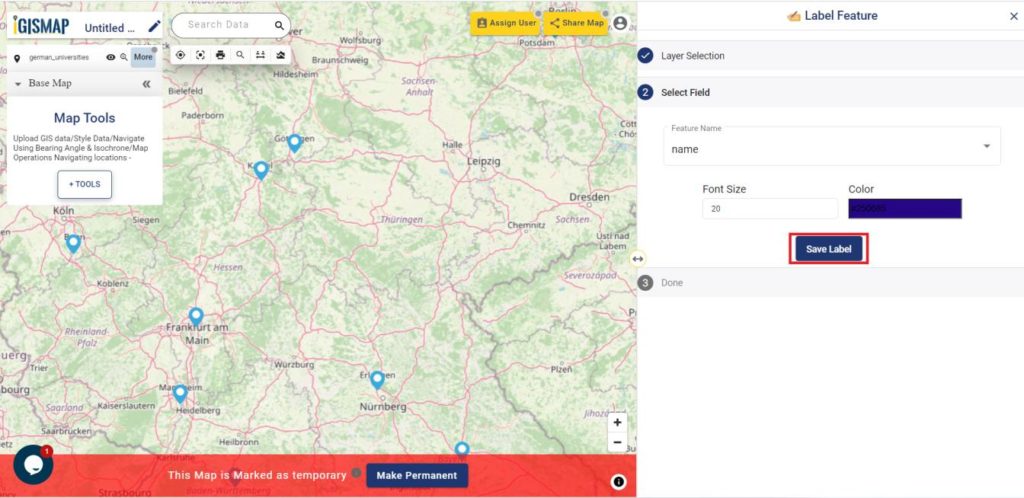
This article will walk you through downloading administrative-level GIS data for Macedonia using the Download GIS Data tool. Experience a seamless geospatial journey with IGISMAP as your trusted partner!

Note:

  • All data available are in GCS datum EPSG:4326 WGS84 CRS (Coordinate Reference System).
  • You need to login for downloading the shapefile.

Download Shapefile Data of Macedonia

North Macedonia is a country situated in southeastern Europe with geographic coordinates 41°50′N 22°00′E, bordering Kosovo and Serbia to the north, Bulgaria to the east, Greece to the south and Albania to the west. The country is part of the wider region of Macedonia and makes up most of Vardar Macedonia. The country is a major transportation corridor from Western and Central Europe to Southern Europe and the Aegean Sea. North Macedonia is a landlocked country but has three major natural lakes: Lake Ohrid, Lake Prespa and Lake Dojran. It has a water area of 857 km2, while its land area is 24,856 km2.

Macedonia National Boundary

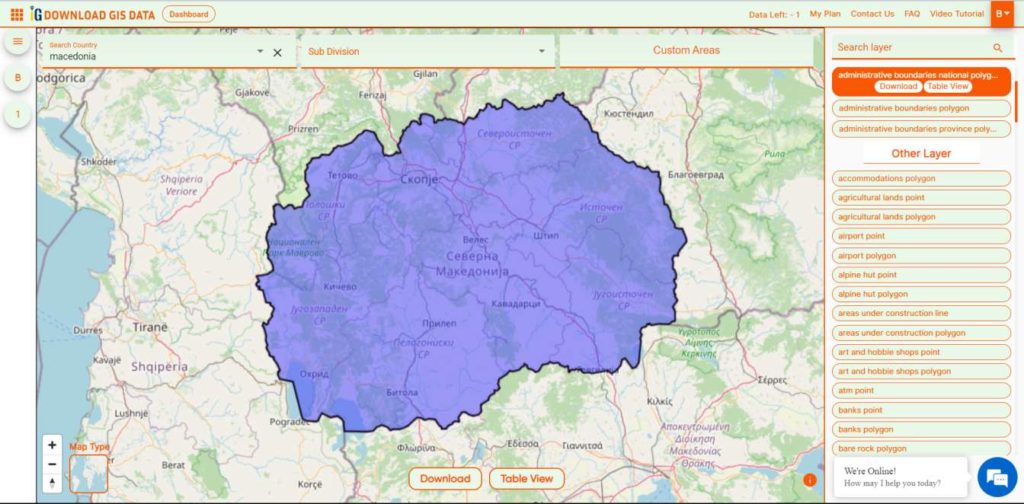
Download Macedonia National Boundary Shapefile

Download Macedonia Regions Shapefile Data

 Macedonia is divided into 8 regions.

  • Eastern
  • Northeastern
  • Pelagonia
  • Polog
  • Skopje
  • Southeastern
  • Southwestern
  • Vardar
Macedonia Regions Boundaries

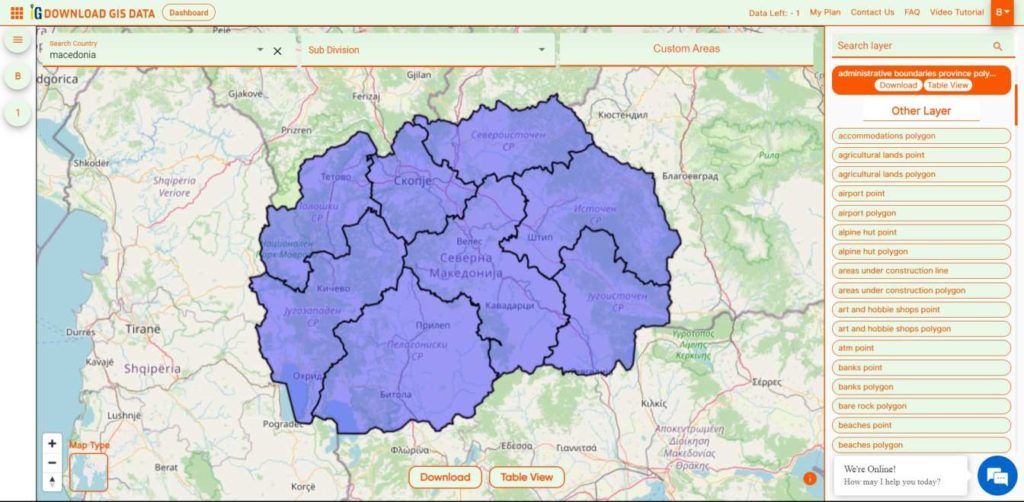
Download Macedonia Regions Boundaries Shapefile

Download Macedonia Villages Shapefile Data

There are Total 1725 Villages in Macedonia.

Macedonia Villages Boundaries

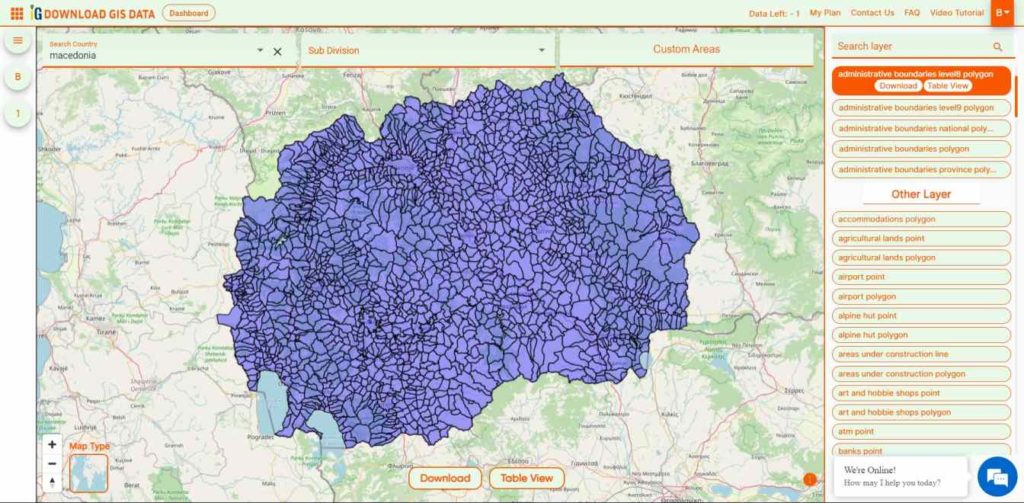
Download Macedonia Villages Boundaries Shapefile

Other GIS Data:

Download Free Shapefile for the following:

  1. World Countries Shapefile
  2. Australia
  3. Argentina
  4. Austria
  5. Belgium
  6. Brazil
  7. Canada
  8. Denmark
  9. Fiji
  10. Finland
  11. Germany
  12. Greece
  13. India
  14. Indonesia
  15. Ireland
  16. Italy
  17. Japan
  18. Kenya
  19. Lebanon
  20. Madagascar
  21. Malaysia
  22. Mexico
  23. Mongolia
  24. Netherlands
  25. New Zealand
  26. Nigeria
  27. Papua New Guinea
  28. Philippines
  29. Poland
  30. Russia
  31. Singapore
  32. South Africa
  33. South Korea
  34. Spain
  35. Switzerland
  36. Tunisia
  37. United Kingdom Shapefile
  38. United States of America
  39. Vietnam
  40. Norway
  41. Chile
  42. Croatia
  43. Estonia
  44. Laos
  45. Hungary
  46. Libya
  47. Comoros
  48. Colombia
  49. Bhutan
  50. Maldives
  51. Iraq
  52. Azerbaijan
  53. Portugal

Disclaimer : If you find any shapefile data of country provided is incorrect do contact us or comment below, so that we will correct the same in our system as well we will try to correct the same in OpenStreetMap.

Upload GIS data and label the features – IGISMap Tool

Labeling is the art of arranging text on a map in relation to map symbols, which together represent features and attributes in the real world. It specifically refers to the process of automatically generating and setting descriptive text for features in a map. So here in this article, steps are provided on how to upload gis data and label the features.

GIS helps users to understand patterns, relationships, and geographic context. Its benefit includes improved communication and efficiency, as well as improved management and decision-making. GIS combines datasets with maps, and integrated regional datasets with any type of descriptive information or data. It provides mapping and assessment prerequisites for technology and almost every industry.

IGISMap is a web platform providing multiple GIS applications that are most important in the field of geospatial analytics. Label Feature tool from IGISMap is designed to label the region’s GIS data. In this IGISMap tool, we can easily plot the text data. Users can format text data according to presentation requirements. The color of the text, its size, everything can be adjusted.

In IGISMap there is using the Label Feature tool which is a powerful GIS tool to plot text data of the point GIS data. Let’s see the process of labeling the text data of a region as shown below.

Labeling of German universities

If you have data then upload using the following steps if not download from gis data. For Adding data from IGISMAP check this – Add GIS data and label features in map.

How to upload GIS data and label the features

In this article, we will discuss the labeling of points GIS data. For this, we will upload the GIS data by using the Upload Vector File tool of IGISMap. Here we describe labeling the University locations in Germany using the Label Feature tool of IGISMap.

to assess the Upload Vector File tool directly click-https://map.igismap.com/upload-vector-files.

Upload the point GIS data

After login in to the IGISMap on the dashboard, there are many tools. From them, we have to click on the Upload Vector File tool.

Dashboard
Dashboard

That will open the Upload Vector File tool. First step is Select Layer.


Upload Vector File tool

Upload Vector File tool

After opening the Upload Vector File tool, we can upload the vector file of various file formats that we have e.g. GML, KML, KMZ, GeoJSON, TopoJSON, GPX, GPS, GPKG, ODS, MAPINFO, SOLITE, ESRI SHAPEFILE DXF MID, MIF, PDF. In the Select Layer section we can Drag &Drop the file or we can Browse the file. For this article, we Browse the file by clicking Browse and selecting the file (german _universities shapefile) from the desktop and then Upload it.

Upload Vector File-Upload the shapefile
Upload the shapefile

After uploading the data point layer is visible on the screen of IGISMap.

Successfully plotted the point data

Opening Label Feature tool

After uploading the point GIS data from Upload Vector File, we can label the German university’s point GIS data using the Label Feature tool. For accessing the tool, click the Tools button at the upper left side of the screen to open the map tools popup. Then select the Label Feature tool listed under the Style Your Data section.

Label Feature from Tools

We can also open the Label Feature tool by going to the More option of the polygon GIS data and choosing the Label Feature tool.

Label Feature from More section

Labeling the point GIS data

Then the tool appears on the screen of IGISMap.

Label Feature tool
Label Feature tool

Then the tool appears and we have to select the layer from the Select Layer section which is the ‘German_universities’ data that is published in this map and then we have to click the Next option.

Label Feature-Select the point GIS layer
Select the point GIS layer

After clicking Next, in the Select Field section, Here we have to select the appropriate field in the Feature Name section from the drop-down box as required.

Label Feature-Choose the Feature Name
Choose the Feature Name

We can change the size of text which will be plotted on the map by Font Size and select the appropriate color from the drop-down box as required by the Color section. Then we have to click OK.

Label Feature-Select the Color and Font Size
Select the Color

After selecting the features name and changing the color and size of the features we have to click on Save Label for labeling the German Universities point GIS data.

Label Feature-Save the Label of point GIS data
Save the Label of point GIS data

Following all steps properly we get the desired output of universities point GIS data on the screen of IGISMap.

Successfully added Label style of German universities point data
Successfully added Label style of German university’s point data

In the above steps, you learn how to upload gis data and label the features of the map. If you want to share, export, or embed the map on your website.

Try our online polygon merge feature in one layer.