It’s fantastic to hear that MAPOG has expanded its GIS data collection to include data for more than 100 new countries, bringing the total coverage to over 150 countries. This is undoubtedly a valuable resource for GIS enthusiasts and professionals around the world. The availability of detailed information on administrative divisions, rivers, roads, and airports can greatly enhance various geospatial projects and analyses.
The option to access the data through tools like “Download GIS Data” and “Add GIS Data” seems convenient and user-friendly. Providing data in different formats such as Shapefile, KML, GeoJSON, and CSV ensures compatibility with a wide range of GIS software and applications, making it easier for users to integrate the data into their workflows.
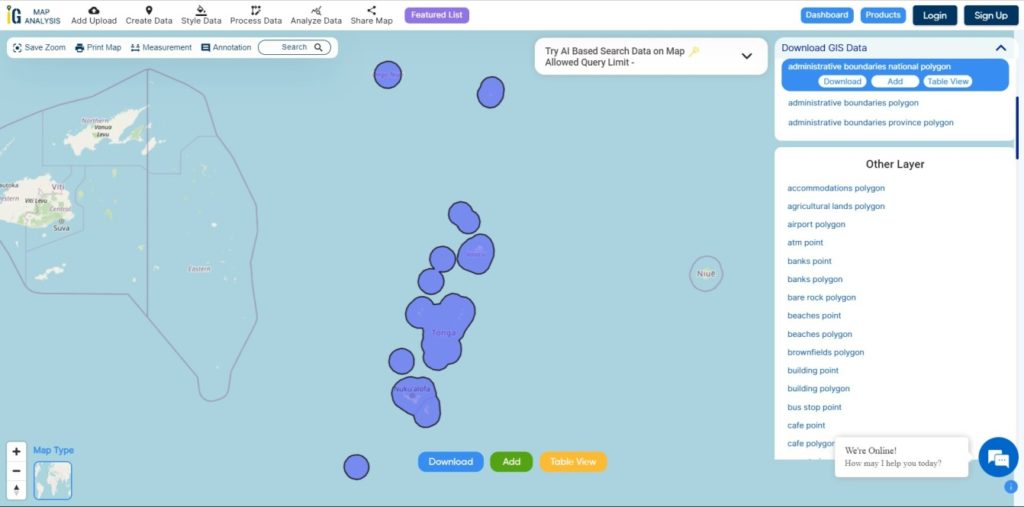
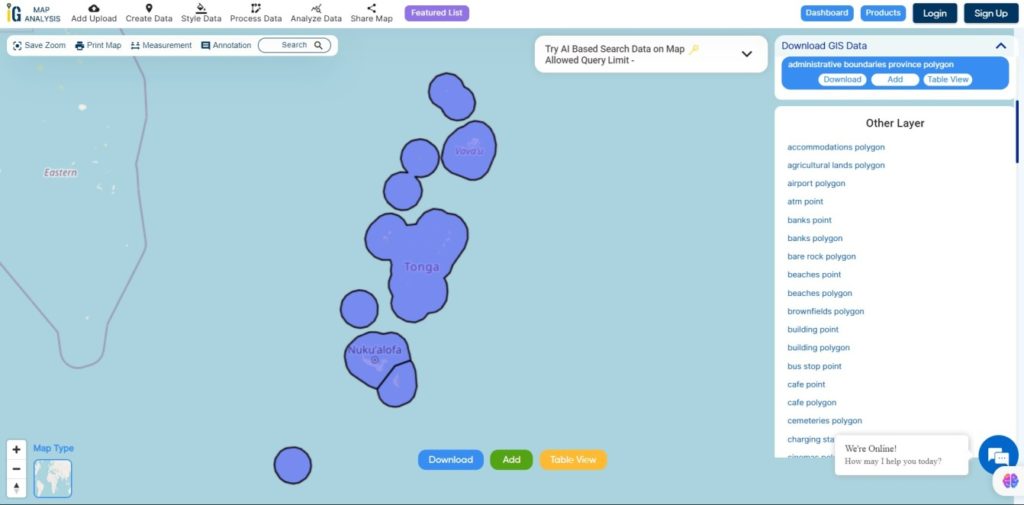
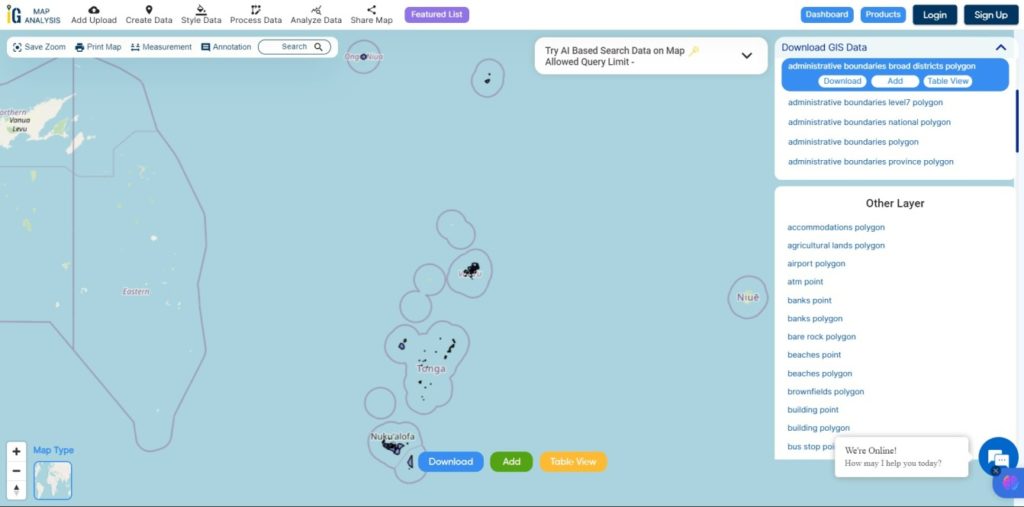
This article will walk you through downloading administrative-level GIS data for Tonga using the Download GIS Data tool. Experience a seamless geospatial journey with MAPOG as your trusted partner!
Note:
All data available are in GCS datum EPSG:4326 WGS84 CRS (Coordinate Reference System).
You need to login for downloading the shapefile.
Download Shapefile Data of Tonga
Tonga is an archipelago located in Oceania, situated in the South Pacific Ocean. These islands are categorized into three main groups: Vava’u, Ha’apai, and Tongatapu. They span an 800-kilometre (500-mile)-long north-south line.
Tonga experiences a tropical rainforest climate (Af). It has a distinct warm period from December to April, during which temperatures exceed 32°C (89.6°F). The cooler period lasts from May to November, with temperatures rarely surpassing 27°C (80.6°F). The temperature and rainfall vary across the islands, ranging from 23°C (73.4°F) and 1,700 mm (66.9 in) on Tongatapu in the south to 27°C (80.6°F) and 2,970 mm (116.9 in) on the more northerly islands closer to the Equator.
Disclaimer : If you find any shapefile data of country provided is incorrect do contact us or comment below, so that we will correct the same in our system as well we will try to correct the same in OpenStreetMap.
It’s fantastic to hear that MAPOG has expanded its GIS data collection to include data for more than 100 new countries, bringing the total coverage to over 150 countries. This is undoubtedly a valuable resource for GIS enthusiasts and professionals around the world. The availability of detailed information on administrative divisions, rivers, roads, and airports can greatly enhance various geospatial projects and analyses.
The option to access the data through tools like “Download GIS Data” and “Add GIS Data” seems convenient and user-friendly. Providing data in different formats such as Shapefile, KML, GeoJSON, and CSV ensures compatibility with a wide range of GIS software and applications, making it easier for users to integrate the data into their workflows.
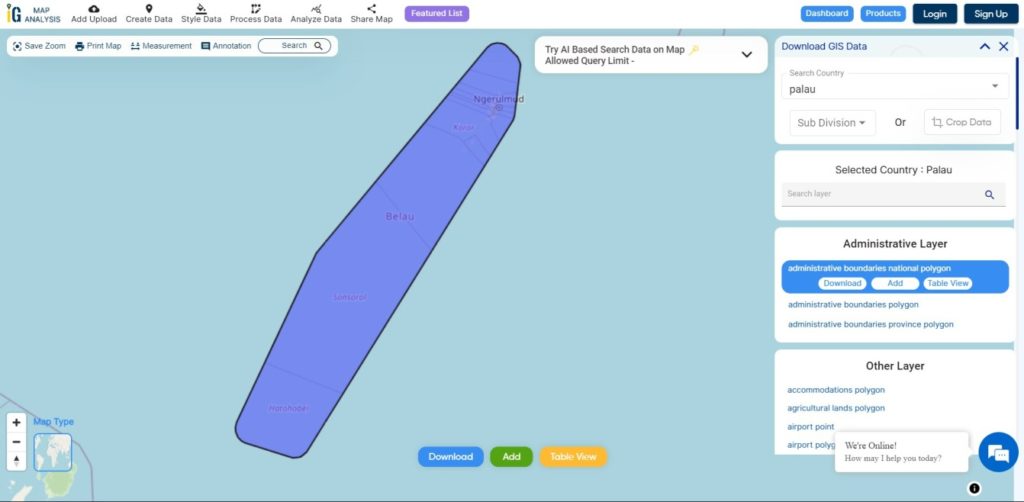
This article will walk you through downloading administrative-level GIS data for Palau using the Download GIS Data tool. Experience a seamless geospatial journey with MAPOG as your trusted partner!
Note:
All data available are in GCS datum EPSG:4326 WGS84 CRS (Coordinate Reference System).
You need to login for downloading the shapefile.
Download Shapefile Data of Palau
Palau’s territory is made up of an archipelago in the Pacific Ocean. The most populous islands are Angaur, Babeldaob, Koror, and Peleliu. The latter three are located within the same barrier reef, while Angaur is an oceanic island several kilometers to the south. Approximately two-thirds of the population resides on Koror.
The coral atoll of Kayangel is north of these islands, and the uninhabited Rock Islands (about 200) are to the west of the main island group. A remote group of six islands, known as the Southwest Islands, located some 604 kilometers (375 miles) from the main islands, make up the states of Hatohobei and Sonsorol.
Disclaimer : If you find any shapefile data of country provided is incorrect do contact us or comment below, so that we will correct the same in our system as well we will try to correct the same in OpenStreetMap
It’s fantastic to hear that MAPOG has expanded its GIS data collection to include data for more than 100 new countries, bringing the total coverage to over 150 countries. This is undoubtedly a valuable resource for GIS enthusiasts and professionals around the world. The availability of detailed information on administrative divisions, rivers, roads, and airports can greatly enhance various geospatial projects and analyses.
The option to access the data through tools like “Download GIS Data” and “Add GIS Data” seems convenient and user-friendly. Providing data in different formats such as Shapefile, KML, GeoJSON, and CSV ensures compatibility with a wide range of GIS software and applications, making it easier for users to integrate the data into their workflows.
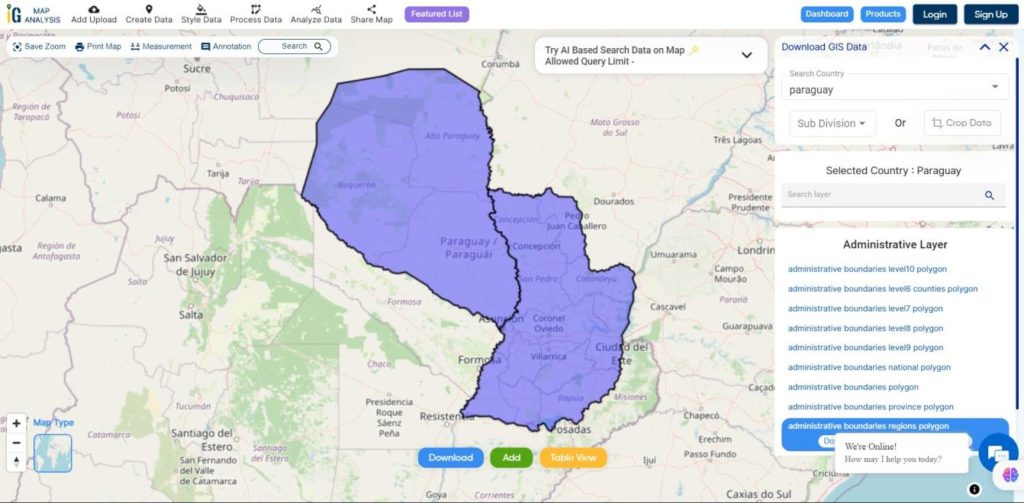
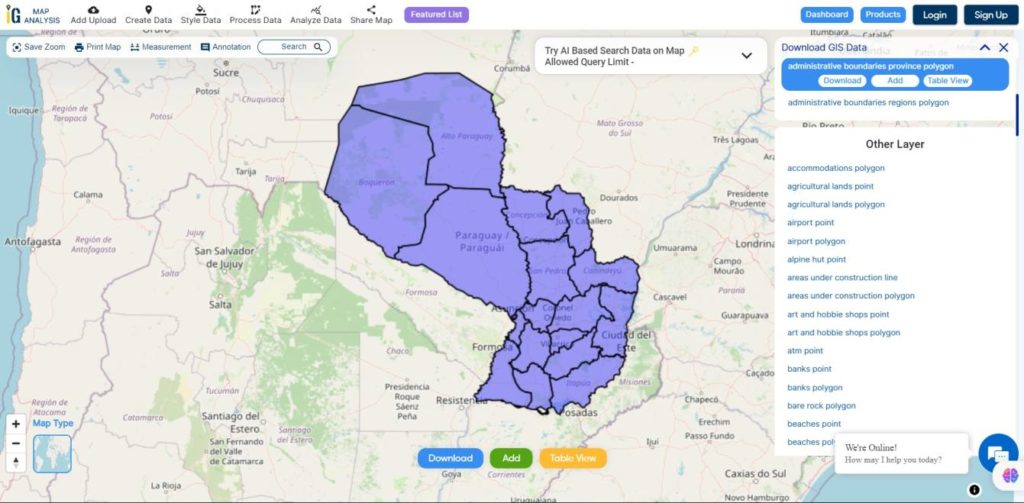
This article will walk you through downloading administrative-level GIS data for Paraguay using the Download GIS Data tool. Experience a seamless geospatial journey with MAPOG as your trusted partner!
Note:
All data available are in GCS datum EPSG:4326 WGS84 CRS (Coordinate Reference System).
Disclaimer : If you find any shapefile data of country provided is incorrect do contact us or comment below, so that we will correct the same in our system as well we will try to correct the same in OpenStreetMap
Have you been hunting GIS data too long and couldn’t find the right data or a proper data collection hub for fulfilling your requirements? Worry no more, IGISMAP GIS solutions offer a comprehensive collection of GIS data for over 150 countries, providing access to more than 150 datasets per country. Each dataset is carefully curated and accurately represents the administrative divisions of the respective countries. IGISMAP provides two essential tools for accessing this data: the Download GIS Data and Add GIS Data functionalities. Users can download the data in multiple formats, including ESRI Shapefile, KML, GeoJSON, or CSV, depending on their preferences and requirements. The platform ensures that users have a seamless experience in accessing valuable GIS data for their projects. Check the article – Add GIS data from IGISMap GIS data collection to understand more about Add GIS Data.
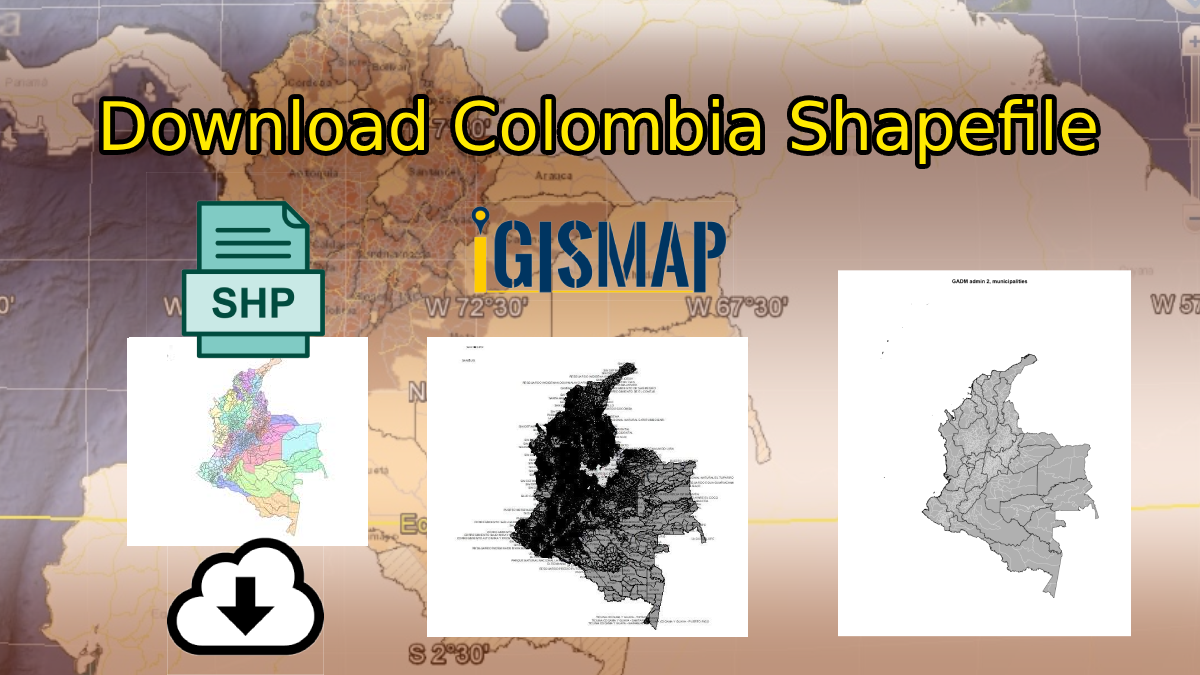
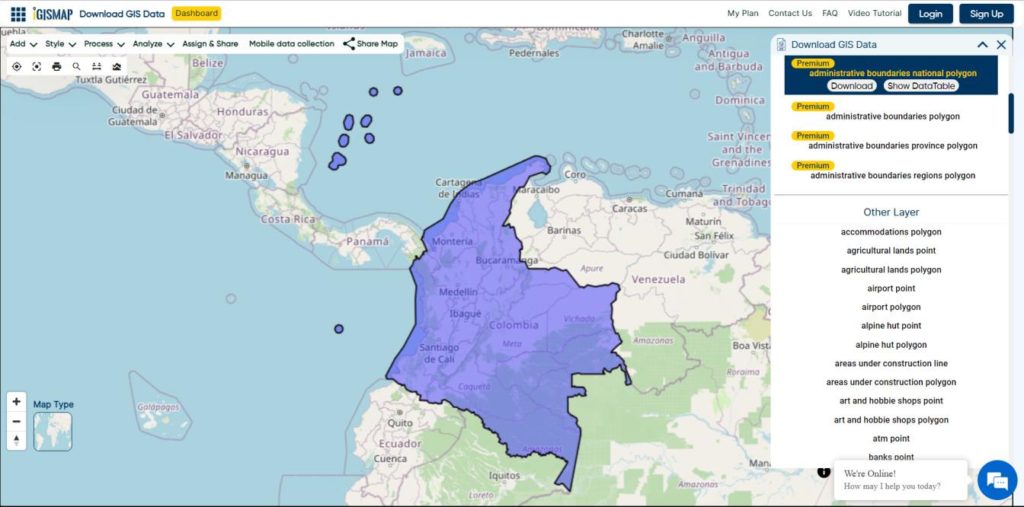
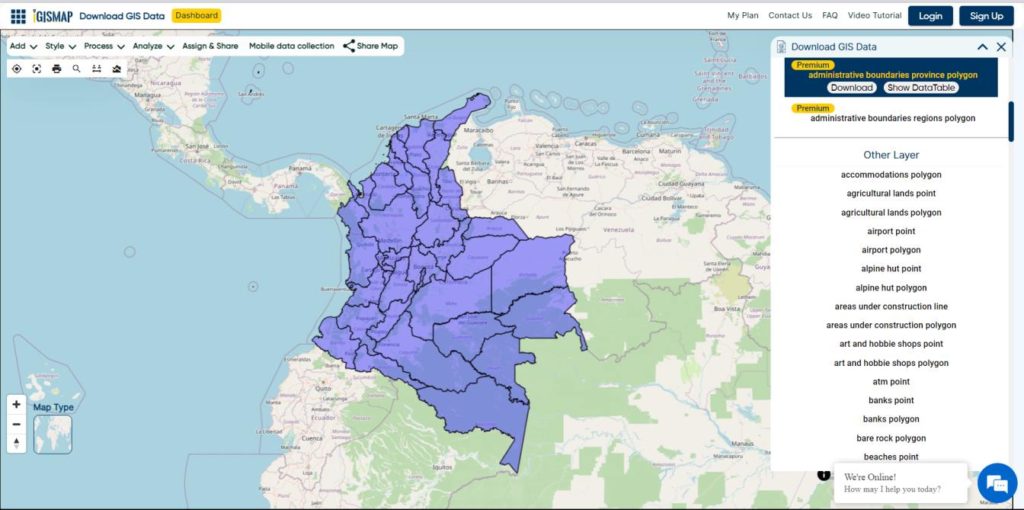
In this article, we will talk about administrative level GIS data of Colombia and how it can be accessed from Download GIS Data tool. GIS data of almost all natural and man made geographic features are available in IGISMAP for Colombia. This article will give you an overview of all the administrative divisions GIS data available for Colombia.
Note:
All data available are in GCS datum EPSG:4326 WGS84 CRS (Coordinate Reference System).
You need to login for downloading the shapefile.
Download Free Shapefile Data of Colombia
The geography of Colombia is characterized by its six main natural regions that present their own unique characteristics, from the Andes mountain range region shared with Ecuador and Venezuela; the Pacific Coastal region shared with Panama and Ecuador; the Caribbean coastal region shared with Venezuela and Panama; the Llanos (plains) shared with Venezuela; the Amazon rainforest region shared with Venezuela, Brazil, Peru and Ecuador; to the insular area, comprising islands in both the Atlantic and Pacific oceans. It share its maritime limits with Costa Rica, Nicaragua, Honduras, Jamaica, Haiti, and the Dominican Republic.
Disclaimer : If you find any shapefile data of country provided is in correct do contact us or comment below, so that we will correct the same in our system as well we will try to correct the same in OpenStreetMap.
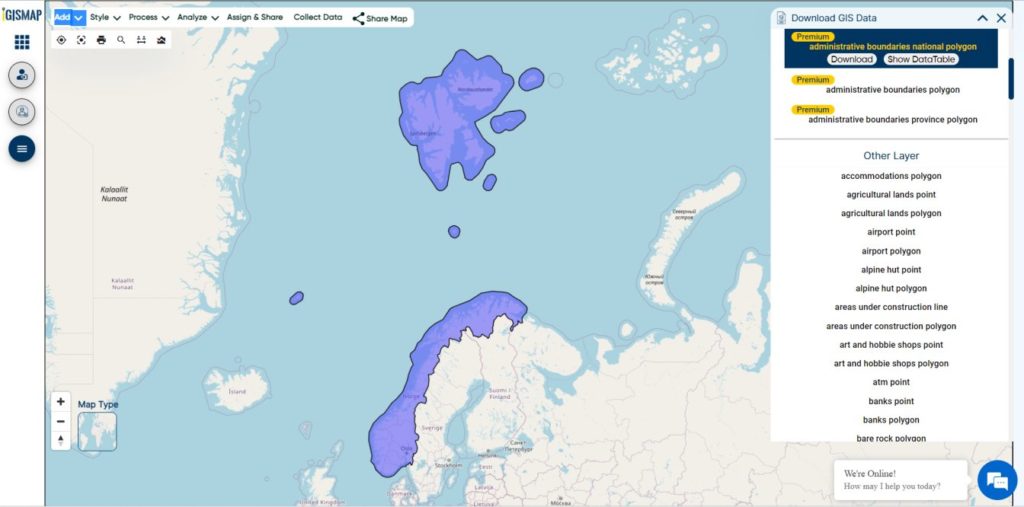
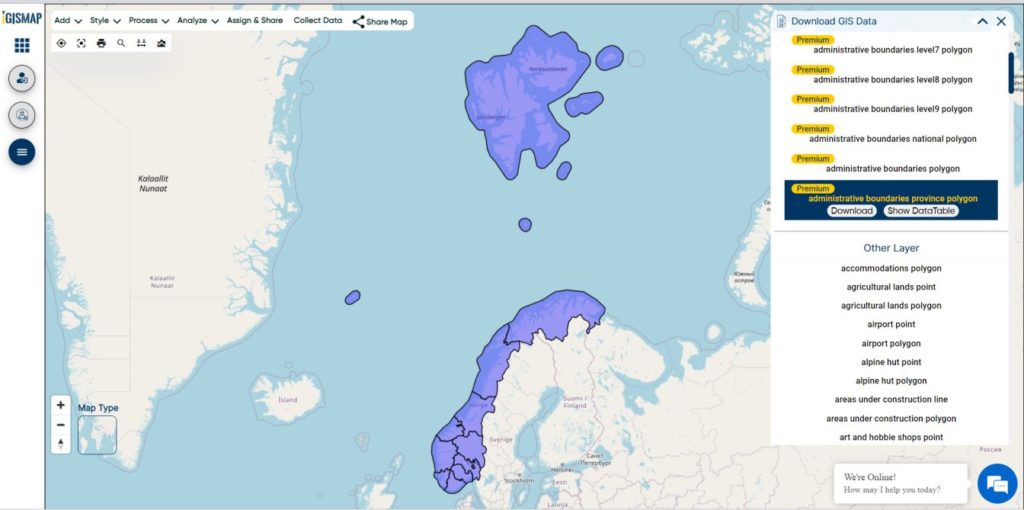
Hey! GIS user here in this blog you can download Norway shapefile GIS data. IGISMAP have collection for more than 100 new countries. Links for downloading the shapefiles of the important administrative divisions of Norway are provided in the following. You can also download these data in any format like KML, GeoJSON, or CSV etc.
Note:
All data available are in GCS datum EPSG:4326 WGS84 CRS (Coordinate Reference System).
You need to login for downloading the shapefile.
Here is the video tutorial to download data:
Download Free Shapefile Data of Norway
Norway is a country located in Northern Europe in the northern and western parts of the Scandinavian Peninsula. It has a land border with Sweden to the east and a shorter border with Finland and an even shorter border with Russia to the northeast. The country’s average elevation is 460 meter’s (1,510 ft), and 32 percent of the mainland is located above the tree line. The regional climate was up to 1–3 °C (1.8–5.4 °F) warmer in 7000 BC to 3000 BC in the Holocene Climatic Optimum, (relative to the 1961-90 period), melting the remaining glaciers in the mountains almost completely during that period.
Norway is divided into 11 administrative regions, called counties . The island territories of Svalbard and Jan Mayen are outside the county division and ruled directly at the national level. The capital Oslo is both a county and a municipality.
This shapefile covers following Counties of Norway listed below:
Agder
Innlandet
More og Romsdal
Nordland
Oslo
Rogaland
Vestfold og Telemark
Troms og Finnmark
Trondelag
Vestland
Viken
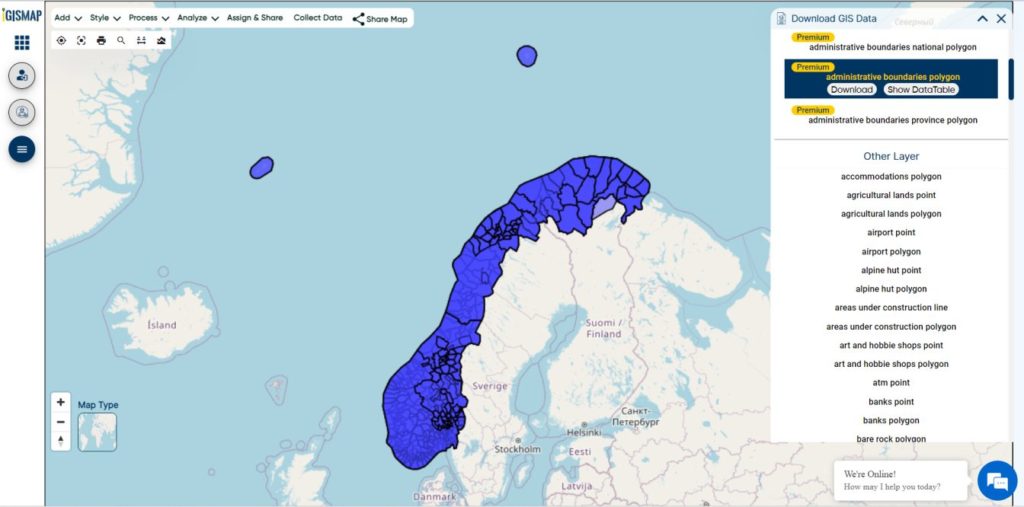
Download Norway Municipalities Shapefile Data
Municipalities are the atomic unit of local government in Norway and are responsible for primary education (until 10th grade), outpatient health services, senior citizen services, unemployment and other social services, zoning, economic development, and municipal roads. Law enforcement and church services are provided at a national level in Norway.
Disclaimer : If you find any shapefile data of country provided is incorrect do contact us or comment below, so that we will correct the same in our system as well we will try to correct the same in OpenStreetMap.
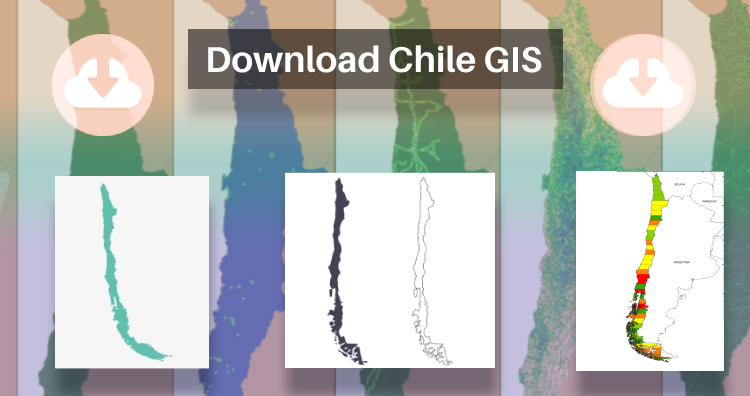
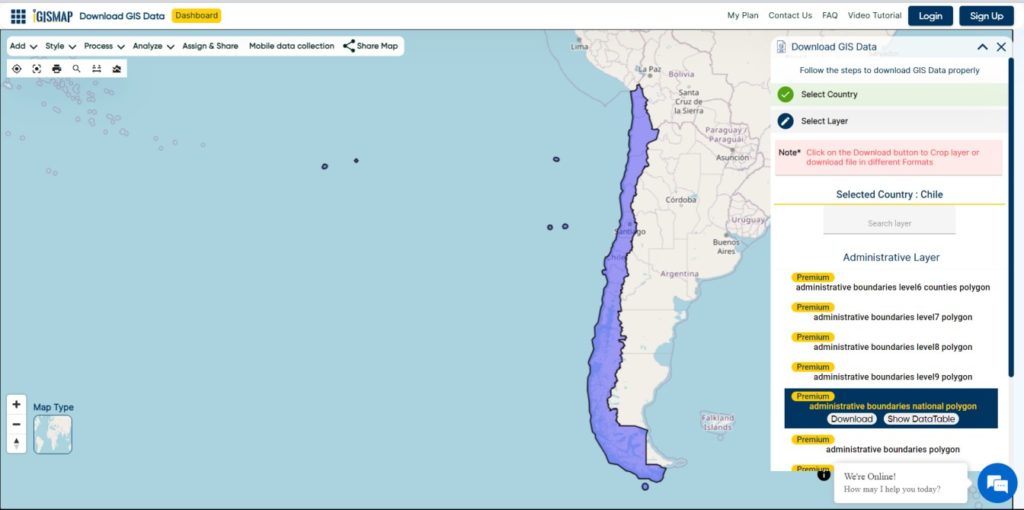
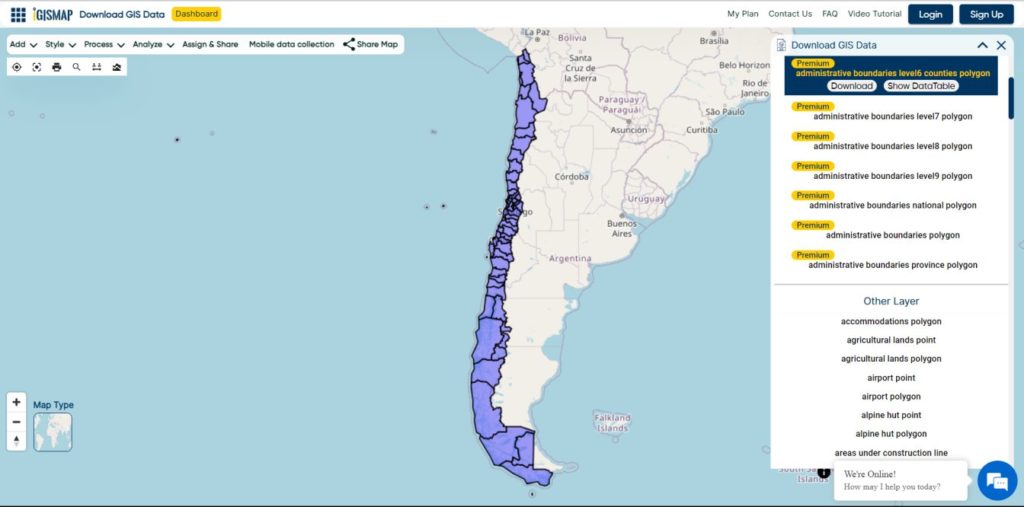
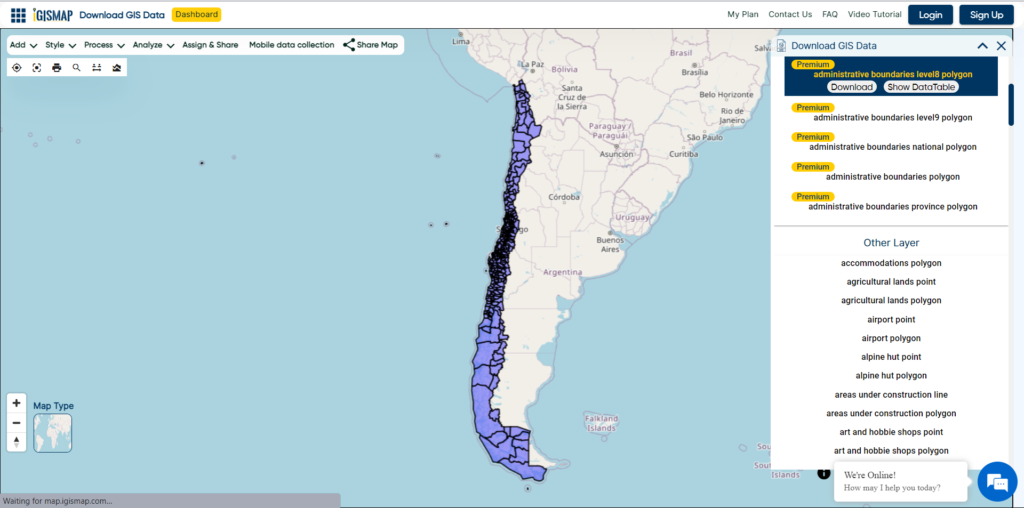
That’s fantastic news! GIS enthusiasts will definitely appreciate the availability of GIS data for over 100 new countries. If you’re interested in obtaining shapefiles of the important administrative divisions of Chile, you can find the download links for various formats such as KML, GeoJSON, and CSV on the IGISMAP website. These files will allow you to explore and analyze the geographical and administrative aspects of Chile in your GIS applications. Enjoy exploring the data!
Note:
All data available are in GCS datum EPSG:4326 WGS84 CRS (Coordinate Reference System).
Chile is a long, narrow country stretching along South America’s western edge, with more than 6,000km of Pacific Ocean coastline. Santiago, its capital, sits in a valley surrounded by the Andes and Chilean Coast Range mountains. The city’s palm-lined Plaza de Armas contains the neoclassical cathedral and the National History Museum. The massive Parque Metropolitano offers swimming pools, a botanical garden and zoo.
Once you click on the link, you will be redirected to the gis data of Chile, select the format and tap on download button.
Download Chile Province Shapefile Data
A province is the second-largest administrative division in Chile with 56 in total. The largest administrative division in Chile is that of a region with 16 in total.
A commune is the smallest administrative subdivision in Chile. It may contain cities, towns, villages, hamlets as well as rural areas. In highly populated areas, such as Santiago, Valparaíso and Concepción, a conurbation may be broken into several communes. In sparsely populated areas, conversely, a commune may cover a substantial rural area together with several settled areas which could range from hamlets to towns or cities.
Disclaimer : If you find any shapefile data of country provided is incorrect do contact us or comment below, so that we will correct the same in our system as well we will try to correct the same in OpenStreetMap.
Publish Style Raster Dataset On GeoServer. Do you have raster data and want to host the data on geoserver and create a proper map with styling according to dataset? Well GeoServer gives you a direct and simple method to create a styled map. Before implementing steps to publish and sytle raster dataset on geoserver you need to install first GeoServer on Windows, mac or Ubuntu Pc or Server. If you are looking for publish and style vector dataset on geoserver, you can check this link.
Raster Dataset GeoServer coverage:
Coverage/raster data that geoserver can access are,
1. GeoTIFF (Tagged Image File Format with Geographic information)
2. GTOPO30
3. WorldImage
4. ImageMosaic
5. GeoPackage
In this article we will discuss how we can publish GeoTIFF (.tiff/.tfw format) data on server. The data for this article has been downloaded from the links provided in this article. The raster data contains 3 bands (red, blue, green) information. Here we will use GeoTiff data to demonstrating raster dataset to publish and style in GeoServer.
To publish Raster Dataset data – Steps – Publish Style Raster Dataset
Here we will first publish the geotiff raster dataset in geoserver as an example:
Step 1:
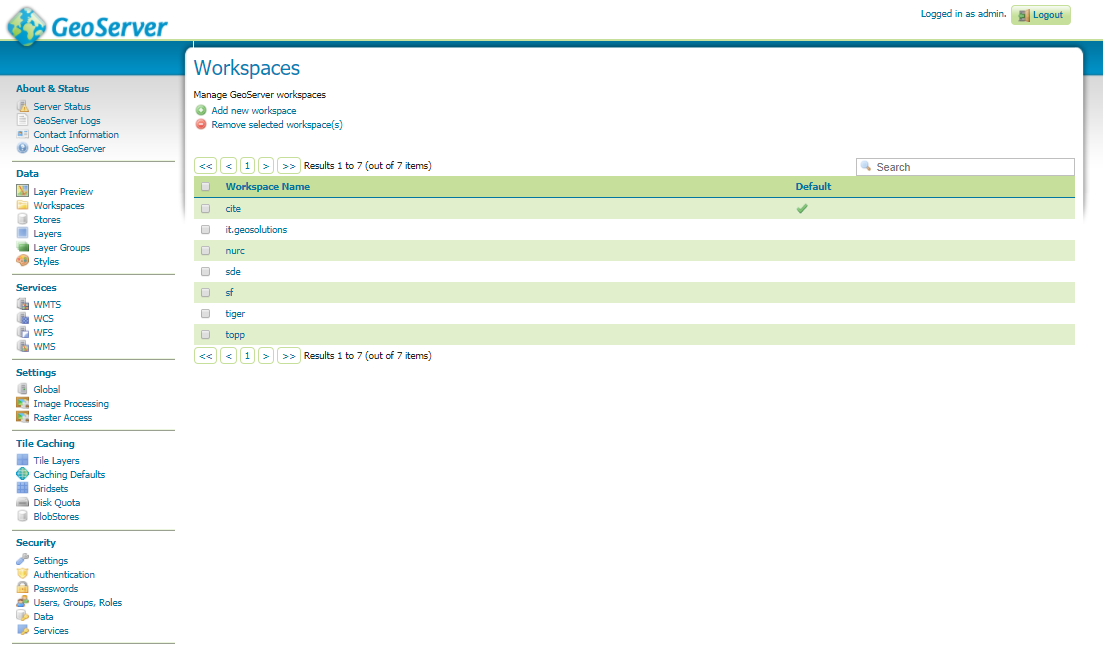
First of all you need to login to GeoServer then create a workspace, which can be done by selecting workspace option on the right side of screen under data section. Add the new workspace give a name and URI. In information technology, a Uniform Resource Identifier (URI) is a string of characters used to identify a resource, which can be same as name and submit the information.
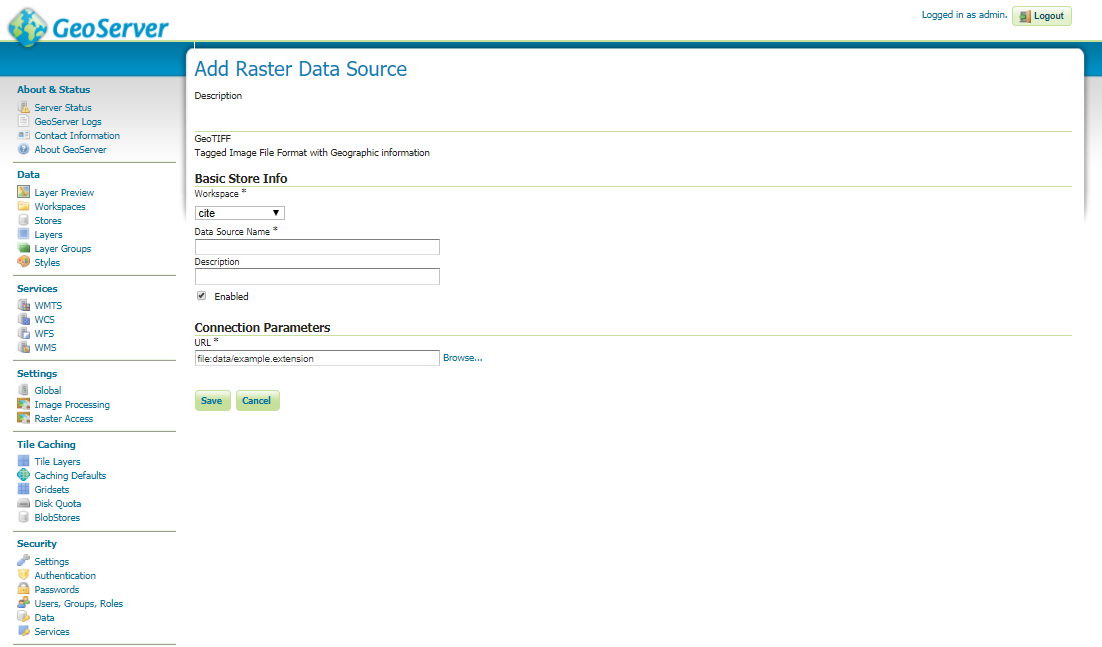
Step 2 of Publish Raster Dataset on GeoServer:
Now add the store by selecting stores option under same section. Click Add new store and select GeoTIFF option in Raster Data Sources list.
Publish and Style Raster Dataset On GeoServer
Under this option add the workspace, you created and give data source name. Provide the description about your data. Now browse the GeoTIFF file to add and publish this data.
Step 3:
Check the Coordinate Reference Systems and the Bounding Boxes fields are properly set and click on Save.
Step 4 of publish raster dataset on geoserver:
Now you can see the layer and get the WMS link. For this go to Layer Preview option in data section and open the published data as OpenLayer option.
To Style Raster Dataset on GeoServer Steps – Publish Style Raster Dataset
To add built in style to your GeoTIFF file follow the given steps.
Step 1:
First of all make sure your file has been added on server. Then open that layer using layer option in data section.
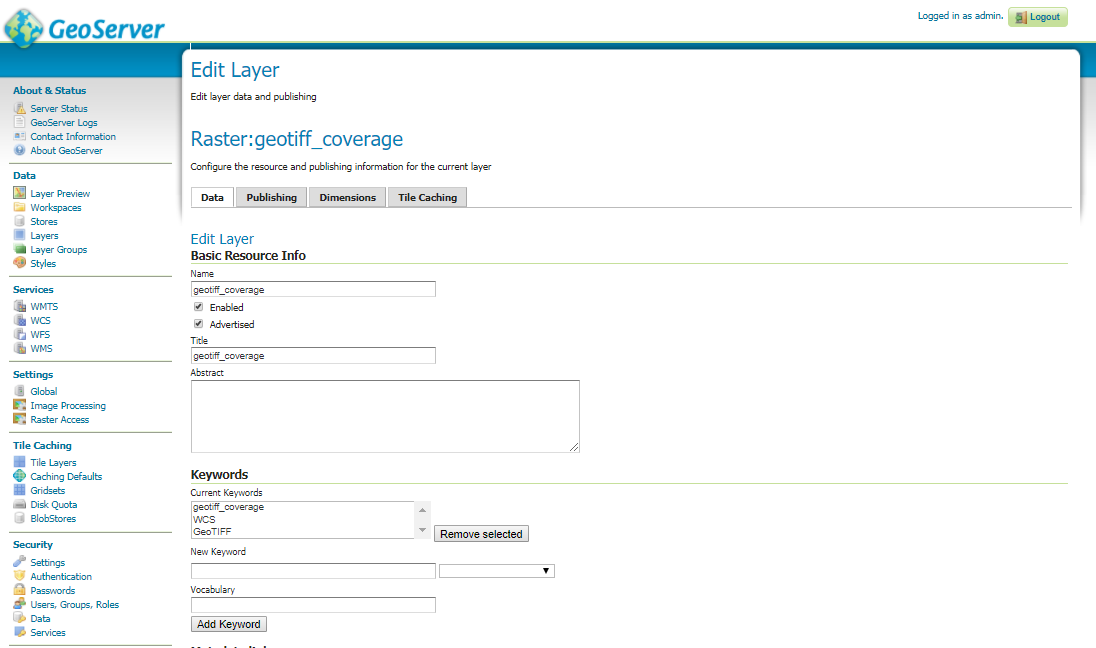
Step 2 to style raster dataset in geoserver:
There will be 4 tabs as data, publishing, dimensions and tile caching. As on adding layer you already have visited data tab and set SRS coordinates. Now click publishing tab.
Publish and Style Raster Dataset On GeoServer
In publishing tab find the WMS setting option, under that option check the Queryable check box and select style in default style drop down.
There are styles for point, line, polygon and raster in Geoserver:
1. Burg: point
2. Dem: raster
3. Capitals: points
4. Roads: line
5. Lakes: polygon
6. Raster: raster
7. Point: point
8. Line: line
9. Polygon: polygon
10. Rain: raster
11. Population: raster
According to your shape file you can add the style and click to save.
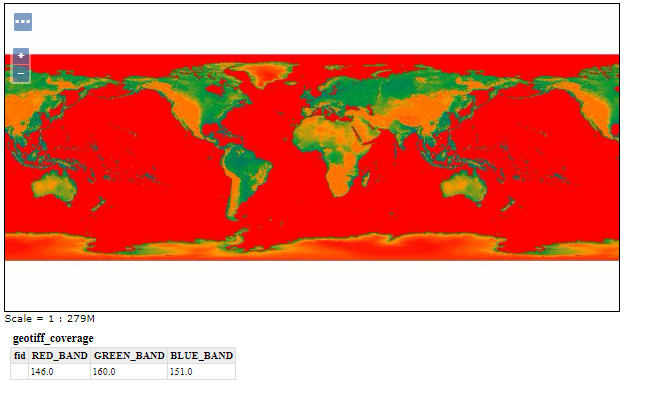
Step 3:
Now to check the styling, add Raster option as style and click the layer preview option under same data section. Open as openLayer.
You can add your own SLD (Styled Layer Descriptor) profile to style the GeoTiff data. For this you can follow this article and for more information you can visit http://docs.geoserver.org/latest/en/user/styling/sld/reference/rastersymbolizer.html link.
The Styled Layer Descriptor (SLD) supported in geoserver raster dataset:
Profile of the Web Map Service (WMS) Encoding Standard defines an encoding that extends the WMS standard to allow user-defined symbolisation and colouring of geographic feature (vector data) and coverage data (raster data).
SLD has some elements as:
<StyledLayerDescriptor> Which is the root element for an SLD. It contains a Layers and Styles elements which describe how a map is to be composed and styled. <NamedLayer>: A reference to a named layer in the server catalogue
<UserLayer>: A layer defined in the style itself
<FeatureTypeStyle>: The FeatureTypeStyle element specifies the styling that is applied to a single feature type of a layer. It contains a list of rules which determine the symbology to be applied to each feature of a layer.
<Rule>: Styling rules define the portrayal of features. A rule combines a filter with any number of symbolizers. Features for which the filter condition evaluates as true are rendered using the symbolizers in the rule.
<RasterSymbolizer>: styles raster coverages.
The <Opacity> element sets the transparency level for the entire rendered image. As is standard, the values range from zero (0) to one (1), with zero being transparent, and one being opaque.
The <ChannelSelection> element specifies how dataset bands are mapped to image colour channels. Named dataset bands may be mapped to red, green and blue channels, or a single named band may be mapped to a grayscale channel.
Here we can select any of the band or all three band. But particularly in this article we have selected a single band of an RGB image as a grayscale channel and re-colorizing it via a ColorMap.
A color map is defined by a sequence of <ColorMapEntry> elements. Each <ColorMapEntry> element specifies a color and a quantity attribute. The quantity refers to the value of a raster pixel. The color value is denoted in standard hexadecimal RGB format (#RRGGBB). <ColorMapEntry> elements can also have opacity and label attributes. As in the code quantity is given as 0, 150, 200 and 255. Then the pixels having other values get interpolated range of color.
In the last close all the elements and save the style.
After that open the layer option and select the geotiff file. Add the style in publishing tab and save the layer. To view this style over layer, open layer preview option and open this layer as Openlayer option.
Full length code Publish Style Raster Dataset On GeoServer
Hope this article to Publish Style Raster Dataset On GeoServer is helpful for you and you might be easily able to create a beautiful colour map with the help of geoserver. If you find any problem in following the steps to style and publish the raster layer of geoserver do comment below with the problem in the box provided below.
Loading Comments...
We use cookies to ensure that we give you the best experience on our website. If you continue to use this site we will assume that you are happy with it.