Leaflet.js – Point, Polyline, Polygon, Rectangle, Circle – Basic Shapes

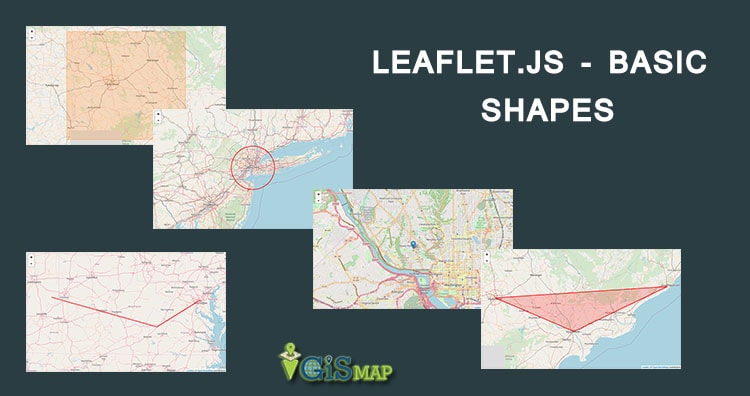
In this tutorial we are focusing on the Leafletjs basic shapes used for mapping. Leaflet.js can add various shapes such as circles, polygons, rectangles, polylines, points or markers etc. here, we will discuss how to use the shapes provided by Google Maps. If you are not familiar with Leaflet.js, you can visit our another blog Leaflet js – Getting Started – create Map Application. Also if you already have geojson files, you can load the geojson files with leafletjs as a map.

Marker or Point

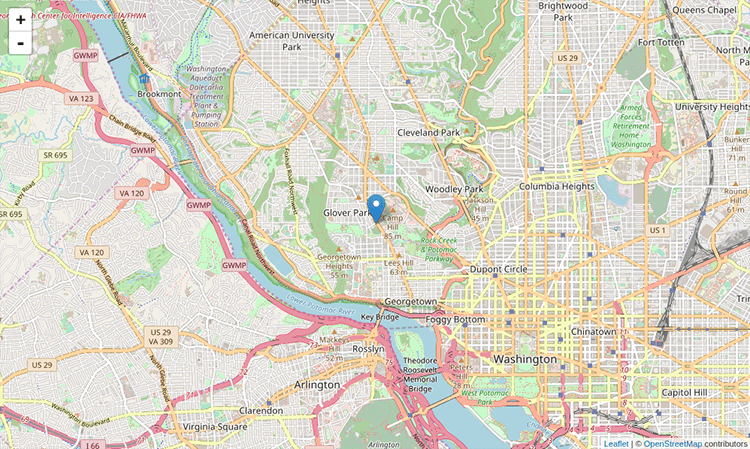
To draw point overlay on a map using leaflet javascript library, follow the steps below-

      • Create a Map object by passing a <div> element (String or object) and map options (optional).
      • Create a Layer object by passing the URL of the desired tile.
      • Add the layer object to the map using the addLayer() method of the Map class.
      • Create a latlangs variable for the point to draw point or marker, as shown below.
Var point = [38.9188702,-77.0708398];
      • Create a point or marker using the L.marker(). To draw the marker, pass the location as variable.

        L.marker([38.9188702,-77.0708398]).addTo(newMap);
        

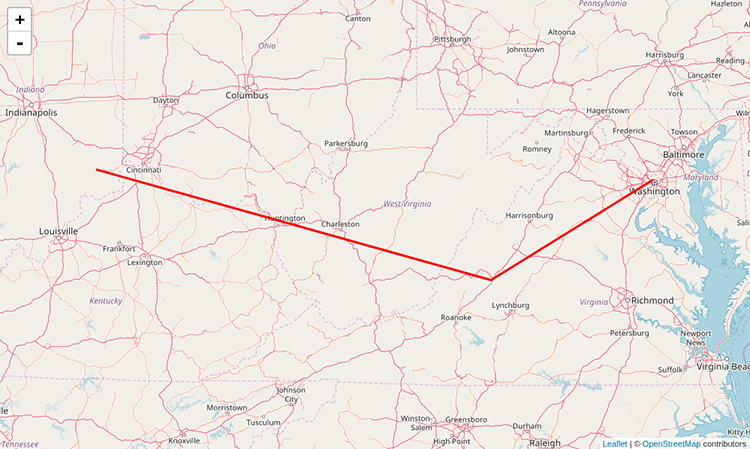
        Polyline

To draw polyline overlay on a map using Leaflet JavaScript library, follow the steps given below −

      • Create a Map object by passing a <div> element (String or object) and map options (optional).
      • Create a Layer object by passing the URL of the desired tile.
      • Add the layer object to the map using the addLayer() method of the Map class.
      • Create a latlangs variable to hold the points to draw polyline, as shown below.

        var latlngs = [ [38.91,-77.07], [37.77, -79.43], [39.04, -85.2]];
      • Create a polyline using the L.polyline(). To draw the polyline, pass the locations as variable and an option to specify the color of the lines.

        var polyline = L.polyline(latlngs, {color: 'red'});
      • Add the polyline to the map using the addTo() method of the Polyline class.

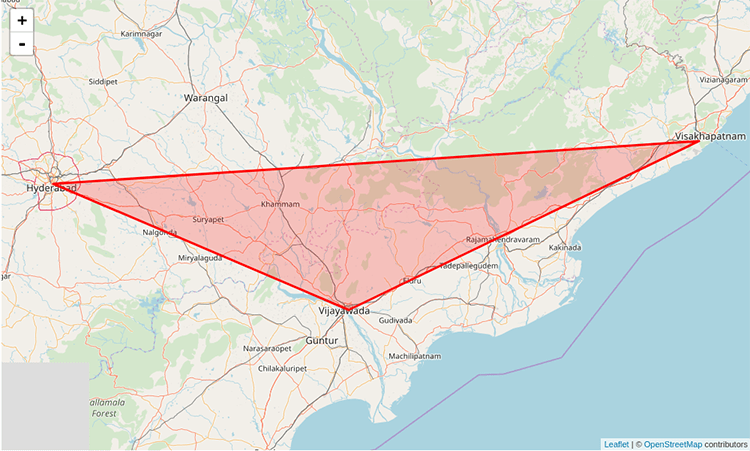
        Polygon

To draw a polygon overlay on a map using Leaflet JavaScript library, follow the steps given below −

      • Create a Map object by passing a <div> element (String or object) and map options (optional).
      • Create a Layer object by passing the URL of the desired tile.
        Add the layer object to the map using the addLayer() method of the Map class.
      • Create a latlangs variable to hold the points to draw the polygon.

        var latlngs = [
           [17.385044, 78.486671],
           [16.506174, 80.648015],
           [17.686816, 83.218482]
        ];
      • Create a polygon using the L.polygon(). Pass the locations/points as variable to draw the polygon, and an option to specify the color of the polygon.

        var polygon = L.polygon(latlngs, {color: 'red'});
      • Add the polygon to the map using the addTo() method of the Polygon class.

shape-polygon

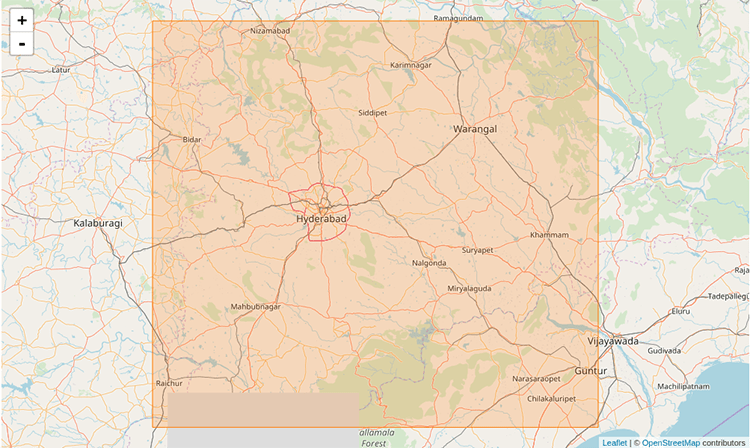
Rectangle

To draw a Rectangle overlay on a map using Leaflet JavaScript library, follow the steps given below –

      • Create a Map object by passing a <div> element (String or object) and map options (optional).
      • Create a Layer object by passing the URL of the desired tile.
        Add the layer object to the map using the addLayer() method of the Map class.
      • Create a latlangs variable to hold the points to draw a rectangle on the map.

        var latlngs = [[18.739046, 80.505755], [15.892787, 77.236081]];
      • Create a rectangle using the L.rectangle() function. Pass the locations/points as a variable to draw a rectangle and rectangle Options to specify the color and weight of the rectangle.
var rectOptions = {color: 'Red', weight: 1}
var rectangle = L.rectangle(latlngs, rectOptions);
      • Add the rectangle to the map using the addTo() method of the rectangle class.

        rectangle.addTo(map);

shape-rect

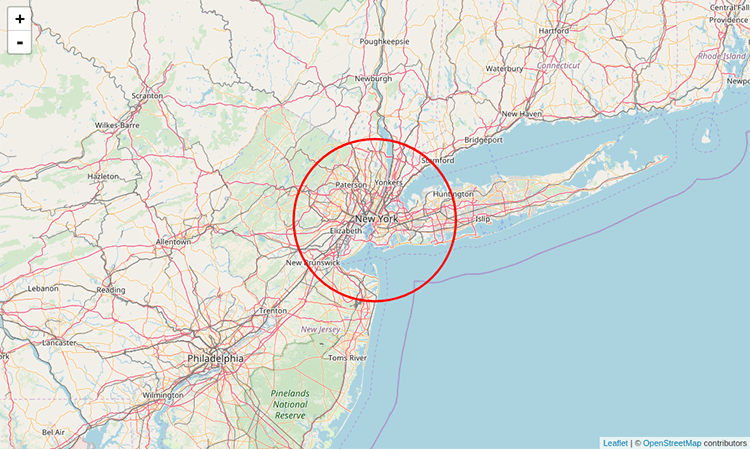
Circle

To draw a circle overlay on a map using Leaflet JavaScript library follow the steps given below.

      • Create a Map object by passing a <div> element (String or object) and map options (optional).
      • Create a Layer object by passing the URL of the desired tile.
        Add the layer object to the map using the addLayer() method of the Map class.
      • Create a latlangs variable to hold the center of the circle as shown below.

        var circleCenter = [40.72, -74.00];
      • Create a variable circleOptions to specify values to the options color, fillColor and, fillOpacity as shown below.

        var circleOptions = {
           color: 'red',
           fillColor: '#f03',
           fillOpacity: 0
        }
      • Create a circle using L.circle(). Pass the center of the circle, radius, and the circle options to this function.

        var circle = L.circle(circleCenter, 50000, circleOptions);
        
        
      • Add the above-created circle to the map using the addTo() method of the Polyline class.

        circle.addTo(map);

shape-circle

This article contains the basic shapes created and used in the leaflet js scripting library. If you have any questions related to leaflet.js, please let us know in the comment section.

Add or Load GeoJSON file – Point, Polyline or Polygon map – Leaflet js

Are you looking to create a map interactive application to locate markers with points, or to highlight an area by polygon or to draw or show a river or roads line with polyline? With Leafletjs library and GeoJSON as GIS data, we can easily create a map which we are looking for and render the output in browser. Leaflet js is an opensource small library to create interactive map. GeoJSON is one of the GIS data structure which stores geographic data in JSON format. GeoJSON supports point, line, polygon, multipolyline, multipolygon and Geometry collection which can represent a geometry, feature or a collection of features. A detailed structure of GeoJSON would be written in separate article.

Add or Load GeoJSON file

This Article would let you know how to render and load geoJSON file with the help of leaflet js library. Also you would also get an idea by this article to implement a click event over a GeoJSON file and fetch information associated with the feature of GeoJOSN data loaded as map.

If you are not familiar with Leaflet, I would recommend you to read first the Getting Started tutorial with Leaflet js Library to create map application.

Lets setup a Base Map First i.e loading openstreetmap or osm in leaflet, in a html file:


<!DOCTYPE html>
<html>
<head>
<title>Getting Started - Leaflet js Map interactive library</title>
<meta charset="utf-8" />
<meta name="viewport" content="width=device-width, initial-scale=1.0">
<link rel="stylesheet" href="https://unpkg.com/leaflet@1.0.3/dist/leaflet.css" />
<script src="https://unpkg.com/leaflet@1.0.3/dist/leaflet.js"></script>
</head>
<body>
<div id="map" style="width: 1000px; height: 600px;"></div>
<script>
var newMap = L.map('map').setView([38.9188702,-77.0708398], 13);
L.tileLayer('http://{s}.tile.osm.org/{z}/{x}/{y}.png', {
attribution: '&copy; <a href=”http://osm.org/copyright”>OpenStreetMap</a> contributors'
}).addTo(newMap);
</script>
</body>
</html>

Above script would output and render an osm base map. Now lets start adding different features on map one by one with GeoJSON file.

Add or Load GeoJSON file – Load Polygon with leaflet on Map:

Add following script, and replace the ‘usa_adm.geojson’ to the file you are want to render.


// loading GeoJSON file - Here my html and usa_adm.geojson file resides in same folder
$.getJSON("usa_adm.geojson",function(data){
// L.geoJson function is used to parse geojson file and load on to map
L.geoJson(data).addTo(newMap);
});

After adding the polygon layer you may want to view or load the map area covered or extended by the polygon GeoJSON file. i.e On Map load you want to zoom and pan according to the extent or to fit layer bounds. For this, Leafletjs provided a function to calculate the bounding box of the geojson file or layer i.e layer.getBounds(). And also with leaflet map fitBounds function i.e map.fitBounds(“bounding coordinates”). Here is the line which you needs to add to script:


newMap.fitBounds(datalayer.getBounds());

Finally, we are left only adding a click event to get the features data. With the help of Leaflet L.geoJson optional object parameter with key “onEachFeature“, we can add and define click event on every feature of the layer.

Here we would be fetching the attribute data of the feature clicked on Polygon GeoJOSN file. So before writing any script, we need to list out the feature properties list. You can get those properties key name easily if you are familiar with JSON files and structure.

So lets define a function named as onEachFeature and replace the ‘key’ keyword with your actual feature properties key of GeoJSON file:


onEachFeature: function(feature, featureLayer) {
featureLayer.bindPopup(feature.properties.key);
}

So your final leaflet geojson code combines as i.e For adding polygon GeoJSON file on map, with click event and fit to extent functionality.


$.getJSON("usa_adm.geojson",function(data){
// add GeoJSON layer to the map once the file is loaded
var datalayer = L.geoJson(data ,{
onEachFeature: function(feature, featureLayer) {
featureLayer.bindPopup(feature.properties.NAME_1);
}
}).addTo(newMap);
newMap.fitBounds(datalayer.getBounds());
});

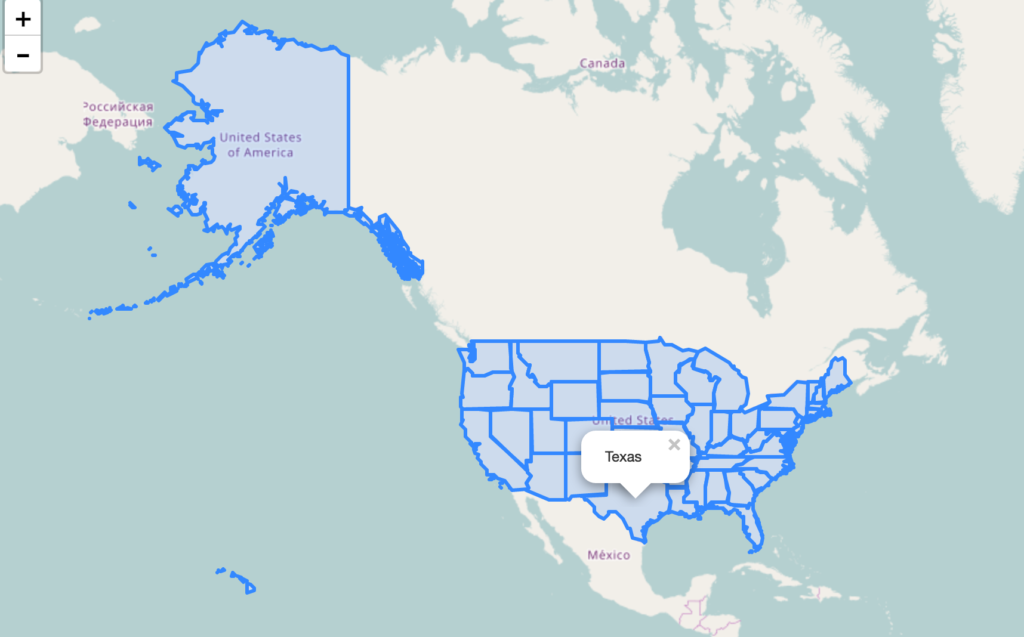
As I have loaded a US administrative polygon GeoJSON here, we can see following output as :

Add or Load GeoJSON file - polygon
Add or Load GeoJSON file – polygon

Add or Load GeoJSON file – polyline on Leaflet Map:

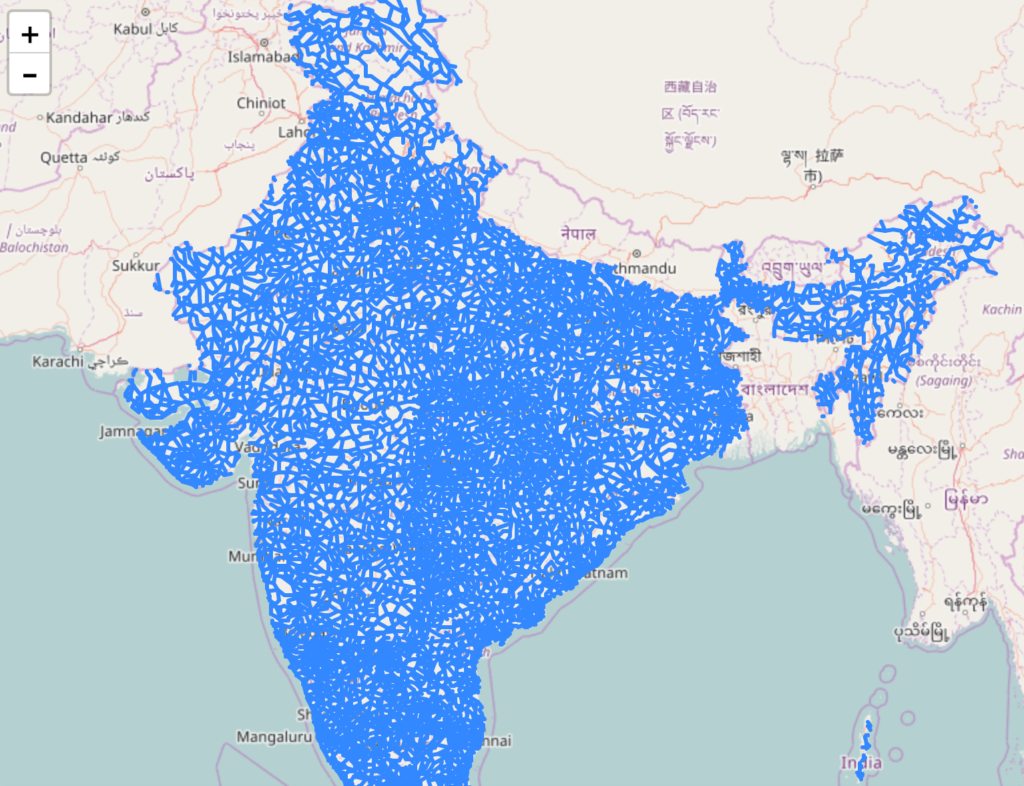
Adding polyline Geojson with leaflet library is same as adding polygon file. So the above code would work for loading polyline GeoJSON file. Just you need to replace the file name with your polyline GeoJSON file and features properties key have to replaced by the actual key name, of which you want to retrive information.

Add or Load GeoJSON file - polyline
Add or Load GeoJSON file – polyline

Add or Load GeoJSON file – point with Leaflet js on Map:

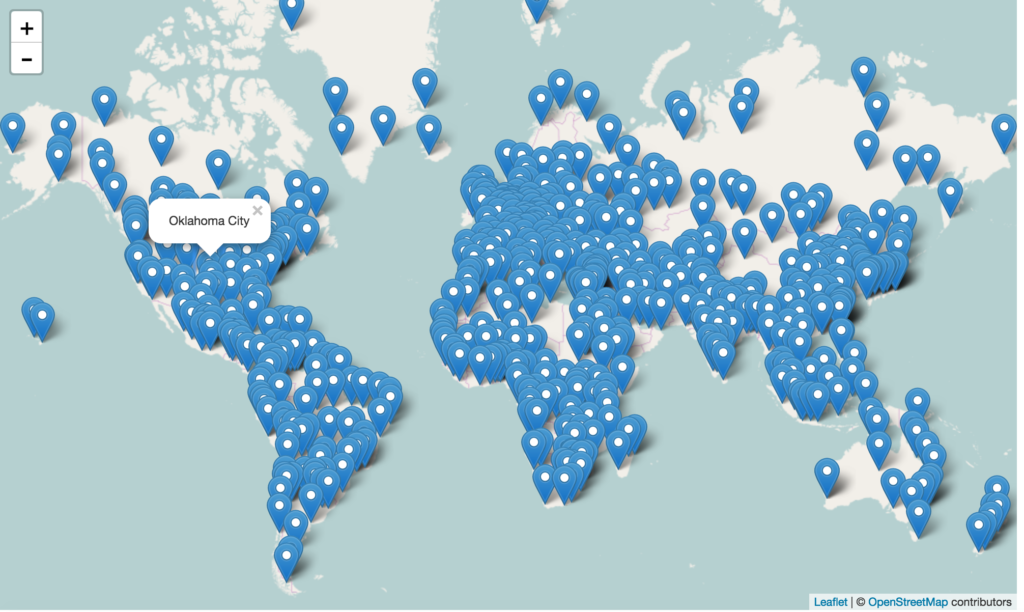
Adding Point GeoJSON file is same as loading Polygon GeoJSON file. Here is the output you can see for the famous world Cities.

Add or Load GeoJSON file - point
Add or Load GeoJSON file – point

If you find any difficulty in adding or loading GeoJSON file on map with leaflet library, do comment below with your queries.

How to remove gaps from a polygon layer file in ArcGIS?

How to remove gaps from a polygon layer file in ArcGIS? While preparing polygon layer file following various stages of layer preparation like

This is what making it suitable to be used by a web application as an input. While layer file should be accurate with minimum error before deploying or issuing the same to the client, which requires lots of time to make.  Obviously no client for project submission will tolerate the delay and so this task time is to be reduced. So this blog post will deal with, how reduce time duration of preparing a layer file?

If you are new to ArcGIS, I recommend you to Look for  FAQ  and Interview of ArcGIS Tutorial.

Remove gaps from a polygon layer file in ArcGIS:

This is quite possible by using ArcGIS inbuilt tools and this can be accomplished by understanding the need and using appropriate tool. A number of errors are generated at various stages of layer preparation like gap in a feature, overlap with other feature, self over and many more. These errors can be detected by selection tool or by running topology rules for every layer. But the question is removal of these errors. If there are just a hundred of polygons in layer one can remove it manually zooming on to every gap and overlap. But if there are a million or more number of polygons in a layer for example if a village has 1000 parcel on an average in a district of 600 villages, the total number of parcel in a district comes out to be 6 lakh. It takes almost equal time in preparing an error free file as much time used for preparing the layer file.

For this one task i.e. removal of gaps in a feature can be made easy and can be performed in less time by the use of a tool named Eliminate present in the Data Management toolset of ArcGIS.

Steps to remove gaps from a polygon layer file in ArcGIS

remove gaps from a polygon layer file in ArcGIS
Detection of Gaps in the polygon File


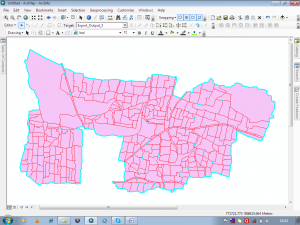
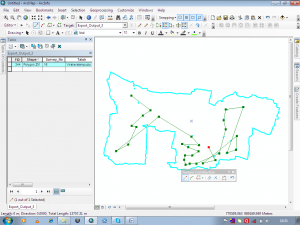
1.) First all gaps in a layer file should be converted to polygons using auto complete polygon tool from the editor bar.

remove gaps from a polygon layer file in ArcGIS: Forming polygons from gaps using Auto-complete tool
Forming polygons from gaps using Auto-complete tool

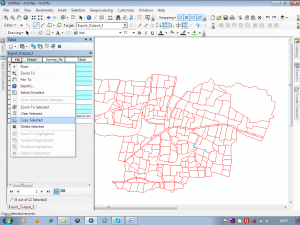
2.) Then these polygons should be copied to layer file.

remove gaps from a polygon layer file in ArcGIS: Copying gap polygon to main file.
Copying gap polygon to main file.

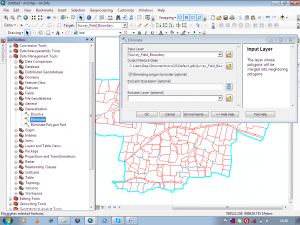
3.) Selecting all gaps in the form of polygon apply eliminate tool from data management toolset on the layer file.

remove gaps from a polygon layer file in ArcGIS: Applying Eliminate tool on the polygon file to remove gaps.
Applying Eliminate tool on the polygon file to remove gaps.

4.) The gaps are merged with the neighboring polygon having larger area or longer shared border.

In this way the work of one month can be reduced to one week or lesser. This tool should be used for removal of small gaps only. As for larger gaps the decision of merging the gap polygon in which neighboring polygon should be done by visual interpretation and analytically perspective.

If you are dealing with Raster files with ArcGIS and with multispectral band files, you may look for Pan-sharpening image using ArcGIS.

Hope this tutorial would help you to remove gaps from a layer file in ArcGIS.  While I always works in Open Source tool in GIS, I would like to make you check the QGIS and QGIS tutorials.

If you are facing any problem related to the above, then do comment below, we would look for the problem and suggestion for the same.