“ Wilderness without wildlife is just scenery”
-Lois Crisler
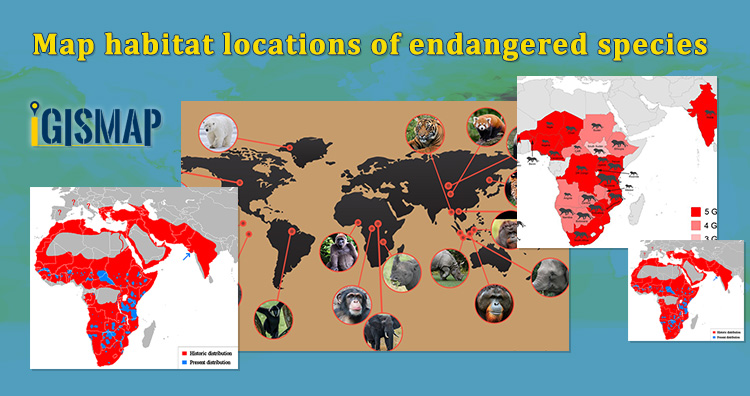
The International Union for Conservation of Nature (IUCN) states that endangered species are the species of plant or animal that are seriously at the risk of extinction. In this time of data revolution, data analytics plays a huge role in the field of environmental science and atmospheric studies. Keeping the record of the habitat locations of endangered species and observing the variations in their environmental factors will help the authorities to study the causes that threaten the life of these species. These observations can be further useful to prevent global extinction by rehabilitating their populations and restoring habitats. In the article we create point vector data in GIS tool.
GIS technology is an effective tool for managing, analyzing, and visualizing wildlife data to target areas where monitoring and managing is required. GIS technology helps in tracking the migration patterns, mapping biodiversity, and habitat suitability models which provide analysis for animals to locate their habitat locations in suitable environmental conditions.
Consider that a wildlife conservationist wants to map the habitat locations of endangered animals in India and keep track of the factors such as total strength, temperature, precipitation, food, water, etc. There are a lot of GIS applications available, but only MAPOG meets the requirements creating a map and hosting the map. Create Point Data tool of IGISMap can be used to plot locations and point objects as a point vector data model.
Map habitat locations of endangered species
Users can rely on the Create Point Data tool of IGISMap application to plot the habitat locations of endangered animals as given below.
GIS data created in IGISMap can be shared via links or embed in websites. More information based on these locations can be added as attributes in the datatable. Attribute information in the datatable can be queried using the Proximity Analysis tool of IGISMap. Let’s look into the steps on how the habitat location map can be created and further used for the protection of endangered animals.
To navigate to the IGISMap Create Point Data tool, click the below link
Adding the points of habitat locations of endangered animals
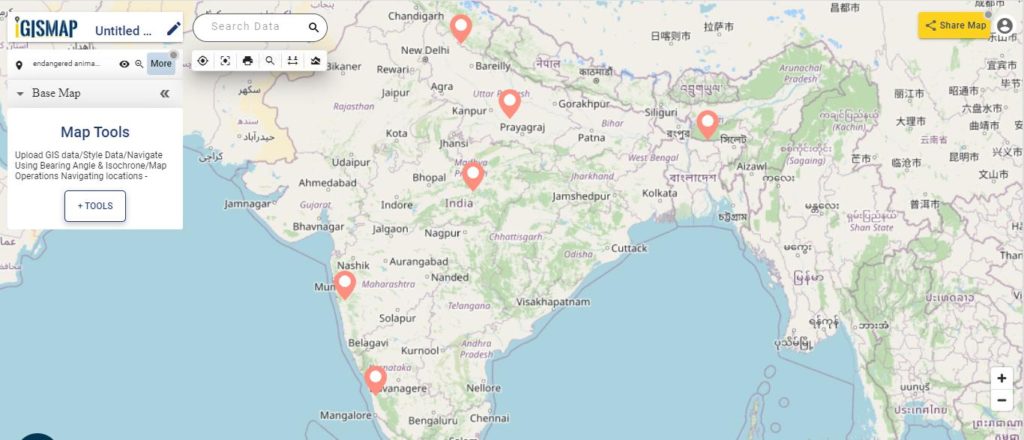
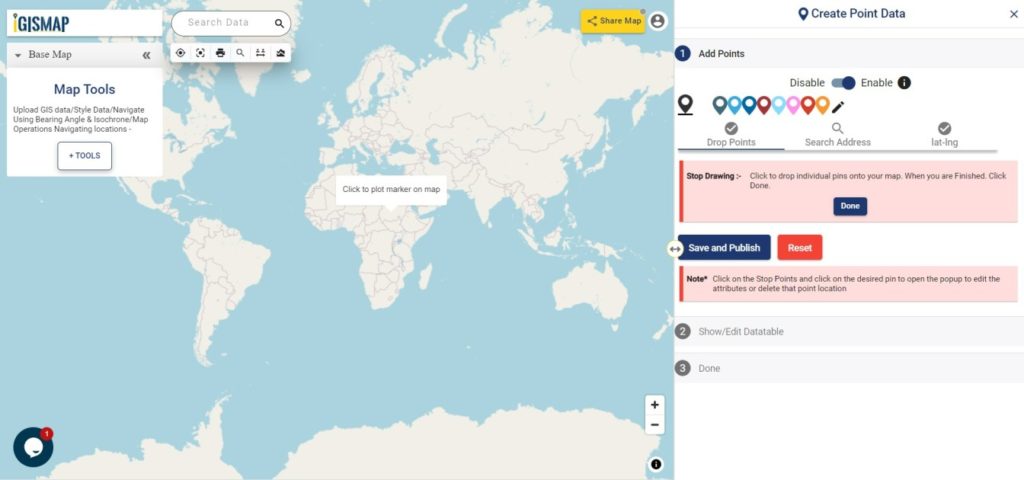
First step is to Add Points, where we can start plotting the habitat locations as points, in the form of pins. IGISMap provides you with three features for plotting points: Drop Points, Search Address, and Lat Lon Values.
- Let’s select the Drop Points option and zoom to the location with the desired location to plot a pin in that specific location on the map
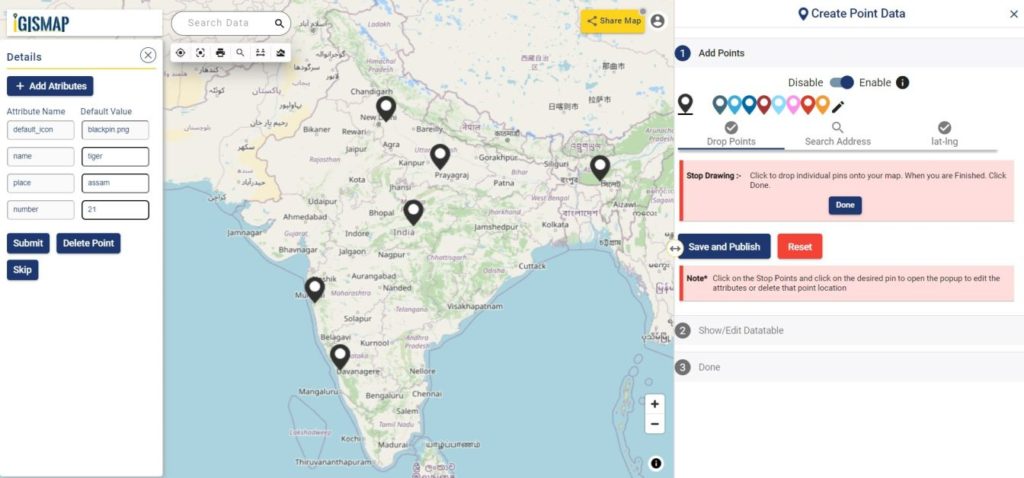
Everytime when a point gets plotted, a popup will open to enter the attribute values in each attribute field of the habitat locations. Click the Submit button to Submit and save the attribute entries. You can choose to delete the point you plotted by clicking the Delete Point button. Else you can click Skip to close the popup. You can disable the default opening of this popup using the toggle button.

- Search Address option opens a search address box, where you can enter an address and choose the right option from the dropdown list, then click the Plot button to plot a point on that location.
- Lat Lon Values will open two boxes to enter latitude and longitude values of the location you want to plot, Plot Location button in this option will plot a pin at the location you have entered.
A plotted point can be moved to a different location by click and drag to the desired location
Note: If the Drop Points option is active for dropping pins, it should be unselected for selecting the plotted pins to open the attribute popup.
After making all the changes, click on the Save and Publish button to publish the GIS data of habitat locations.
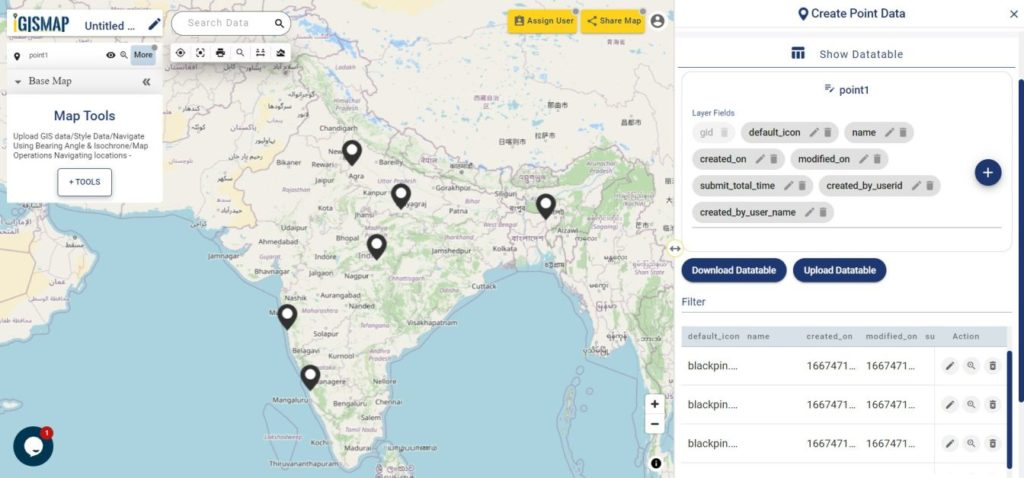
Review and Edit the Datatable of the Data
Save and Publish button will publish the point location of endangered animals as point GIS data layer. The default name of the published layer will be point1 that can be edited any time. Show/Edit Datatable section will also open, where attribute fields and attribute values of each location can be edited, updated or deleted.
Option to update the data table as bulk is available in this section. Here the whole datatable can be downloaded in Excel format using Download Datatable button. And to make the changes outside IGISMap, then upload the edited/updated spreadsheet file using Upload Datatable button. Further, integrate with the same point data of habitat locations.
Here the Back button is present for going back to the Add Points section to add more points or click Next option to proceed further.
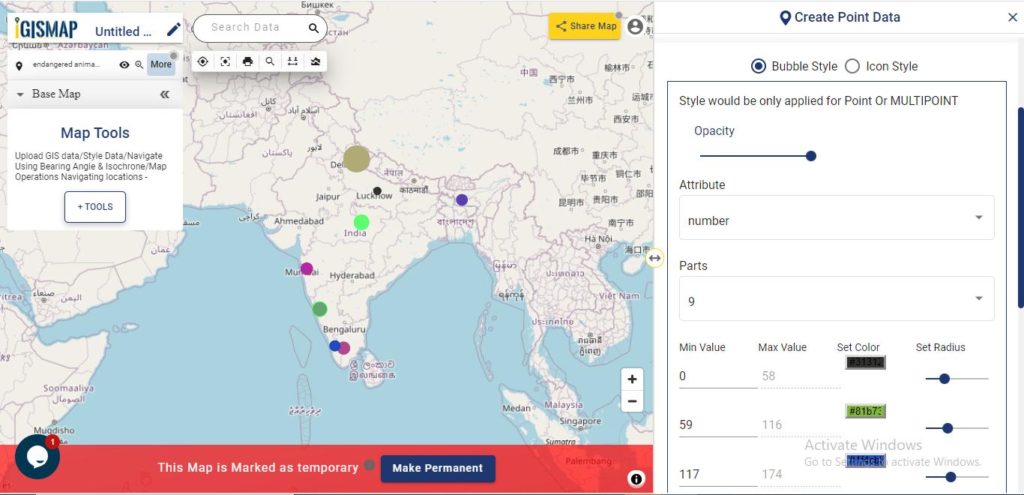
Styling The Habitat Location Points Of Endangered Species
A map will become more meaningful if appropriate icons and colors are used to visualize the features of the map. IGISMap provides – Bubble Style and Icon Style for point GIS data. Icon Styling has two more options – Basic Icon and Category Icon styling.
In basic styling, users can use different styling options for the pin. In Basic Icon styling, user can select any of the icons to represent the point locations.
Check this article to understand How to style point GIS data categorically using Icon Style tool
Here we are going to style our data using Bubble Style. Bubble style is used to visualize the data quantitatively based on the numerical fields in the datatable. We can assign the size and color of the bubble for each class of values.
Check this article understand How to create Bubble Map for point GIS data
IGISMap provides direct access to Icon Style and Bubble Style tools from an existing map, where you can style point GIS data published in that map
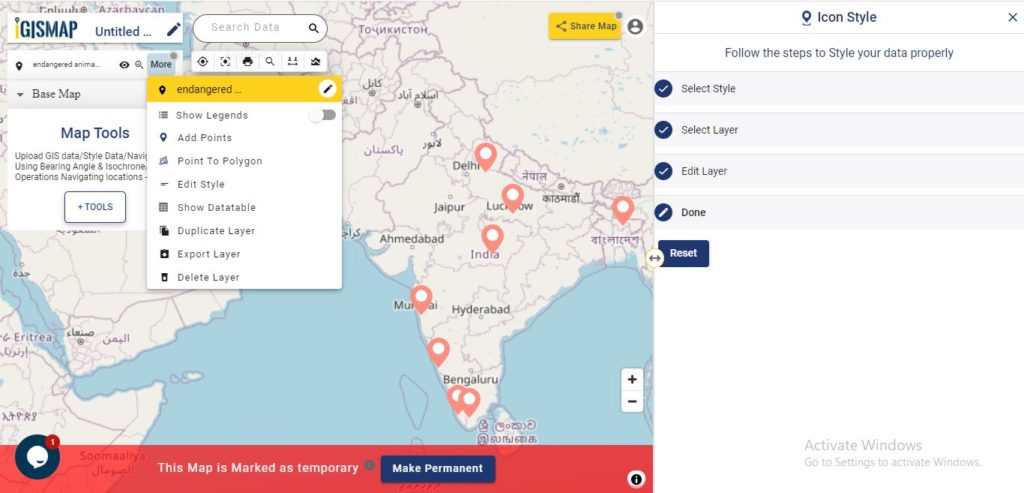
It’s done! Now if the user wants to add more points, click on Create more points on the layer option. If the user wants to create a new layer, select Create New Layer option.
Add Points feature is available in the More section of the layer which will allow to add more points and attribute informations to the data you created.
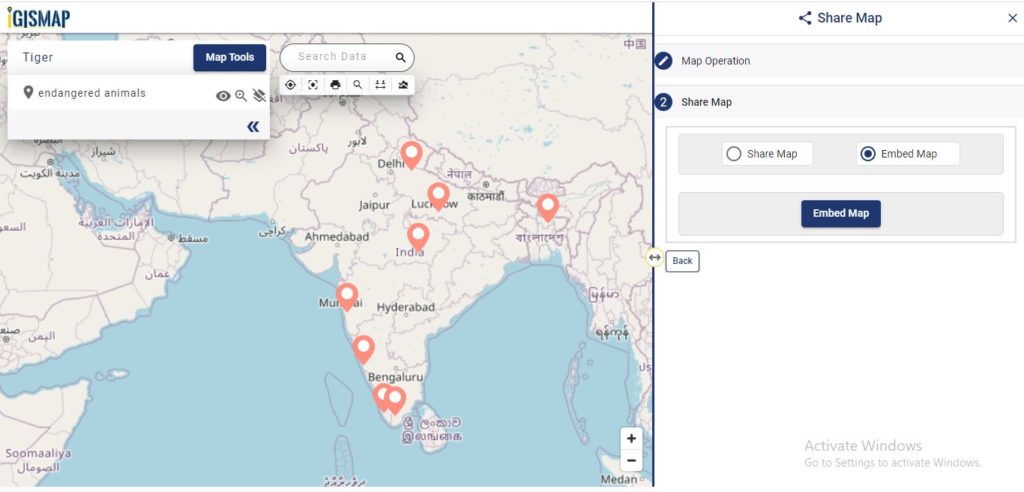
Embedding Map In Your Website
Now lets embed the map of habitat location in a website. For this, click the ![]() button at the top right, where you will reach the UI to control the sharing of this map.
button at the top right, where you will reach the UI to control the sharing of this map.
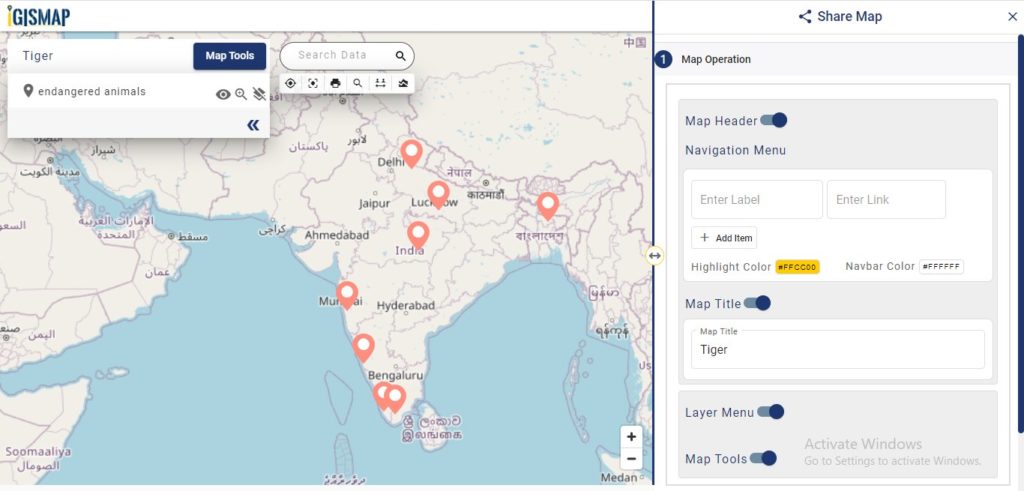
Enable and provide the necessary components of the Share Map and click Next button. Now select the Embed Map option and click Embed Map button.
A popup appears with html iframe code
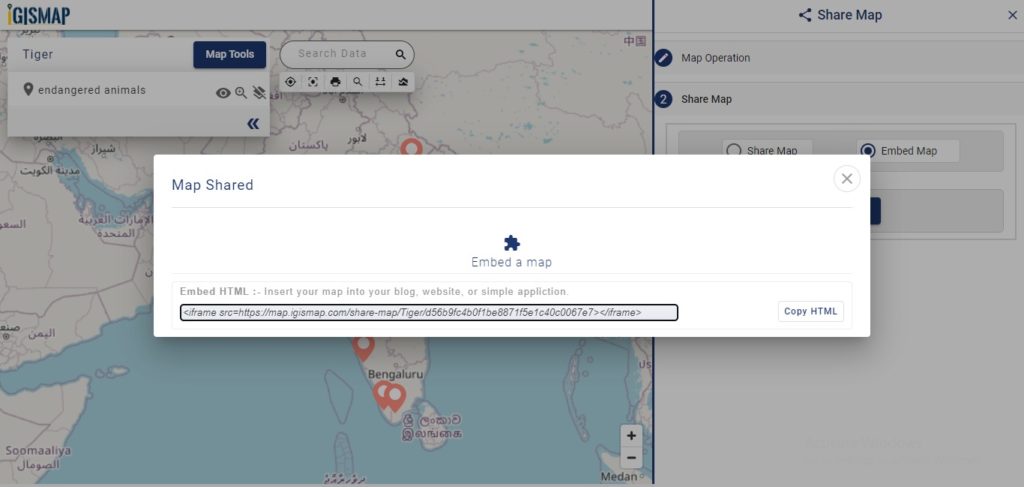
Copy this link from the popup and attach it to your website. Check the article Share your Map to understand more about Share Map feature of IGISMap.