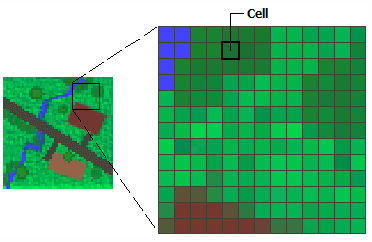
Get Band Information from WMS Geoserver Leafletjs. Band Information from Layer: In its simplest form, a raster consists of a matrix of cells (or pixels) organized into rows and columns (grid), where each cell contains a value representing information, such as temperature, precipitation or elevation etc. Rasters are digital aerial photographs, imagery from satellites, digital pictures, or even scanned maps.
Data stored in a raster format represents real-world phenomena – Get Band Information from WMS Geoserver Leafletjs:
Thematic data (also known as discrete) represents features such as land-use or soils data.
Continuous data represents phenomena such as temperature, elevation, or spectral data such as satellite images and aerial photographs.
Pictures include scanned maps or drawings and building photographs.
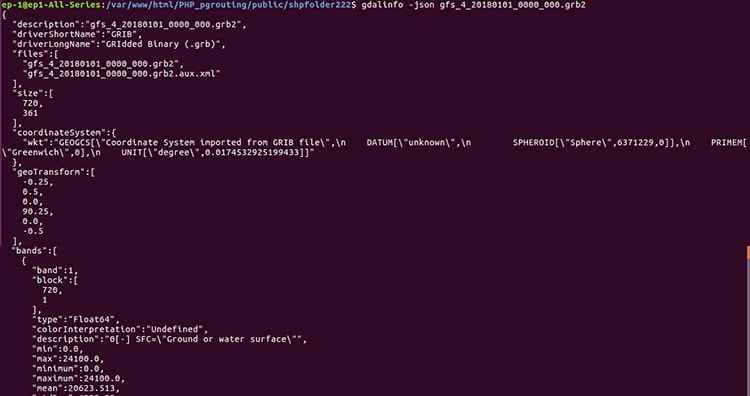
You may check different multidimensional multiband files like Grib files, NetCDF files and Hdf5 files.
There are three main ways to display (render) single-band raster datasets:
Using two colors—In a binary image, each cell has a value of 0 or 1 and is often displayed using black and white. This type of display is often used for displaying scanned maps with simple line work, such as parcel maps.
Grayscale—In a gray scale image, each cell has a value from 0 to another number, such as 255 or 65535. These are often used for black-and-white aerial photographs.
Color map—One way to represent colors on an image is with a color map. A set of values is coded to match a defined set of red, green, and blue (RGB) values.
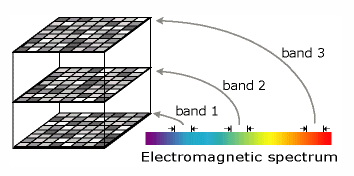
When there are multiple bands, every cell location has more than one value associated with it. With multiple bands, each band usually represents a segment of the electromagnetic spectrum collected by a sensor. Bands can represent any portion of the electromagnetic spectrum, including ranges not visible to the eye, such as the infrared or ultraviolet sections. The term band originated from the reference to the color band on the electromagnetic spectrum.
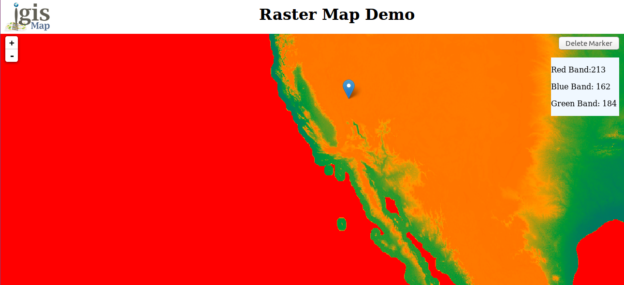
This demo shows the raster overlay on map with the help of Leaflet javascript library. The raster contains three bands as Red, Blue and green. Here raster data is in GeoTiff format and is published on Geoserver. This demo is about how one can extract the Bands information from layer. In similar way we can also extract values such as elevation, any natural hazards distortion or changes in data from layers.
Get Band Information from WMS Geoserver Leafletjs
For this demo we have downloaded data from from one of the free data download website. It is a raster data containing three bands as blue, red and green. In this demo we render raster data on map and shown the value of bands using popup.
Raster data on GeoServer and styling:
GeoServer is an open source server for sharing geospatial data in both vector format and raster format. It is designed to host major datasets, which can easily render on maps.
To Download and install GeoServer please follow the last article. Then login to the GeoServer and publish data on the Geoserver and get the link from layer preview section. You can visit the articles to know how to publish and style the GeoTiff file on Geoserver and also how to make geotiff work with geowebcache for tiling.
For rendering layer on map, you need to create division for map.
var map = L.map('map').setView([34.84859848,-111.788002],5); L.tileLayer('http://{s}.tile.osm.org/{z}/{x}/{y}.png', { attribution: '© <a href=”http://osm.org/copyright”>OpenStreetMap</a> contributors' }).addTo(map);
Render Raster on Map:
To render this data on map, we need to get the data from GeoServer, which can be done by using leaflet javascript library. In the Leaflet library, we have Leaflet-WMS plugin.
<script src="leaflet.wms.js"></script>
What is WMS service:
WMS (web map service), is a way of publishing maps. This format is similar to map tiles, but more generic. A WMS image is defined by the coordinates.
L.tileLayer.wms: It provides a simple interface for loading tiles from a WMS service. Here we also need to provide layer name, format of layer and make transparent as true.
var raster = L.tileLayer.wms('http://139.59.42.235:8080/geoserver/portfolio/wms?',{
    layers: 'HYP_HR',
    format: 'image/png',
    transparent: true
}).addTo(map);
In this way we can render raster data and have layer information. This information further can be used for analysis purpose. For example we can have vegetation index (NDVI) from values of bands. We can actually calculate the loss information if having two time series band information.
function showGetFeatureInfo(latlng,layer){
 var prop = layer.features[0].properties;
 var mark=L.marker([latlng.lat,latlng.lng]).addTo(map);
 var blue=prop['BLUE_BAND'];
 var green=prop['GREEN_BAND'];
 var red=prop['RED_BAND'];
 mark.bindPopup("Blue Band: "+blue.toString()+"
 <br>Green Band:"+green.toString()+"
 <br>Red Band:"+red.toString());
 document.querySelector('#demoR').innerHTML=red; document.querySelector('#demoB').innerHTML=blue; document.querySelector('#demoG').innerHTML = green; }

Check more:
Speed up the rendering of data
Comment below if you found any issue in getting band information in the box provided. Thanks.