In this tutorial we are focusing on the Leafletjs basic shapes used for mapping. Leaflet.js can add various shapes such as circles, polygons, rectangles, polylines, points or markers etc. here, we will discuss how to use the shapes provided by Google Maps. If you are not familiar with Leaflet.js, you can visit our another blog Leaflet js – Getting Started – create Map Application. Also if you already have geojson files, you can load the geojson files with leafletjs as a map.
Marker or Point
To draw point overlay on a map using leaflet javascript library, follow the steps below-
- Create a Map object by passing a <div> element (String or object) and map options (optional).
- Create a Layer object by passing the URL of the desired tile.
- Add the layer object to the map using the addLayer() method of the Map class.
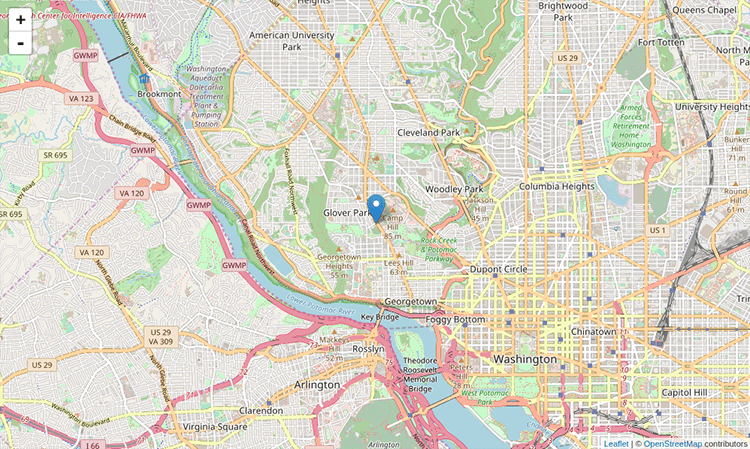
- Create a latlangs variable for the point to draw point or marker, as shown below.
Var point = [38.9188702,-77.0708398];- Create a point or marker using the L.marker(). To draw the marker, pass the location as variable.
L.marker([38.9188702,-77.0708398]).addTo(newMap);
Polyline
- Create a point or marker using the L.marker(). To draw the marker, pass the location as variable.
To draw polyline overlay on a map using Leaflet JavaScript library, follow the steps given below −
- Create a Map object by passing a <div> element (String or object) and map options (optional).
- Create a Layer object by passing the URL of the desired tile.
- Add the layer object to the map using the addLayer() method of the Map class.
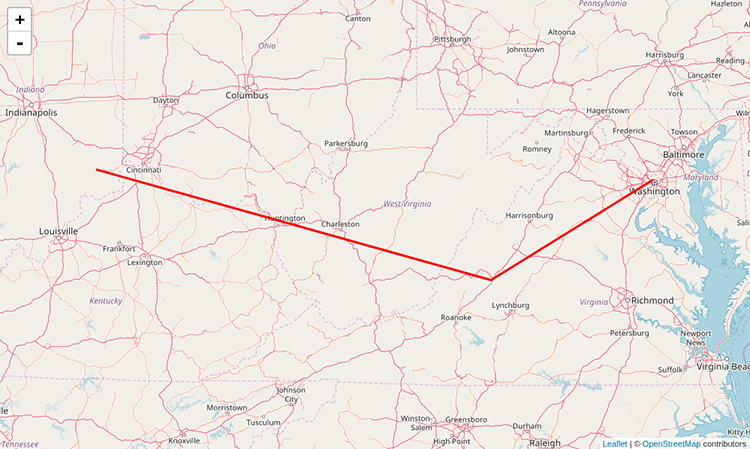
- Create a latlangs variable to hold the points to draw polyline, as shown below.
var latlngs = [ [38.91,-77.07], [37.77, -79.43], [39.04, -85.2]];
- Create a polyline using the L.polyline(). To draw the polyline, pass the locations as variable and an option to specify the color of the lines.
var polyline = L.polyline(latlngs, {color: 'red'}); - Add the polyline to the map using the addTo() method of the Polyline class.
Polygon
- Create a polyline using the L.polyline(). To draw the polyline, pass the locations as variable and an option to specify the color of the lines.
To draw a polygon overlay on a map using Leaflet JavaScript library, follow the steps given below −
- Create a Map object by passing a <div> element (String or object) and map options (optional).
- Create a Layer object by passing the URL of the desired tile.
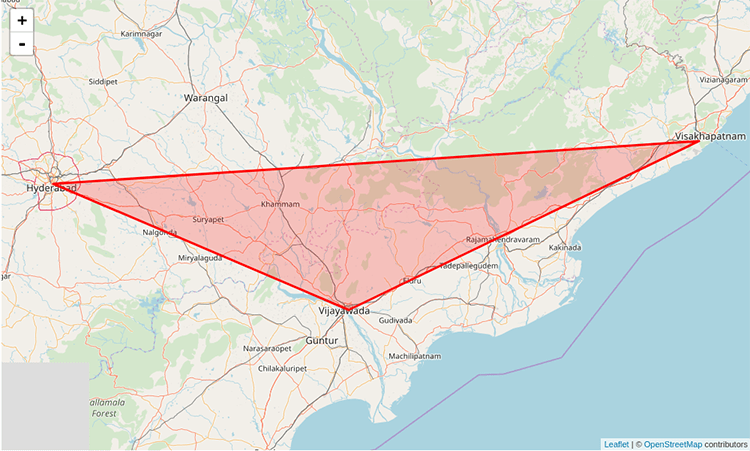
Add the layer object to the map using the addLayer() method of the Map class. - Create a latlangs variable to hold the points to draw the polygon.
var latlngs = [
   [17.385044, 78.486671],
   [16.506174, 80.648015],
   [17.686816, 83.218482]
];
- Create a polygon using the L.polygon(). Pass the locations/points as variable to draw the polygon, and an option to specify the color of the polygon.
var polygon = L.polygon(latlngs, {color: 'red'}); - Add the polygon to the map using the addTo() method of the Polygon class.
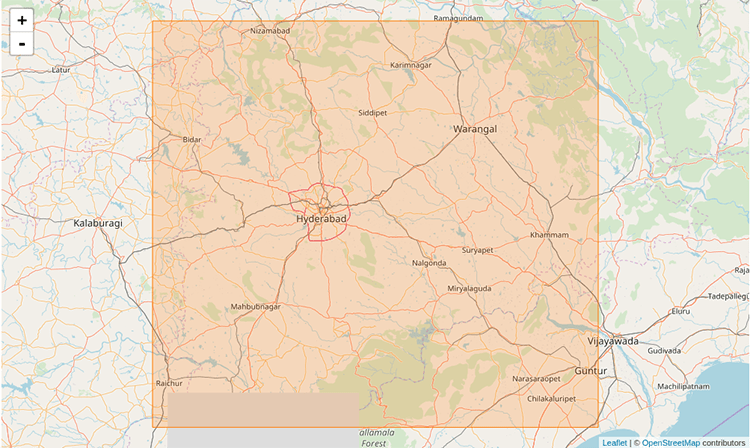
Rectangle
To draw a Rectangle overlay on a map using Leaflet JavaScript library, follow the steps given below –
- Create a Map object by passing a <div> element (String or object) and map options (optional).
- Create a Layer object by passing the URL of the desired tile.
Add the layer object to the map using the addLayer() method of the Map class. - Create a latlangs variable to hold the points to draw a rectangle on the map.
var latlngs = [[18.739046, 80.505755], [15.892787, 77.236081]]; - Create a rectangle using the L.rectangle() function. Pass the locations/points as a variable to draw a rectangle and rectangle Options to specify the color and weight of the rectangle.
var rectOptions = {color: 'Red', weight: 1}
var rectangle = L.rectangle(latlngs, rectOptions);
- Add the rectangle to the map using the addTo() method of the rectangle class.
rectangle.addTo(map);
- Add the rectangle to the map using the addTo() method of the rectangle class.
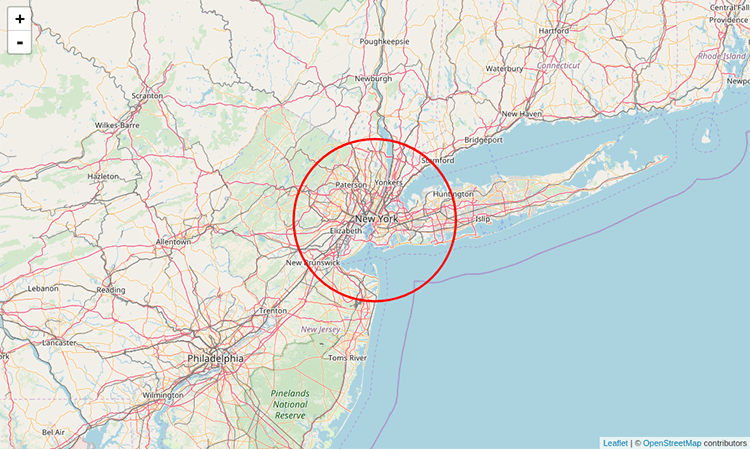
Circle
To draw a circle overlay on a map using Leaflet JavaScript library follow the steps given below.
- Create a Map object by passing a <div> element (String or object) and map options (optional).
- Create a Layer object by passing the URL of the desired tile.
Add the layer object to the map using the addLayer() method of the Map class. - Create a latlangs variable to hold the center of the circle as shown below.
var circleCenter = [40.72, -74.00]; - Create a variable circleOptions to specify values to the options color, fillColor and, fillOpacity as shown below.
var circleOptions = {
   color: 'red',
   fillColor: '#f03',
   fillOpacity: 0
}
- Create a circle using L.circle(). Pass the center of the circle, radius, and the circle options to this function.
var circle = L.circle(circleCenter, 50000, circleOptions); - Add the above-created circle to the map using the addTo() method of the Polyline class.
circle.addTo(map);
This article contains the basic shapes created and used in the leaflet js scripting library. If you have any questions related to leaflet.js, please let us know in the comment section.