This article i.e Leaflet Print Map – Legends, Title, Layer, Color is for how can we take a beautiful map on paper from web by making it printable, with all map elements as map title and legends etc. Here we will use leaflet-image plugin from leaflet JavaScript library. This plugin uses the map and canvas HTML tag.
Leaflet Print Map – Legends, Title, Layer, Color
This plugin can be downloaded from https://github.com/mapbox/leaflet-image/blob/gh-pages/leaflet-image.js link. To implement this plugin on your system, you first need to create map, which can be done by following this article.
First of all add the leaflet library in your document by adding these scripts.
 <link rel="stylesheet" href="https://unpkg.com/leaflet@1.0.3/dist/leaflet.css"/>
 <script  scr="https://unpkg.com/leaflet@1.0.3/dist/leaflet.js" ></ script>
Thereafter, create a division using
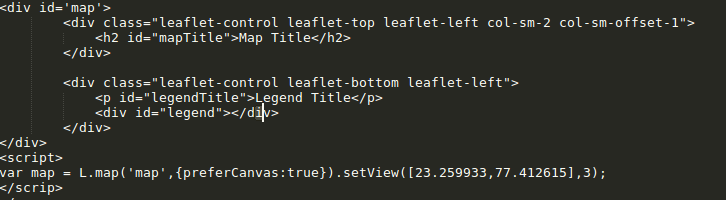
After adding the leaflet-image plugin in document you can call the leafletimage() method, which takes map as input and calls to callback function.
This function create a canvas html tag sets its width and heigth. Which draws layer in same order as drawn on map i.e. tile, path and markers. Before calling this function you must create function to get legend and map title with leaflet.
Here we have create getMapHeading() function which takes context and canvas as input. So what is Content?
var context = canvas.getContext(contextType);
getContext()– method returns a drawing context on the canvas.
contextType-Is a DOMString containing the context identifier defining the drawing context associated to the canvas. “2d”, leading to the creation of a CanvasRenderingContext2D object representing a two-dimensional rendering context.
canvas– element is used to draw graphics on a web page.
Map Title in Leaflet Map
Take the map title in a variable and measure its width. if its width is less than one forth of canvas width then set its width according to canvas width. else the tile is larger then split it.
function getMapHeading(context,canvas){
var mapheading = $("#mapTitle").html();
var pix = context.measureText(mapheading).width;
if(pix<(canvas.width/4))
{
var xval = (canvas.width-pix*4)/2;
context.font = "bold 35px proximanova-semibold-webfont";
context.fillText(mapheading,xval,40);
}
else
{
mapheading = mapheading.split(" ");
//console.log("mapheading",mapheading);
//mapheading = mapheading.toString();
pix = canvas.width/4;
var line = "",nextline = "";
for(var i=0; i<mapheading.length; i++)
{
if(context.measureText(line).width<pix)
{
line += mapheading[i] + " ";
}
else
{
nextline += mapheading[i] + " ";
}
}
context.font = "bold 35px proximanova-semibold-webfont";
context.fillText(line,25,40);
if(nextline.length>0)
{
context.fillText(nextline,25,80);
}
}
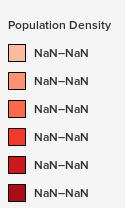
}Map Legends in Leaflet Map Printable
Similarly function is created for legend as getLegeds(). In this function we have taken legend title, icon, range and containing div in variables. Check everything and recreate the context as you want it to be appeared on print.
function getLegends(context,canvas){
 var legendheading = $("#legendTitle").html();
 var paralegend = $('.paralegend');
 var legendclr = $('.paralegend i');
 var divlegend = $('.leaflet-control.leaflet-bottom.leaflet-left');
 var width = divlegend.width(),height = divlegend.height();
 var x =10,dx=20,dy=20;
 var y = canvas.height-height+15;
 var legendtext = [],legendcolor = [],rects = [];
 for(var i=0; i<paralegend.length;i++)
 {
 legendtext.push(paralegend[i].innerText);
 }
 for(var j=0; j<legendclr.length; j++)
 {
 legendcolor.push(legendclr[j].style.background);
 }
 for(var l=0;l<legendcolor.length;l++)
 {
 rects.push(new shape(x,y,dx,dy,legendcolor[l],legendtext[l]));
 y=y+25;
 }
 context.font = "bold 15px proximanova-semibold-webfont";
 context.fillText(legendheading,x,canvas.height-height);
 for(var k=0;k<rects.length;k++)
 {
 var sqr = rects[k];
 context.fillStyle = sqr.fill;
 context.fillRect(sqr.x,sqr.y,sqr.dx,sqr.dy);
 context.strokeStyle='#000';
 context.lineWidth=1;
 context.strokeRect(sqr.x,sqr.y,sqr.dx,sqr.dy);
 context.fillStyle = 'black';
 context.font = "15px proximanova-semibold-webfont";
 context.fillText(sqr.text,sqr.x+25,sqr.y+15);
 }
 }
Leaflet-image plugin for printing map – Leaflet Print Map – Legends, Title, Layer, Color
Now Call the leafletImage() function and provide the create map and call the callback function. In this callback you can call the getMapHeading() and getLegends() functions. For this function we have taken the image data in data variable by using getImageData() method. And The getImageData() method returns an ImageData object that copies the pixel data for the specified rectangle on a canvas.
So the rectangle is given as whole canvas. Then set the globalCompositionOperation as destination-over. The globalCompositeOperation property sets or returns how a source (new) image are drawn onto a destination (existing) image. The putImageData() puts the image data back onto the canvas. The drawImage method draws an image onto the canvas.
leafletImage(map, function(err, canvas) {
var context = canvas.getContext("2d");
getMapHeading(context,canvas);
getLegends(context,canvas);
var data = context.getImageData(0, 0, canvas.width, canvas.height);
//store the current globalCompositeOperation
var compositeOperation = context.globalCompositeOperation;
//set to draw behind current content
context.globalCompositeOperation = "destination-over";
//set background color
//context.fillStyle = "grey";
context.fillStyle = "#ddd";
//draw background / rect on entire canvas
context.fillRect(0, 0, canvas.width, canvas.height);
var dataURL = canvas.toDataURL("image/png");
console.log(dataURL);
context.clearRect (0,0,canvas.width, canvas.height);
//restore it with original / cached ImageData
context.putImageData(data, 0,0);
//reset the globalCompositeOperation to what it was
context.globalCompositeOperation = compositeOperation;
context.drawImage(canvas,0,0);
print.href = dataURL;
print.download = "map.png";
});
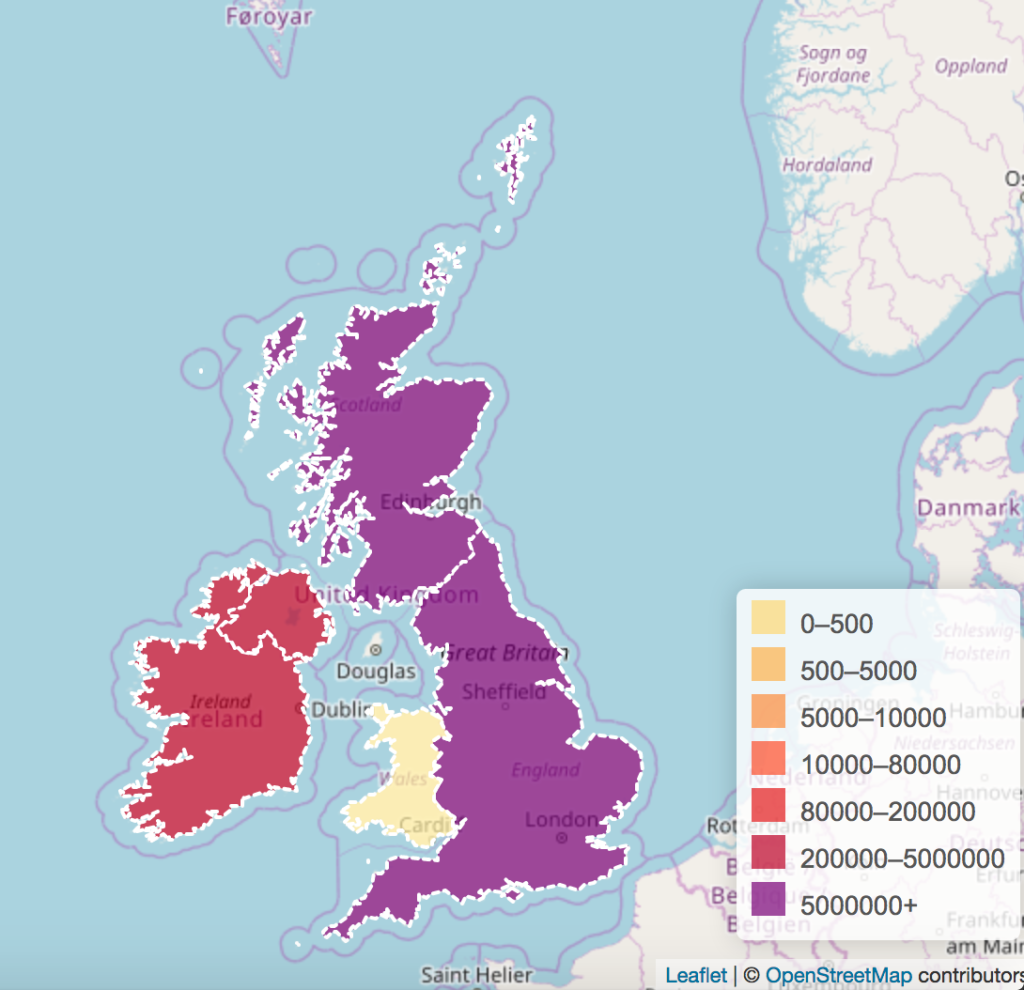
finally On printing the map will look like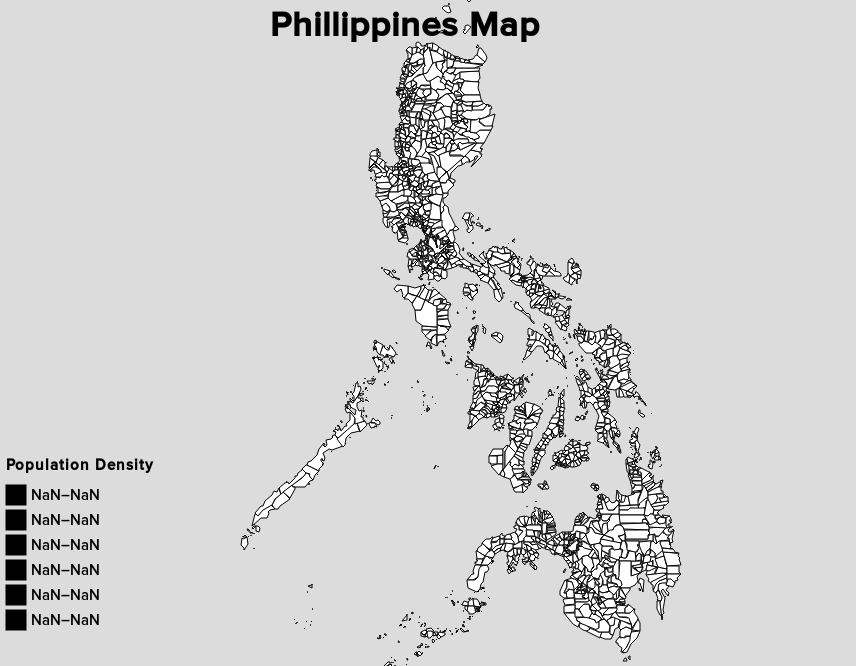
Hope you enjoyed this article and are now able to create Leaflet Print Map – Legends, Title, Layer, Color. If you find any problem in implementing a printable map, do comment below. Thanks.