Easily Download Farmhouse Data for Any Region in Minutes

Accessing location-based property information has become much easier with modern GIS platforms. With GIS Data by MAPOG, users can Download Farmhouse Data in multiple GIS formats such as Shapefile, KML, MID, GeoJSON, and many others. The platform provides structured geospatial datasets that can be used for mapping, land assessment, agricultural planning, or rural development analysis.

Understanding the Process

GIS Data by MAPOG offers access to hundreds of geospatial layers and datasets that can be downloaded in more than 15 GIS-supported formats. The system is designed to help users easily search, filter, visualize, and download spatial datasets without complex processing. As a result, professionals and researchers can efficiently obtain accurate farmhouse location data for mapping, analysis, and planning.

How to Download Farmhouse Data

MAPOG simplifies geospatial data access through a clear and guided workflow. The platform provides access to a large collection of geographic datasets with formats such as SHP, KML, CSV, GeoJSON, SQL, DXF, MIF, GPX, TOPOJSON, and more.

Download Farmhouse Data of Any Region

Note
  • All datasets are available in GCS datum EPSG:4326 WGS84 CRS (Coordinate Reference System).
  • Users must log in to the platform in order to access and download datasets in their preferred format.

Step-by-Step Guide to Download Farmhouse Data

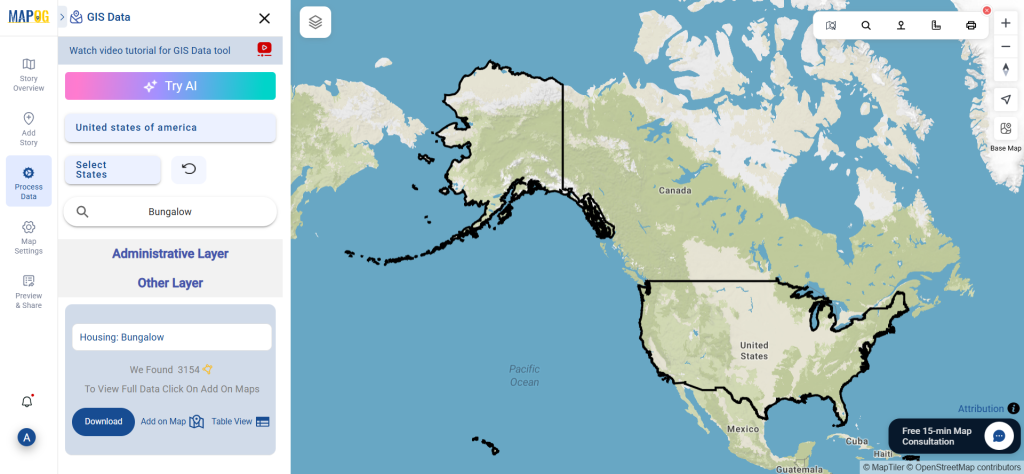
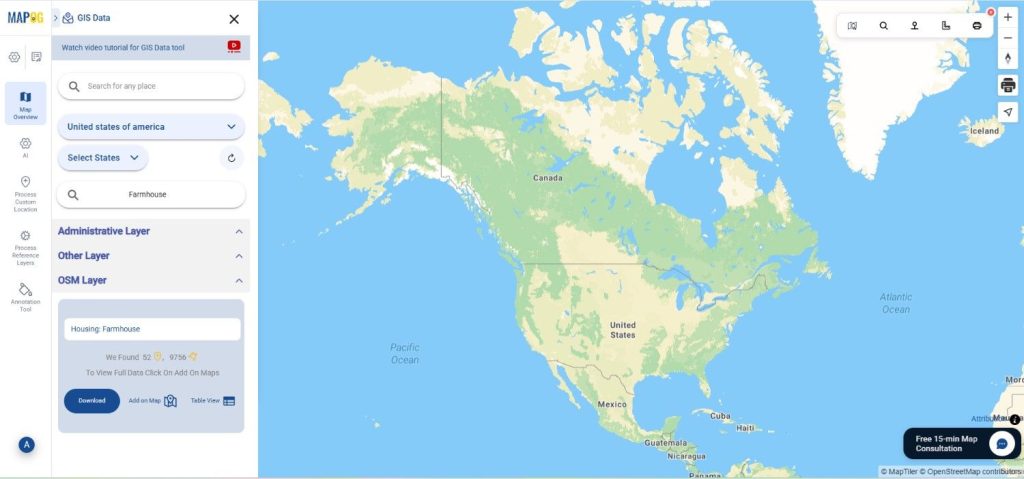
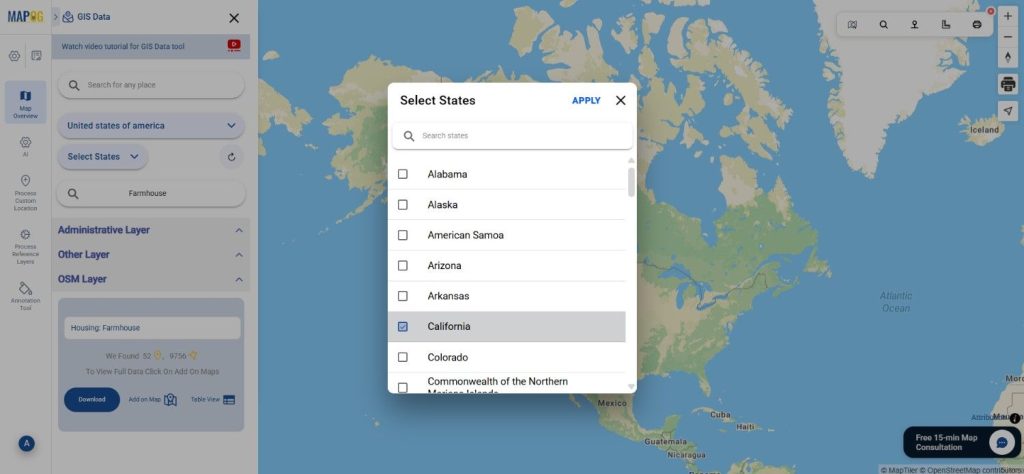
Step 1: Search for Farmhouse Data

Begin by opening the GIS Data by MAPOG interface and selecting the required region. After that, use the Search Layer option and type Farmhouse Data. The dataset will appear along with its attributes, allowing you to verify whether the data is available in point or polygon format.

Download Farmhouse Data
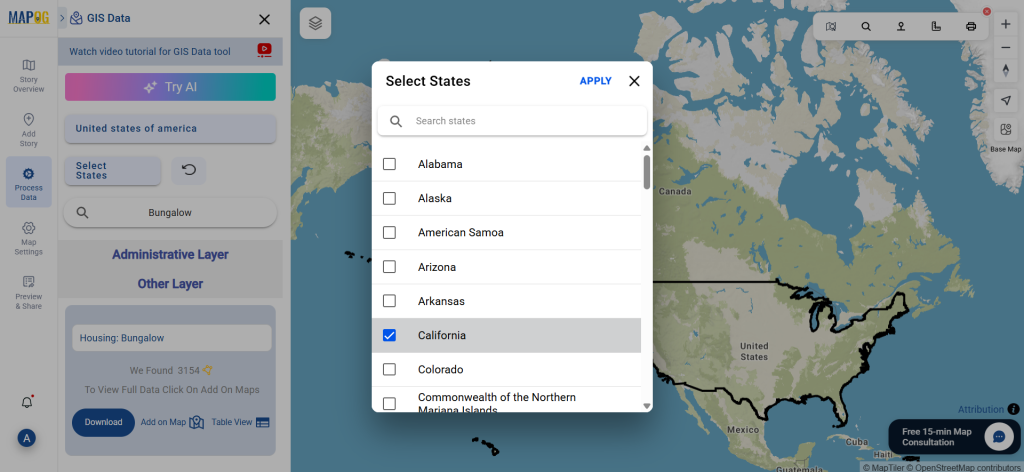
Step 2: Apply Data Filters

To obtain more accurate results, use the Filter Data option. This allows you to narrow down the dataset based on administrative levels such as state or district. As a result, users can work with more precise data relevant to their mapping or research needs.

Download Farmhouse Data
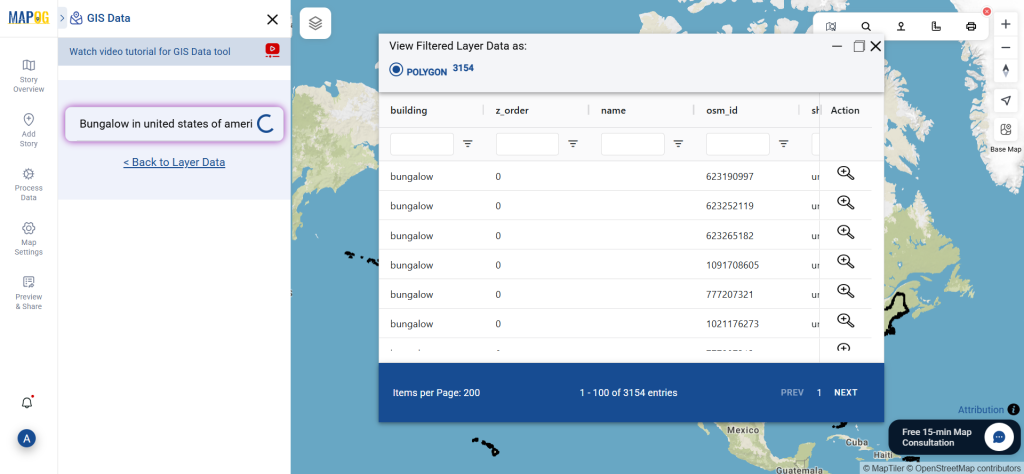
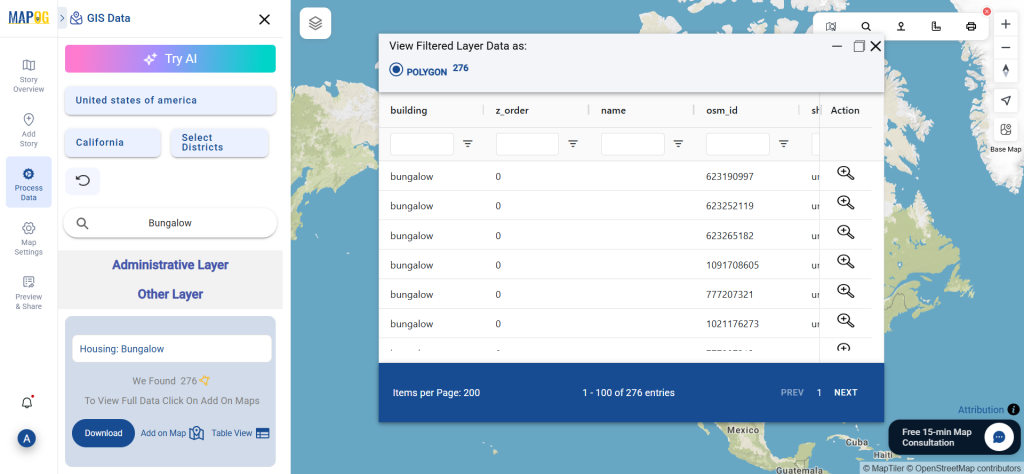
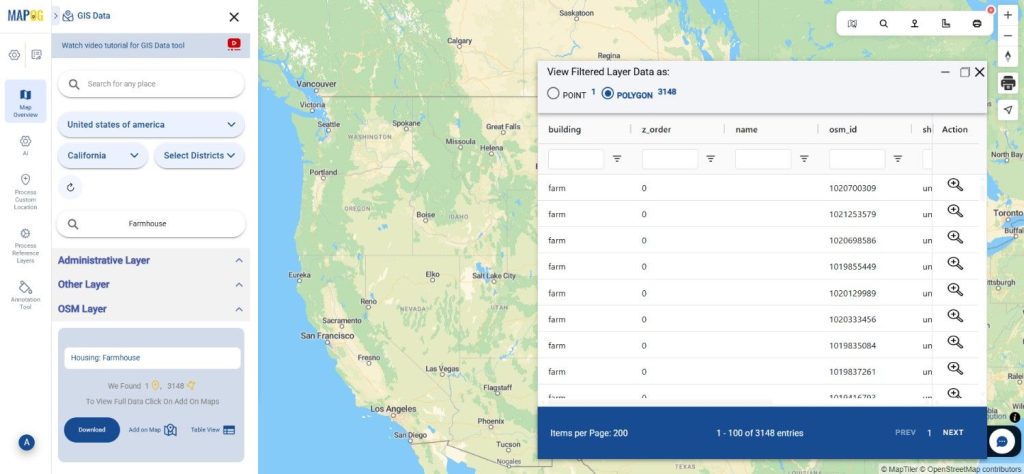
Step 3: Visualize Using “Add on Map”

Before downloading, users can review the dataset by using the Add on Map option. This feature displays the farmhouse layer directly in the map analysis interface, enabling users to explore spatial patterns and confirm the dataset before proceeding.

Download Farmhouse Data
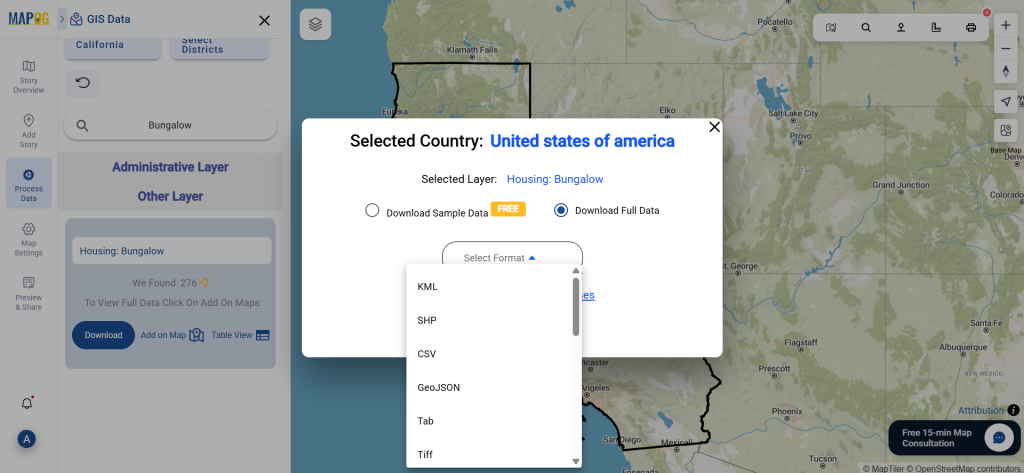
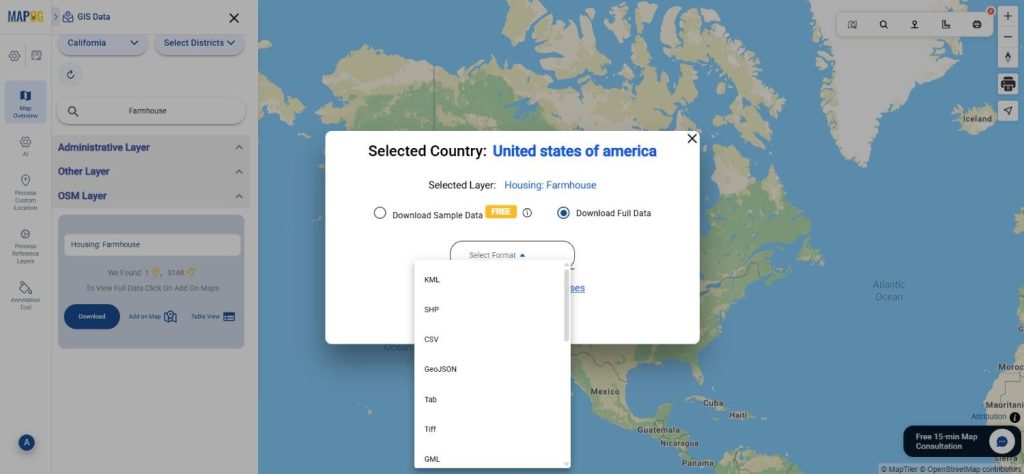
Step 4: Download the Dataset

Finally, once the data is verified, click on Download Data. Users can choose either a sample dataset or the full dataset. Select the desired format such as Shapefile, KML, MID, or other supported GIS formats, accept the terms, and the Download Farmhouse Data process will begin instantly.

Download Farmhouse Data

Conclusion

GIS Data by MAPOG makes geospatial data access simple and efficient for professionals and researchers. With its advanced search tools, filtering options, and interactive map visualization, users can easily obtain farmhouse location datasets for a wide range of GIS applications. Whether the goal is land-use analysis, rural infrastructure planning, or property mapping, the platform provides reliable datasets in multiple formats for smooth GIS integration.

With MAPOG’s versatile toolkit, you can effortlessly upload vectors and upload Excel or CSV data, incorporate existing layers, perform polygon splitting, use the converter for various formats, calculate isochrones, and utilize the Export Tool.

For any questions or further assistance, feel free to reach out to us at support@mapog.com. We’re here to help you make the most of your GIS data.

Download Shapefile for the following:

  1. World Countries Shapefile
  2. Australia
  3. Argentina
  4. Austria
  5. Belgium
  6. Brazil
  7. Canada
  8. Denmark
  9. Fiji
  10. Finland
  11. Germany
  12. Greece
  13. India
  14. Indonesia
  15. Ireland
  16. Italy
  17. Japan
  18. Kenya
  19. Lebanon
  20. Madagascar
  21. Malaysia
  22. Mexico
  23. Mongolia
  24. Netherlands
  25. New Zealand
  26. Nigeria
  27. Papua New Guinea
  28. Philippines
  29. Poland
  30. Russia
  31. Singapore
  32. South Africa
  33. South Korea
  34. Spain
  35. Switzerland
  36. Tunisia
  37. United Kingdom Shapefile
  38. United States of America
  39. Vietnam
  40. Croatia
  41. Chile
  42. Norway
  43. Maldives
  44. Bhutan
  45. Colombia
  46. Libya
  47. Comoros
  48. Hungary
  49. Laos
  50. Estonia
  51. Iraq
  52. Portugal
  53. Azerbaijan
  54. Macedonia
  55. Romania
  56. Peru
  57. Marshall Islands
  58. Slovenia
  59. Nauru
  60. Guatemala
  61. El Salvador
  62. Afghanistan
  63. Cyprus
  64. Syria
  65. Slovakia
  66. Luxembourg
  67. Jordan
  68. Armenia
  69. Haiti And Dominican Republic
  70. Malta
  71. Djibouti
  72. East Timor
  73. Micronesia
  74. Morocco
  75. Liberia
  76. Kosovo
  77. Isle Of Man
  78. Paraguay
  79. Tokelau
  80. Palau
  81. Ile De Clipperton
  82. Mauritius
  83. Equatorial Guinea
  84. Tonga
  85. Myanmar
  86. Thailand
  87. New Caledonia
  88. Niger
  89. Nicaragua
  90. Pakistan
  91. Nepal
  92. Seychelles
  93. Democratic Republic of the Congo
  94. China
  95. Kenya
  96. Kyrgyzstan
  97. Bosnia Herzegovina
  98. Burkina Faso
  99. Canary Island
  100. Togo
  101. Israel And Palestine
  102. Algeria
  103. Suriname
  104. Angola
  105. Cape Verde
  106. Liechtenstein
  107. Taiwan
  108. Turkmenistan
  109. Tuvalu
  110. Ivory Coast
  111. Moldova
  112. Somalia
  113. Belize
  114. Swaziland
  115. Solomon Islands
  116. North Korea
  117. Sao Tome And Principe
  118. Guyana
  119. Serbia
  120. Senegal And Gambia
  121. Faroe Islands
  122. Guernsey Jersey
  123. Monaco
  124. Tajikistan
  125. Pitcairn

Disclaimer : The GIS data provided for download in this article was initially sourced from OpenStreetMap (OSM) and further modified to enhance its usability. Please note that the original data is licensed under the Open Database License (ODbL) by the OpenStreetMap contributors. While modifications have been made to improve the data, any use, redistribution, or modification of this data must comply with the ODbL license terms. For more information on the ODbL, please visit OpenStreetMap’s License Page.

Here are some blogs you might be interested in:

Download Bungalow Data for GIS Projects – Shapefile, KML, GeoJSON & More

Looking to download Bungalow Data for your next GIS project? GIS Data by MAPOG makes it incredibly simple to locate and extract structured bungalow location datasets in over 15 GIS-supported formats, including Shapefile (SHP), KML, GeoJSON, and MID. Whether you’re analyzing residential patterns, conducting land use studies, or working on urban planning, this platform gives you direct access to high-quality, up-to-date bungalow data ready for mapping and analysis.

How GIS Data by MAPOG Works

This platform is built for usability and depth—offering access to over 900+ ready-to-use GIS layers. Users can Download Bungalow Data in formats compatible with nearly all GIS applications, including CSV, DXF, TOPOJSON, SQL, GPX, and MIF. Whether you’re a seasoned GIS analyst or just getting started, MAPOG’s interface supports your workflow from data discovery to download.

Download Bungalow Data of any countries

Note:
  • All data is provided in GCS datum EPSG:4326 WGS84 CRS (Coordinate Reference System).
  • Users need to log in to access and download their preferred data formats.

Step-by-Step Guide to Download Bungalow Data

Step 1: Search for Bungalow Data

Begin by typing “Bungalow Data” into the search layer box after selecting your region of interest. The platform offers detailed attributes for each layer—such as structure type, geometry format (point or polygon), and area coverage.

Download Bungalow Data

Speed up your search using MAPOG’s “Try AI” tool. Simply enter queries like “Bungalows in [area]” or “Residential Bungalow locations,” and the AI engine will return the most relevant results, making the search intuitive and quick.

Download Bungalow Data
Step 3: Apply Filters for Deeper Accuracy

You can refine results with the Filter Data option, narrowing down by state, district, or even local municipalities. This helps focus on specific zones and makes your data more actionable for area-based analysis.

Download Bungalow Data
Step 4: Add Layer to Map for Visual Analysis

Using the “Add on Map” option, you can visualize the selected bungalow data directly on the analysis interface. This feature helps identify housing clusters, accessibility issues, and spatial patterns, supporting deeper insight before downloading.

Download Bungalow Data
Step 5: Download Your Data

Once you’re confident with your selection, hit the “Download Data” button. Choose between a sample or complete dataset. Formats like SHP, KML, MID, and more are available. Accept the terms, log in, and your data will be ready for use in any major GIS tool like QGIS or ArcGIS.

Download Bungalow Data

Conclusion

In just a few clicks, you can Download Bungalow Data tailored to your project’s requirements. With its robust filtering, AI-powered search, and multilayer mapping tools, GIS Data by MAPOG stands out as a reliable resource for accessing bungalow datasets across various GIS formats. Whether you’re working in urban development, research, or planning, this platform empowers you to make informed decisions through location-based data.

With MAPOG’s versatile toolkit, you can effortlessly upload vector and upload Excel or CSV data, incorporate existing layers, perform Split polygon by line, use the converter for various formats, calculate isochrones, and utilize the Export Tool.

For any questions or further assistance, feel free to reach out to us at support@mapog.com. We’re here to help you make the most of your GIS data.

Download Shapefile for the following:

  1. World Countries Shapefile
  2. Australia
  3. Argentina
  4. Austria
  5. Belgium
  6. Brazil
  7. Canada
  8. Denmark
  9. Fiji
  10. Finland
  11. Germany
  12. Greece
  13. India
  14. Indonesia
  15. Ireland
  16. Italy
  17. Japan
  18. Kenya
  19. Lebanon
  20. Madagascar
  21. Malaysia
  22. Mexico
  23. Mongolia
  24. Netherlands
  25. New Zealand
  26. Nigeria
  27. Papua New Guinea
  28. Philippines
  29. Poland
  30. Russia
  31. Singapore
  32. South Africa
  33. South Korea
  34. Spain
  35. Switzerland
  36. Tunisia
  37. United Kingdom Shapefile
  38. United States of America
  39. Vietnam
  40. Croatia
  41. Chile
  42. Norway
  43. Maldives
  44. Bhutan
  45. Colombia
  46. Libya
  47. Comoros
  48. Hungary
  49. Laos
  50. Estonia
  51. Iraq
  52. Portugal
  53. Azerbaijan
  54. Macedonia
  55. Romania
  56. Peru
  57. Marshall Islands
  58. Slovenia
  59. Nauru
  60. Guatemala
  61. El Salvador
  62. Afghanistan
  63. Cyprus
  64. Syria
  65. Slovakia
  66. Luxembourg
  67. Jordan
  68. Armenia
  69. Haiti And Dominican Republic
  70. Malta
  71. Djibouti
  72. East Timor
  73. Micronesia
  74. Morocco
  75. Liberia
  76. Kosovo
  77. Isle Of Man
  78. Paraguay
  79. Tokelau
  80. Palau
  81. Ile De Clipperton
  82. Mauritius
  83. Equatorial Guinea
  84. Tonga
  85. Myanmar
  86. Thailand
  87. New Caledonia
  88. Niger
  89. Nicaragua
  90. Pakistan
  91. Nepal
  92. Seychelles
  93. Democratic Republic of the Congo
  94. China
  95. Kenya
  96. Kyrgyzstan
  97. Bosnia Herzegovina
  98. Burkina Faso
  99. Canary Island
  100. Togo
  101. Israel And Palestine
  102. Algeria
  103. Suriname
  104. Angola
  105. Cape Verde
  106. Liechtenstein
  107. Taiwan
  108. Turkmenistan
  109. Tuvalu
  110. Ivory Coast
  111. Moldova
  112. Somalia
  113. Belize
  114. Swaziland
  115. Solomon Islands
  116. North Korea
  117. Sao Tome And Principe
  118. Guyana
  119. Serbia
  120. Senegal And Gambia
  121. Faroe Islands
  122. Guernsey Jersey
  123. Monaco
  124. Tajikistan
  125. Pitcairn

Disclaimer : The GIS data provided for download in this article was initially sourced from OpenStreetMap (OSM) and further modified to enhance its usability. Please note that the original data is licensed under the Open Database License (ODbL) by the OpenStreetMap contributors. While modifications have been made to improve the data, any use, redistribution, or modification of this data must comply with the ODbL license terms. For more information on the ODbL, please visit OpenStreetMap’s License Page.

Here are some blogs you might be interested in:
💬 Book a Meeting