To create GIS Bubble maps, first of all we must know what GIS Bubble Map is? Bubble Map is all about symbolizing layers to represent quantity, as it mostly works in the same way as quantity map. Bubble map uses range of colored bubbles of different sizes in visualization of data and is also known as a “graduated marker map”. To create GIS Bubble map with IGIS Map Tool, you need to also look over the MapOG Tool.
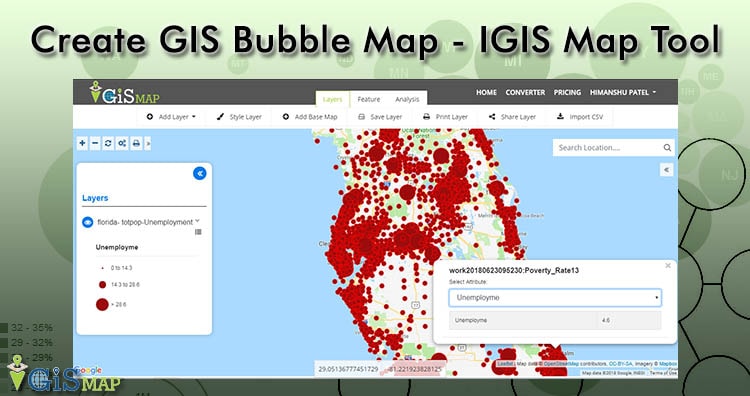
Create GIS Bubble Map – IGIS Map Tool
A bubble map shows circular markers for points, lines, and polygon features of different size. The bubble sizes are based on a selected numerical attribute value from user’s uploaded layer.
To create GIS Bubble Map with IGIS Map Tool you need to follow some steps as follows:
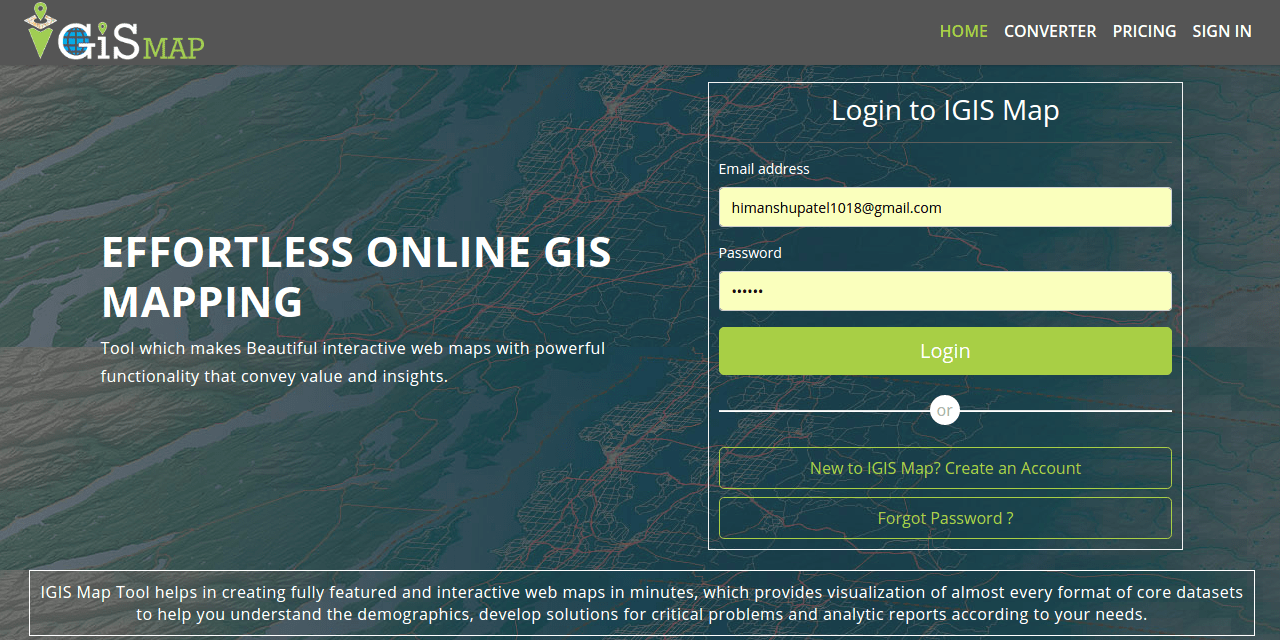
- Go To MapOG Tool and login to your account.
- Upload dataset and create a new map project Or Open your existing map project.

- Once the map is open click on the “Style Layer” option on top of the map layer.

- Select a layer that you want to create GIS Bubble map with.

- Now click on the Bubble map section to create GIS Bubble map.

- Now you can choose the numerical attribute in column to reference for the size of the marker in class break section and in the parts section.
- Columns have the limit of not more than 50 unique values. As it can not style more than 50 values.
- You need to set the number of class breaks required for them as it determines the number of bubble size that is going to be rendering.
- You have to choose the Radius minimum size and maximum size of the bubble.
- Now fill the opacity and the color you want to show in the bubble on map.
- You can also set the opacity & color of the stroke or outline section.
This is how you can Create GIS Bubble Map. This type of visualization is useful for identifying trends & patterns on the basis of location and is most often used for business analysis and demographics mapping.
GIS Bubble Map – Uses
The main use of GIS Bubble Map is the visualization of trends and patterns based on location. Above all Business Analysis and Demographic mapping are some of the main reason to create GIS Bubble Map.
GIS Bubble Map serves in following industries:
- Insurance
- Healthcare
- Real Estate
- Surveying
- Banking etc.
For example, A Surveying company is reviewing the types and locations of airports in the middle east to compare the number of passengers board at airports to the findings from a recently completed research project. Bubble map categorizes the airports by number of passengers that boards the flight in a single day. So this visualization can be used to compare the count of each airport boarding status on daily basis.

(#this is a sample data)
Data and Business analysis is the main reason to Create GIS Bubble Map, It can helps in understanding and comparing the data easily.
I hope this may help you in development and Create GIS Bubble map with IGIS Map Tool. If you find any problem in creating one such example do let us know by commenting below.