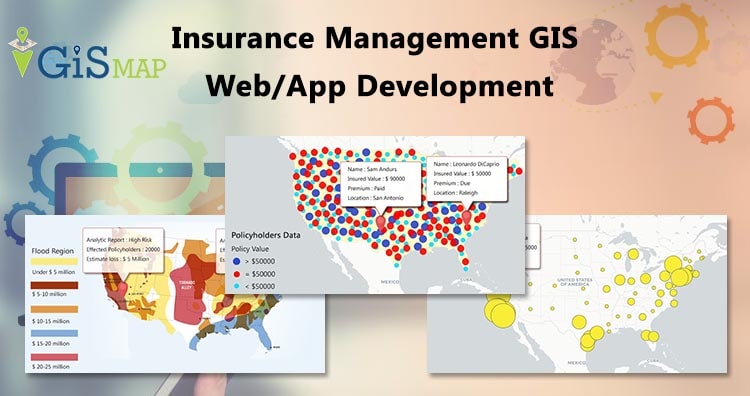
In this blog post we describe a detailed overview of Insurance Management GIS Web/App Development tool’s Requirement, Time, Technology and functionality. Insurance Management GIS map tool provides you every location-based insight you need and It can also be used as Risk Manager as It uses smart maps, data analysis and all of the features for controlling risks and managing business strategies of Insurance companies.
Why one should Build Interactive Insurance Management GIS Map Tool:
For Understanding and Improving Key Performance of Insurance Business with GIS Tool:
- Risk Assessment : Insurance Management GIS Map Tool exposes the exact location of risk for the Insurance companies with the interactive maps and helps in target the limited capital to higher opportunity or areas of lower risk. Our tool provides you insights that supports data-driven decision-making and more effective business strategy.
- Comparing Business Measures : You can easily map business measures and compare them with the help of Insurance Management GIS Map Tool. It can validate various locations and visualize loss patterns on an interactive and beautiful maps.
- Territory Management: Insurance Management GIS Map Tool helps companies in their territory management and our analysis shows how geography interacts with hazards and assets to help companies limit risk. Insurance Management GIS Map Tool helps you implanting and deploying the networks necessary to operate efficiently in your territory.
For Response Planning and management of Insurance with GIS Tool:
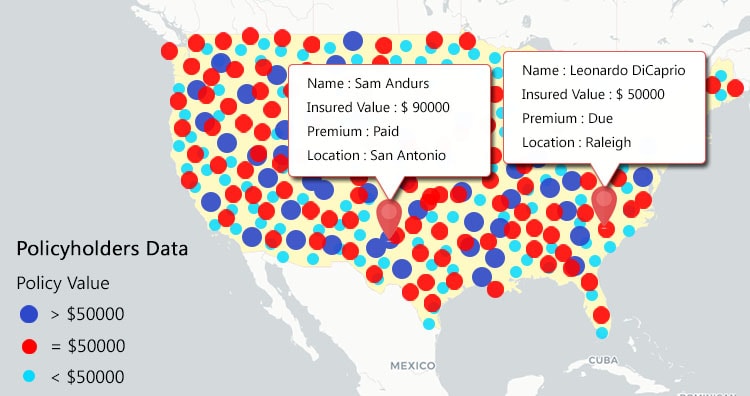
- Manage your Policyholders on interactive map : You can manage your Policyholders on the maps according to their location. you can handle the location details, description, insured values and your client’s network as according to your strategy by using the tool.

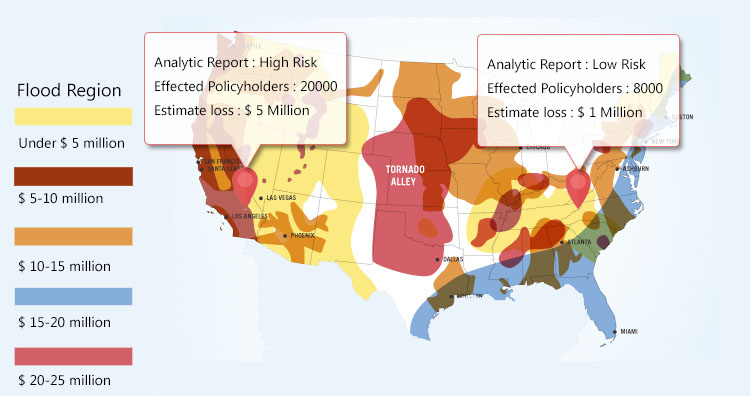
- Disaster analysis: Our tool reduces your companies progressive risk loss with the interactive maps. As these maps, data analytics ensures that you understand risk and make effective management plans.
- Management: An Interactive Insurance Management GIS Map Tool’s maps and spatial data analysis exposes the risk nearness that helps in improving the risk score accuracy. when natural disasters happens and losses occur, Insurers needs to respond to incidents quickly and efficiently for the policyholders and for that this tool lets you quickly visualize events on the map with advanced analytics to prioritize response execution and plan for claims handling prior to catastrophic events.
- Manage your Policyholders on interactive map : You can manage your Policyholders on the maps according to their location. you can handle the location details, description, insured values and your client’s network as according to your strategy by using the tool.
Scope of Insurance Management GIS Web/App Development:
Insurance sector is facing broad changes driven by a convergence of of business and technology forces fuelled by innovation. Insurance companies have immense desires of data to make better decisions and to utilize the data for risk management, companies use strong geographic component. From managing the addresses of policyholders to the location of risk to the logistics of handling claims, GIS benefits the companies most.
In Insurance Management GIS Map Tool policyholders location decides the insured value and importance of claims and how it will be processed. GIS is used as a valuable tool in Insurance Industry. It’s all about predicting risk in the insurance industry. And insurance companies better manage risk with GIS tools which with real-time data helps improve decision-making at a quicker pace.
Insurance Management GIS Map Tool has the range of functions which allows the use of policyholders data and spatial analysis to effectively serve customers, triage claims, and monitor fraudulent activities by embracing location-based intelligence. This system allows you to integrate a large variety of data into one into one place i.e. Map, where you can analyze the incident reports with an infographic representation of policyholders, their insured values and description. This tool provides interactive maps, data analysis and all of the features for controlling risks and managing business strategies.
We provide simple and versatile Insurance Management GIS Map Tool which is backed up by live support. We upsurge your business with the sharpest technology and outstanding features.
Requirement Gathering for Insurance Management App:
What do client require for gis insurance tool with map?
We have an precise idea of our client’s needs for this tool in their business, so here is a list of some main requirements we think that every client would want in their Insurance Management GIS Map Tool.
- Proactively managing risk to improve resilience.
- communicate data quickly and clearly.
- Maps diversification for affordable coverage.
- Express complex data simply and enhances understanding and comprehension.
- Zone rating and pricing.
- Understanding of patterns and trends over space and time.
- Improve risk analysis, evaluation, and mitigation.
- Summarized and interpretive conveying of statistical data
- Identify high- and low-performing areas for sales optimization.
- Analyze policy base to agent resources to create more effective sales territories.
- Performing better market analysis with spatial analysis and powerful decision-making insight.
- Visualize aggregated policyholder data at the district level and areas of high total insured value, they see locations of potential significant losses.
- Getting professional work of captivating maps, reports and interactive web portal which distinguish you from competition.
Software Requirement for insurance gis map tool app:
These are some software requirements for the implementation of the Insurance Management GIS Map Tool:
- Server: We can use any server for this Website tool but we prefer these two servers to be precise that we will be working on:
- NGINX Server – Nginx is an open source web server which can handle a website with a huge amount of traffic. It is a high performance web server developed with an intention to handle websites with large number of users. Its speciality is that it can run on a minimal amount of resources and handle a large number of requests.
- Digital Ocean Server – Digital ocean server or ‘droplets’ is a cloud server which is designed to store and server massive amount of data while making it easy and cost effective. Digital ocean server use KVM as hyperviser and can be created in various sizes. It helps in build deploy and scale cloud application faster and more efficient
We personally recommend using Digital Ocean Server, as it is much faster, easy and cost efficient.
- Leaflet: With leaflet you can compute the features bounding box, create a layer group, remove or add as many marker or different layer as you want on a map. Adding vector layers, raster layers, adding wms or wfs layer (can be used to serve and render geoserver or map server layers), selecting and hovering over lat-long are some of the functionality which can be easily grabbed by leaflet js map library.
- Database: We will be using this database for storing the Insurance Management GIS Map
data :
- PostGIS/PostGreSQL : PostGIS is an open source software. It adds support for geographic objects to the PostgreSQL database. PostGIS follows the simple features for SQL specification from the Open Geospatial Consortium (OGC).
- Mapping Systems: This is the main software component of the Insurance Management GIS Map Tool. This whole system is dependent on the web mapping of the data. For mapping the data we can use any of these two Mapping systems.
- Google Maps: Google Maps is the tool which is used to display geographical information on a map which is in a widely accepted standard format for digital maps.
- OSM (Open Street Map): OSM is the software that creates and distributes the open source graphic data of the world. OSM has no restriction of technical or legal type. It allows free access to its map images and underlying map data. All the Insurance Management data locations can be found here with the nearby entities as well.
Features of Insurance Management GIS Web/App:
Easy data uploading in gis tool :
We are providing a direct interface for uploading the spatial data to generate the interactive maps. You can just upload the Policyholders locations or any disaster spatial data into the database which will present the infographic representation of the data i.e. maps. You can upload any type of data and if you have data in spreadsheet you can open our other tool IgisMap Converter and convert your data into the spatial data format and then upload it.
Generating Maps and Reports from insurance app :
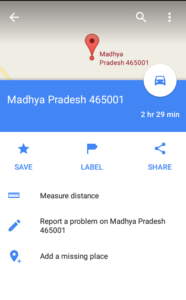
New maps can be generated from the maps that were customized or edited in whatever way the you wants them to be. Company can style the map according to their wishes or the client. In styling the color, popup details, markers can be changed or customized and altogether generates a new Map. Specific areas of City/County/colony can be filtered with the help of Polygon and then the Insurance Management data will be presented. You also can generate and download the pdf file or spreadsheet document data of newly generated maps representing all the data of Insurance or Disaster Management. Doing so will ensure that your teams and their clients have the most accurate and timely data in their hands.
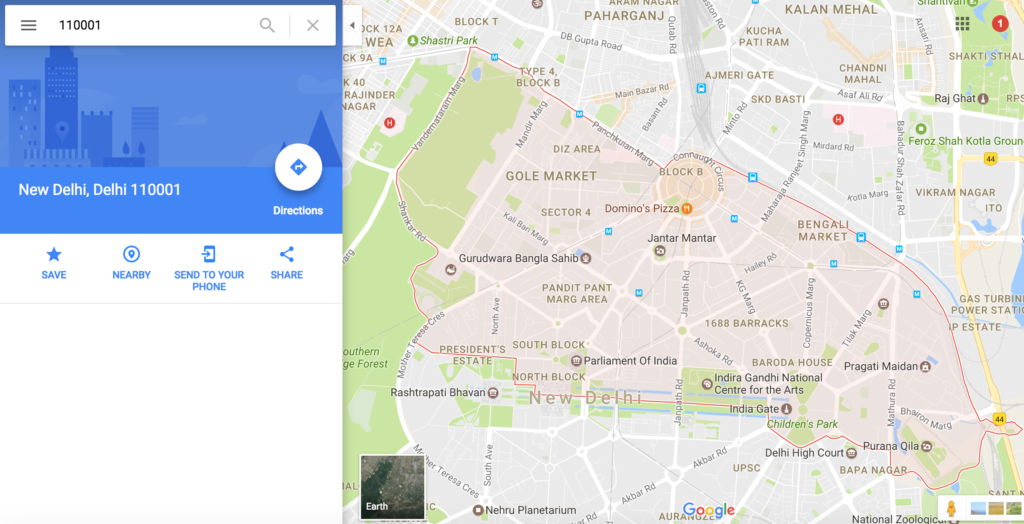
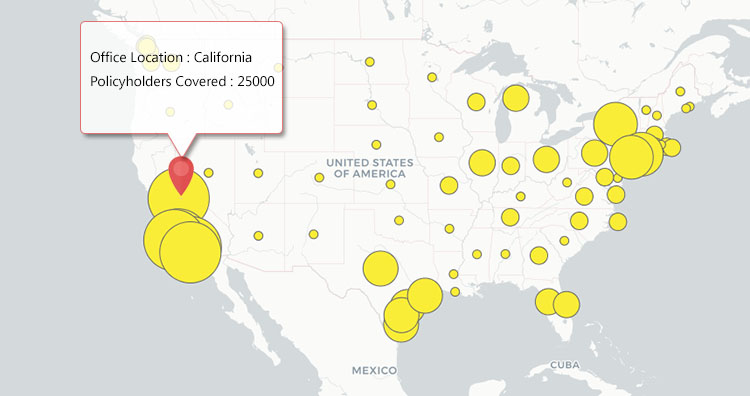
Proximity Analysis from insurance management app:
Companies can use proximity analysis to compare and determine the relationship between selected office and the area covered by policyholders near it. Proximity analysis gives the company, the ability to more easily showcase the total no. of policyholders in the area, their premium related descriptions and advantages with risk analysis to its location. You can visualize aggregated policyholder data at the district level and areas of high total insured value and see locations of potential significant losses. You can visualize aggregated policyholder data at the district level and areas of high total insured value and see locations of potential significant losses. You can shift your strategy to provide new, compelling, and original information to your policyholders which can pay off in many ways. Analytics reports can be generated in any format and you can download it to use it further. Proximity analysis is a crucial tool for business marketing and site selection.
Cost:
Contact us at our mail or put a comment below to discuss the expected cost.