In this guide, it will provide step by step of how the GeoJSON files can be easily and quickly converted to CSV format with the help of Converter Tool in MAPOG Map Analysis. So, both if you are a first-time user and a regular one, Converting GeoJSON to CSV with MAPOG, the entire process will be explained in simple steps for you.

Key Concept to Converting files
Converter Tool is a tool in the MAPOG Map Analysis used for the purpose of converting the information you have from one type to another. It’s like magic! You input data into it in one form, and you get it output in another form that you could use in your analysis. Moreover, GIS Data has a download in any format that means it is shift able in any kind of uses.
Online GeoJSON to CSV GIS Converter
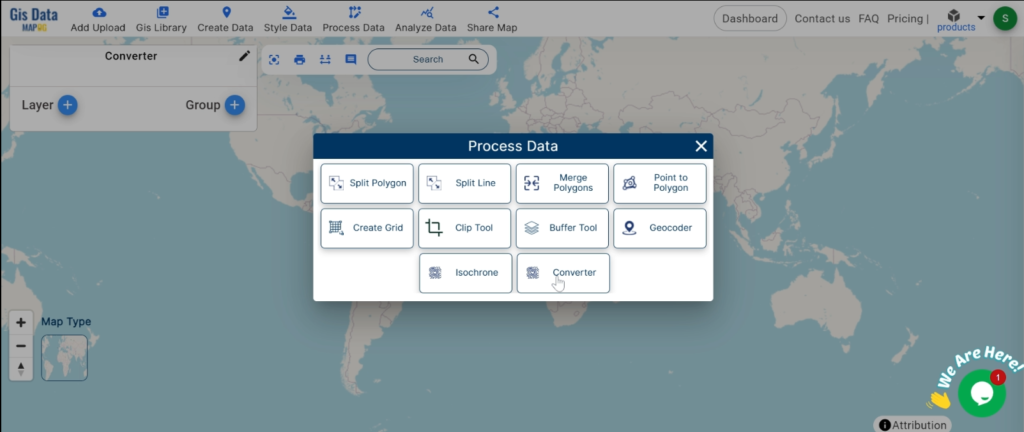
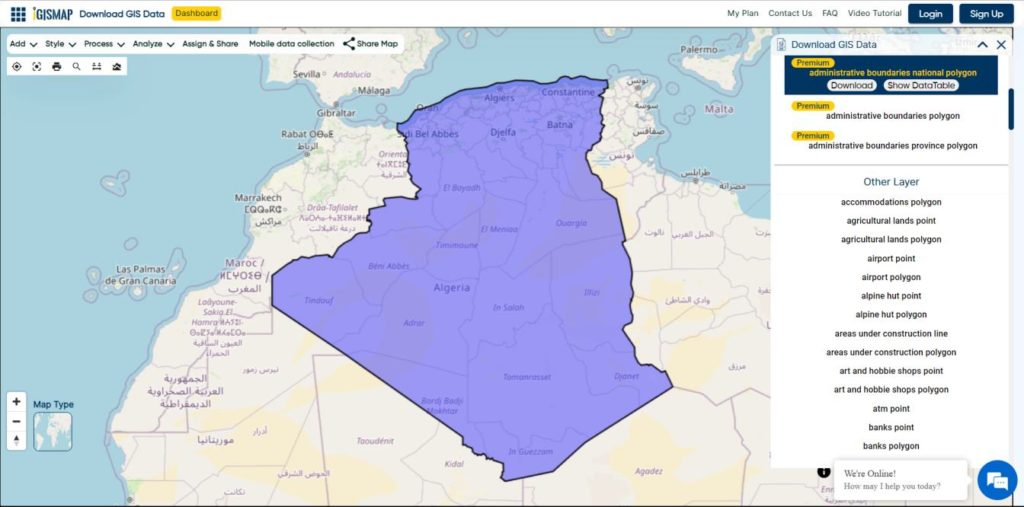
Step 1: Upload the Data
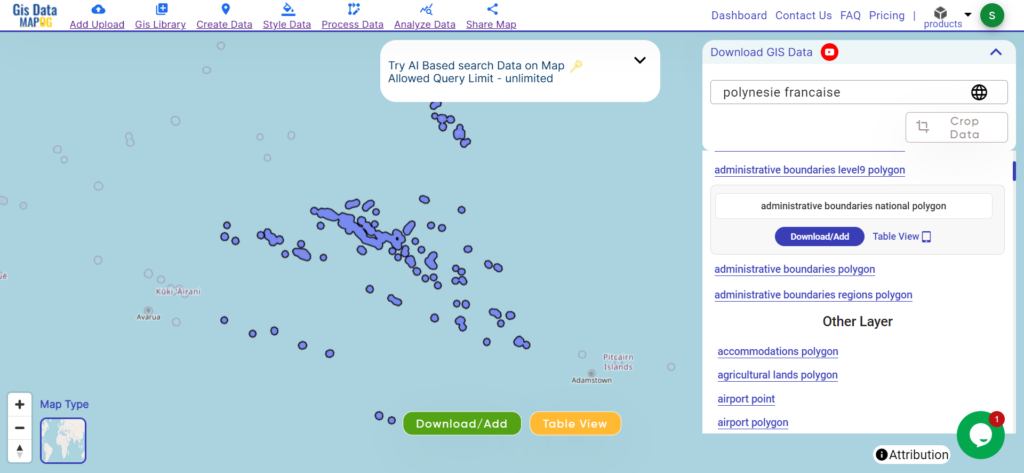
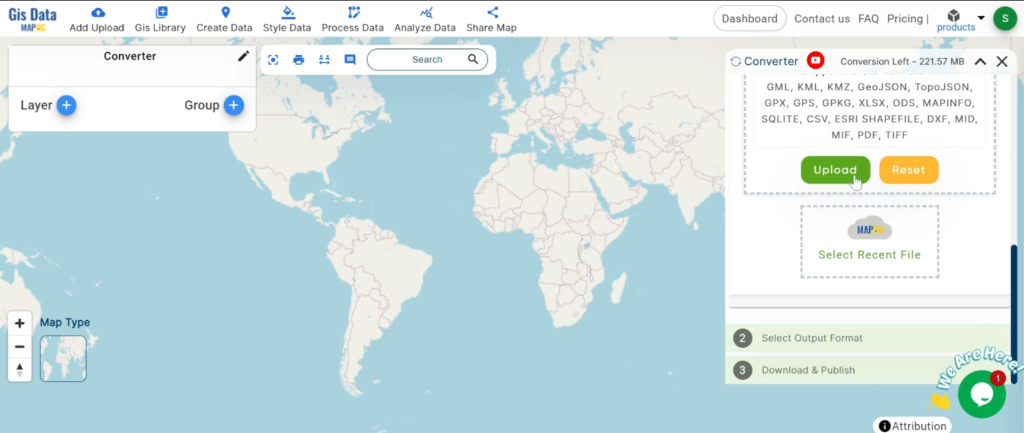
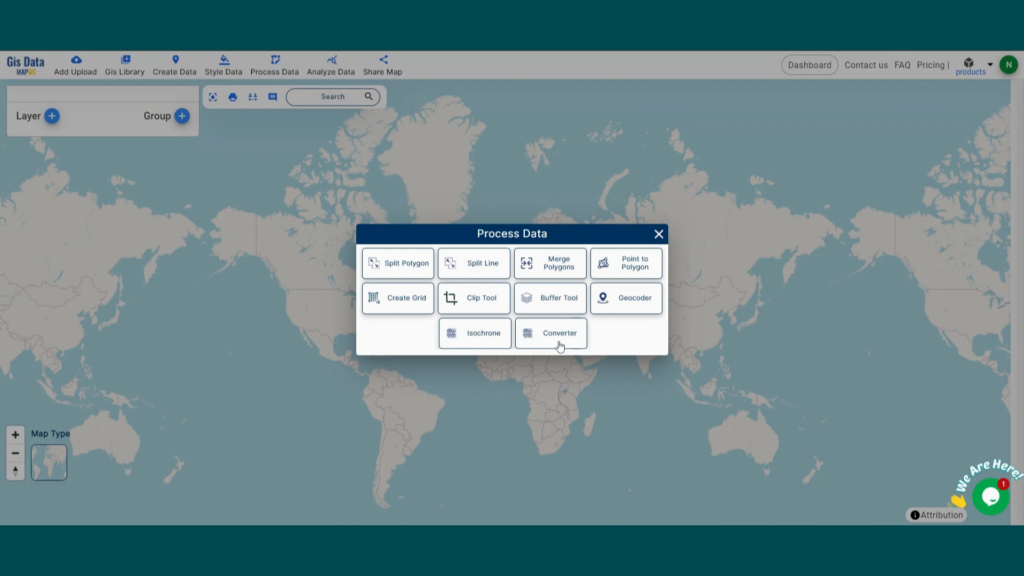
1. Select the data through the “Process Data” and go to the “Converter Tool”.

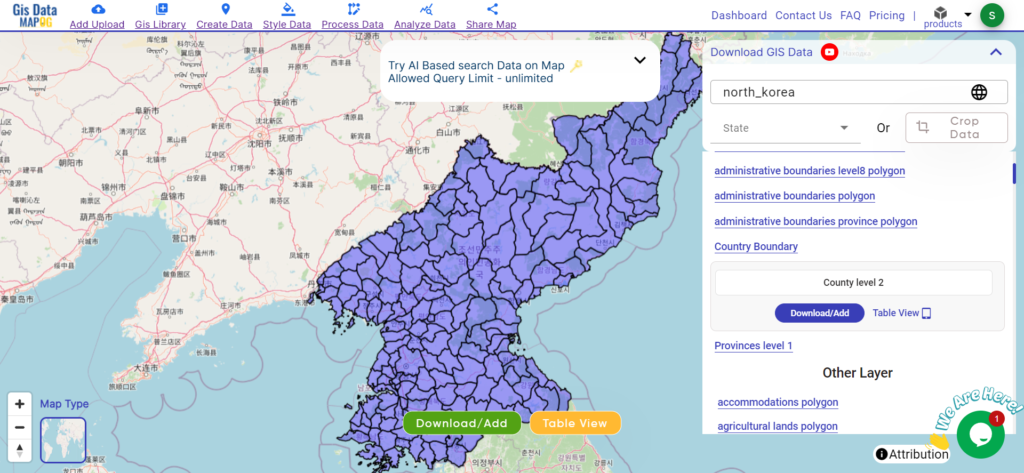
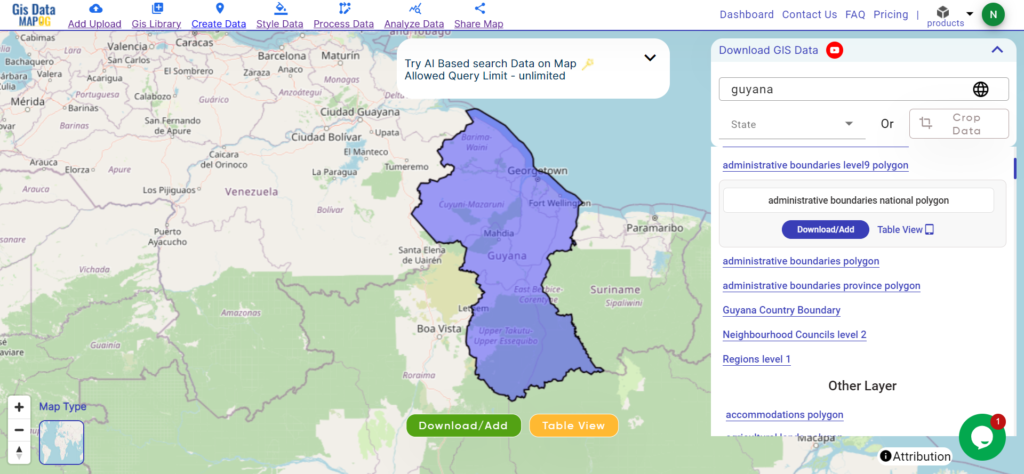
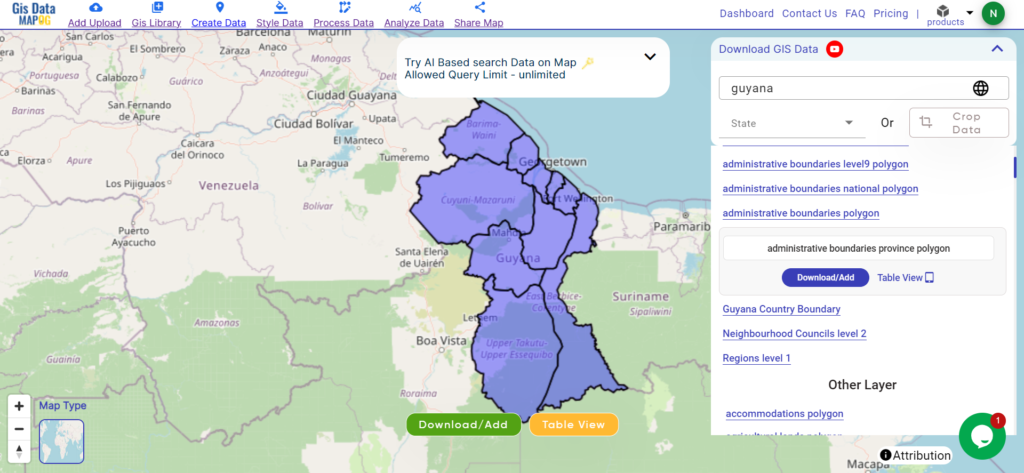
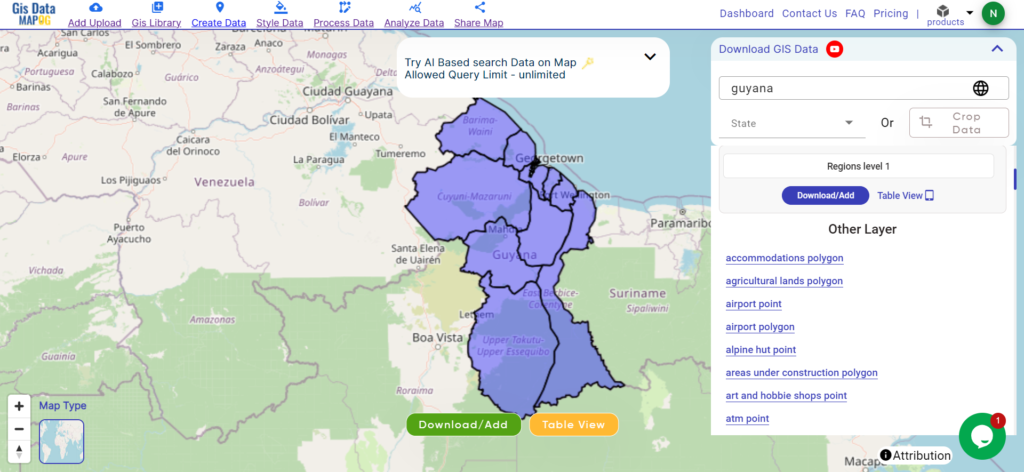
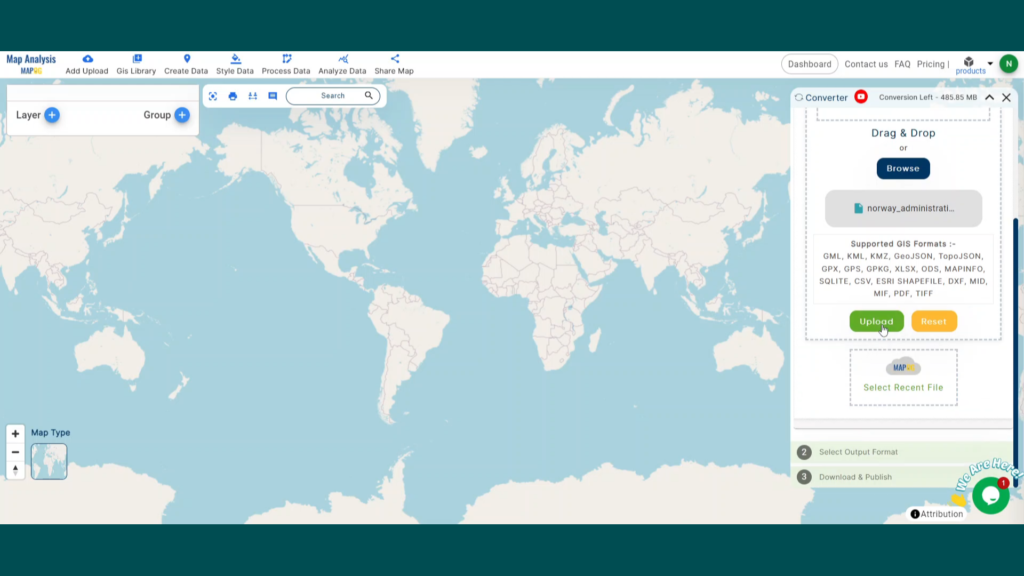
2. Upload your GeoJSON file. This is your entry point where you feed in the information that needs conversion.
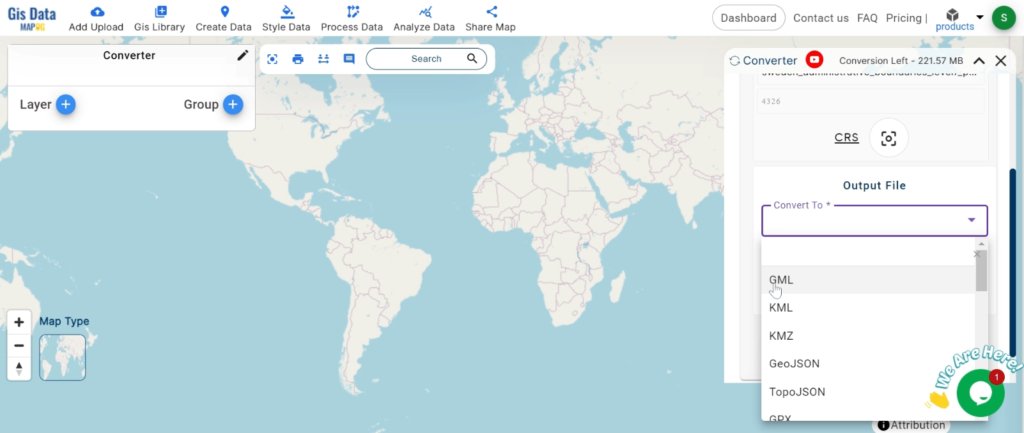
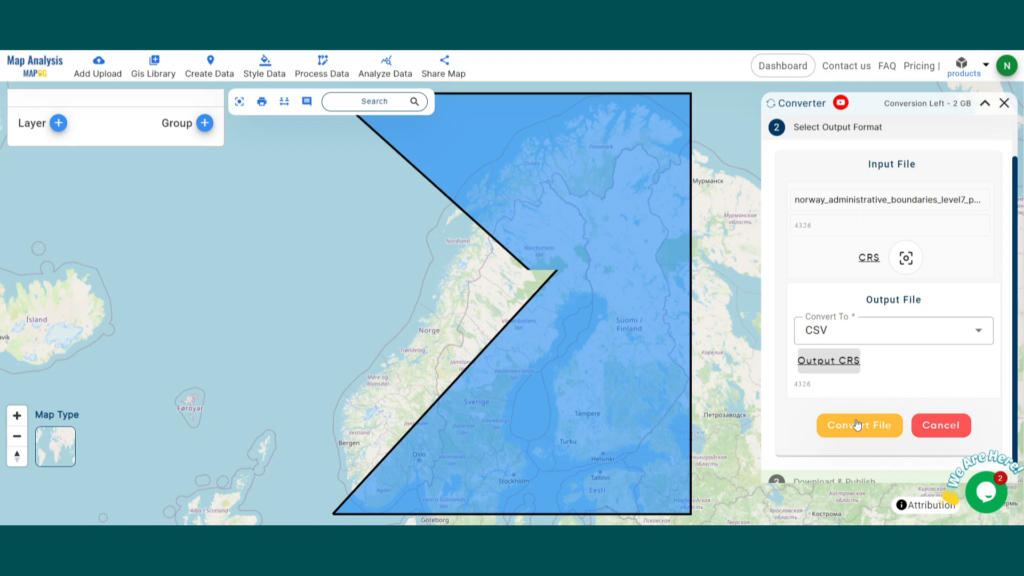
Step 2: Select the Format for Conversion
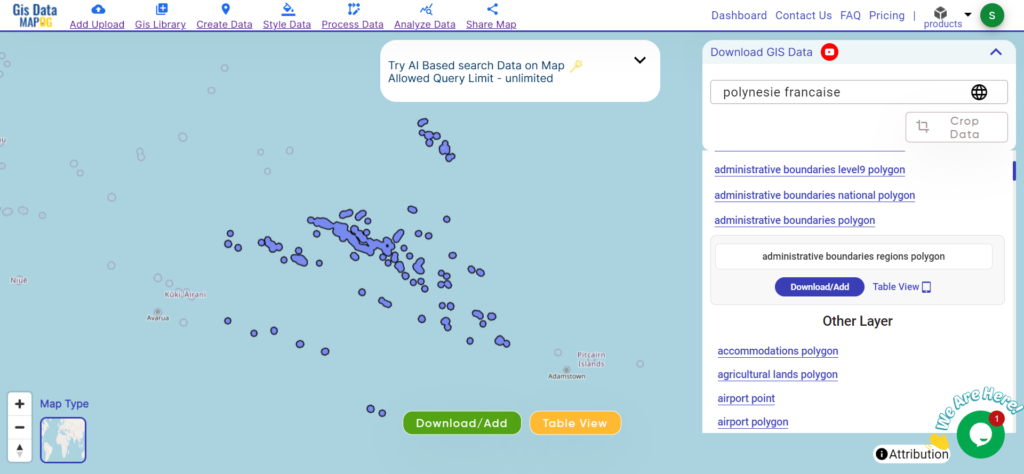
Select the output format as CSV or Comma-Separated Values if you want to expatriate only the data. The tool provides several options in arriving at the result but for this guide, we are using the option to convert the file to CSV.
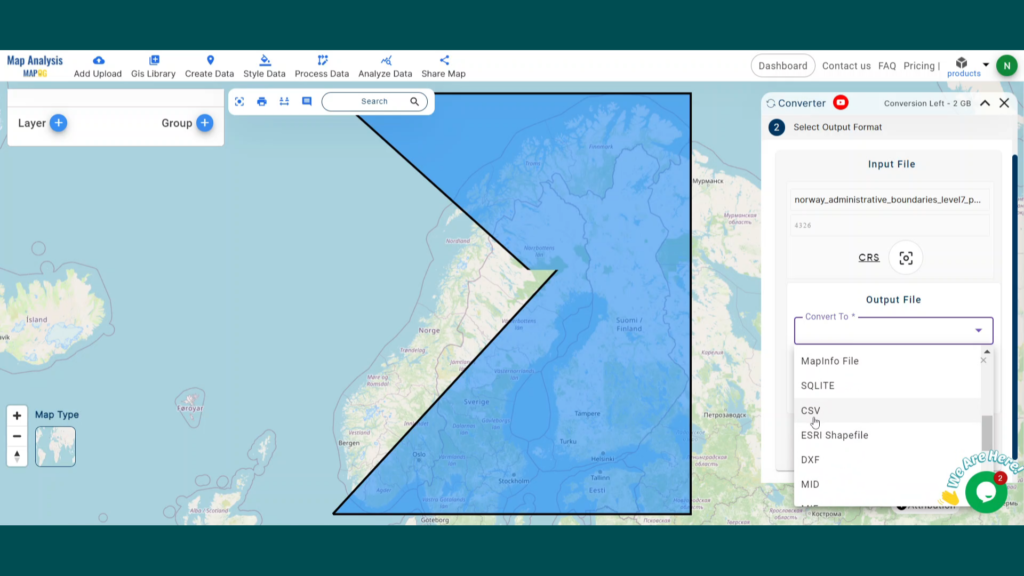
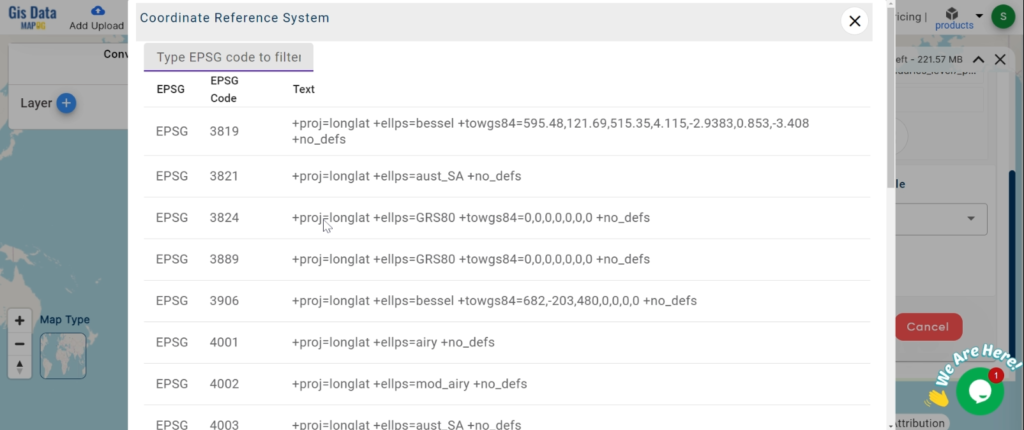
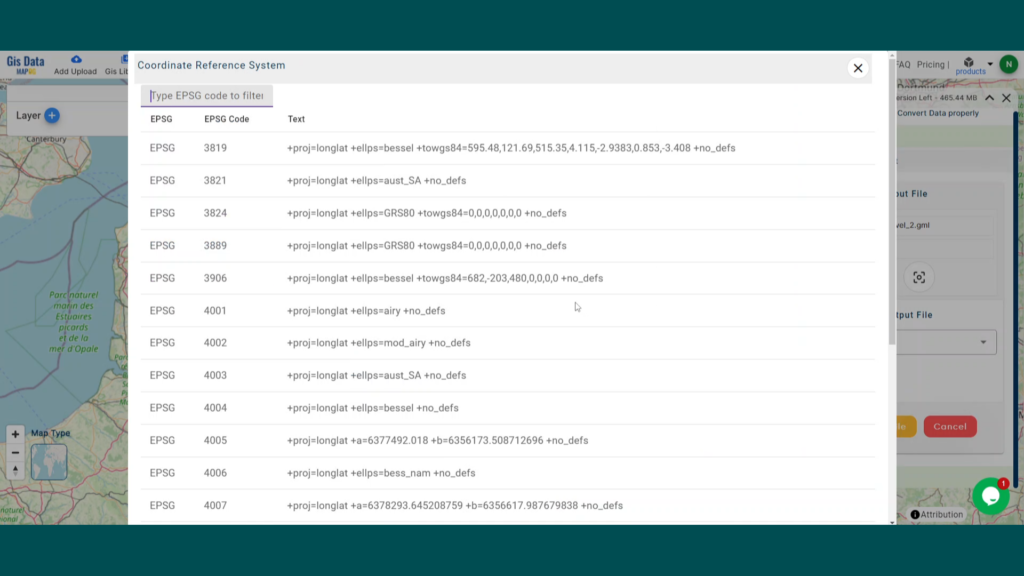
2. You can also set the Output CRS at this stage.
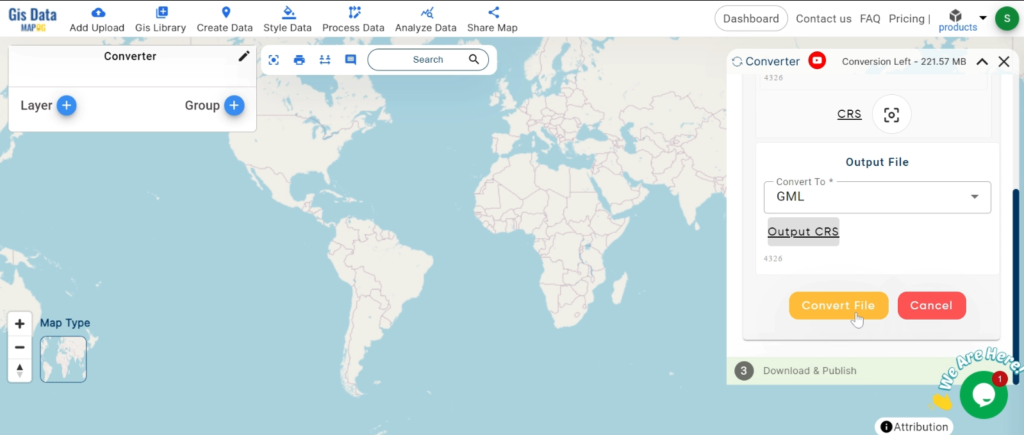
Step 3: Run the Conversion
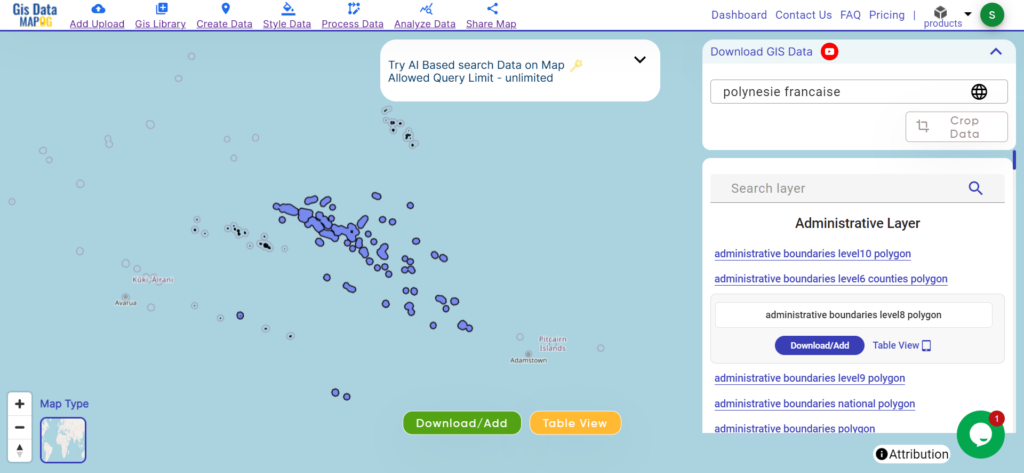
Go to ‘Convert Files’ and watch the tool at work. Working with the Converter Tool you input your data and then the tool converts it from the GeoJSON format to the CSV format.
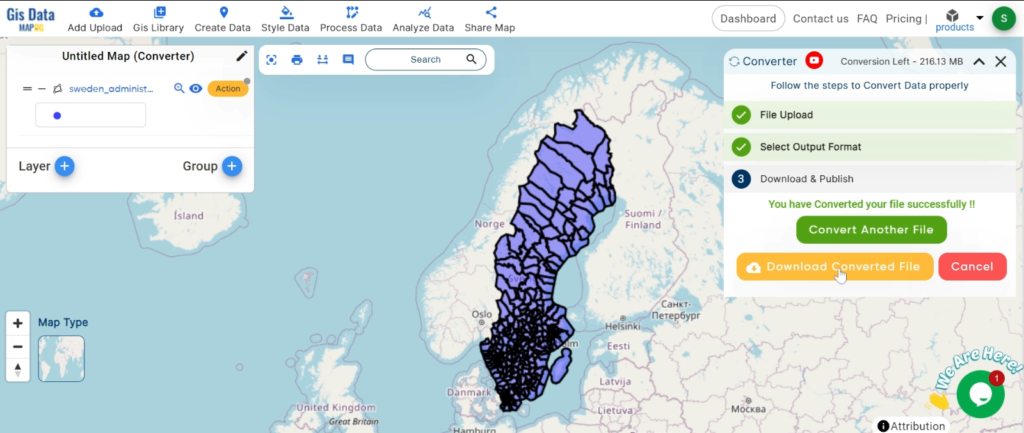
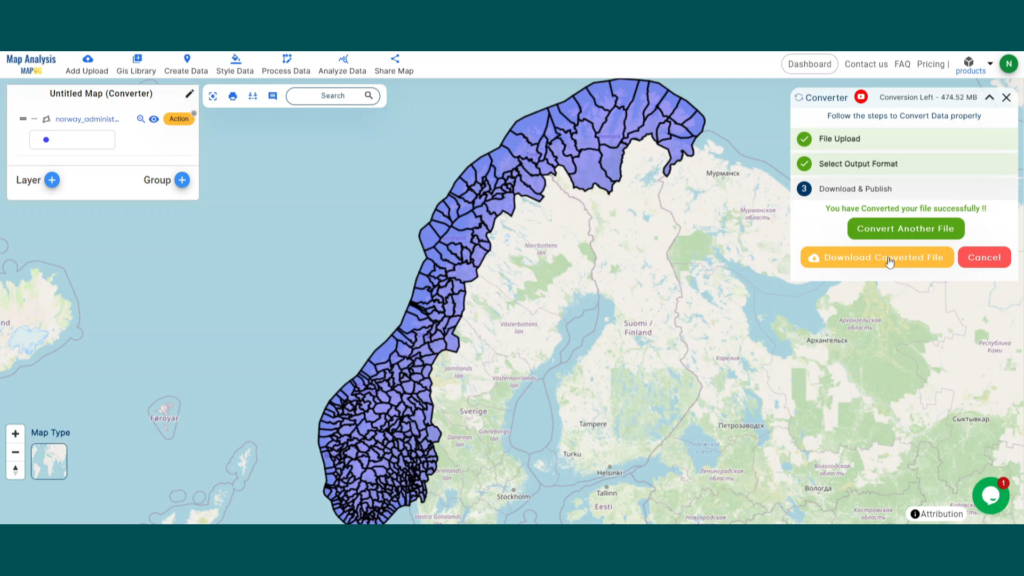
Step 4: Review and Download
Take a moment to review your converted CSV data to make sure everything looks correct. Once you’re happy with it, go ahead and download the file. This step is really important to ensure that the conversion worked properly and that all your data is intact.
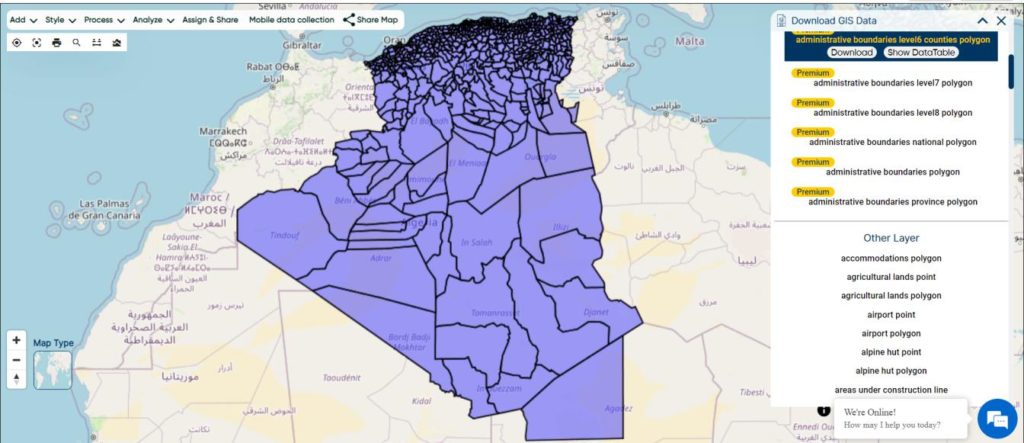
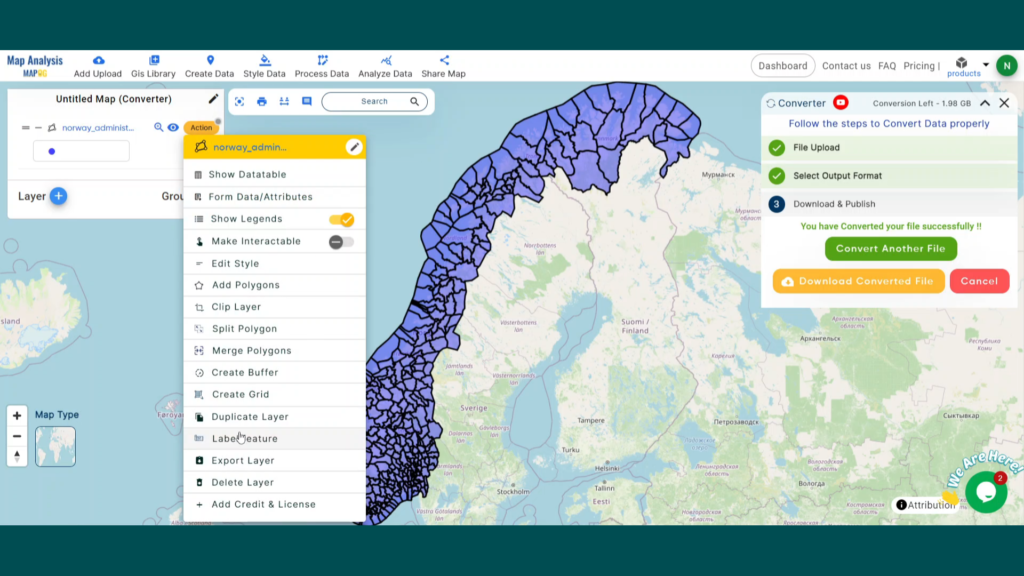
Step 5: Add Label Feature
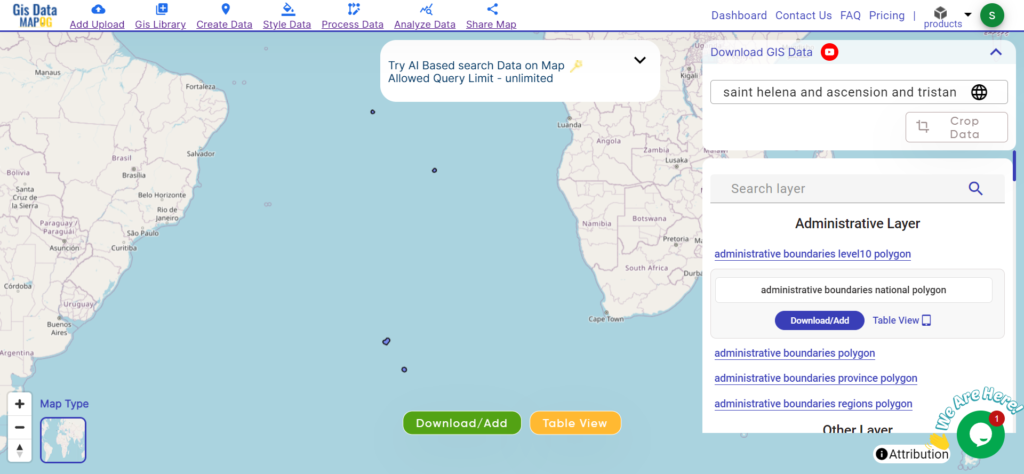
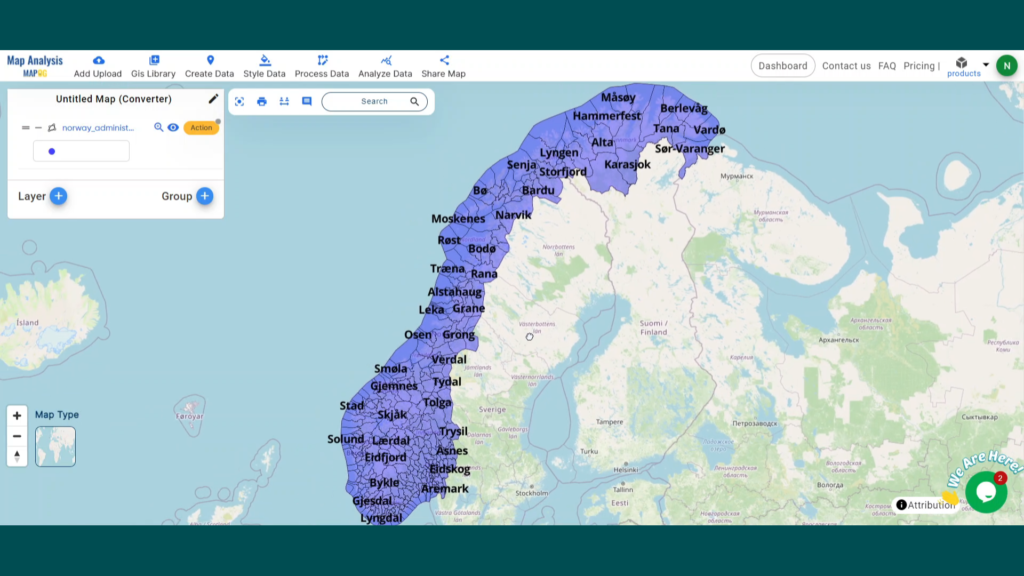
1. We can add the Lebel on this map using the Label Feature in the map analysis interface. First, We need to go to the action button of the newly converted layer. Then select the Label feature from the drop down section.
2. Next, we need to provide the newly converted file in layer selection and the desired attribute in the feature name section. Label feature has the option to select the font size and color. When you are happy with it, Click the save button.
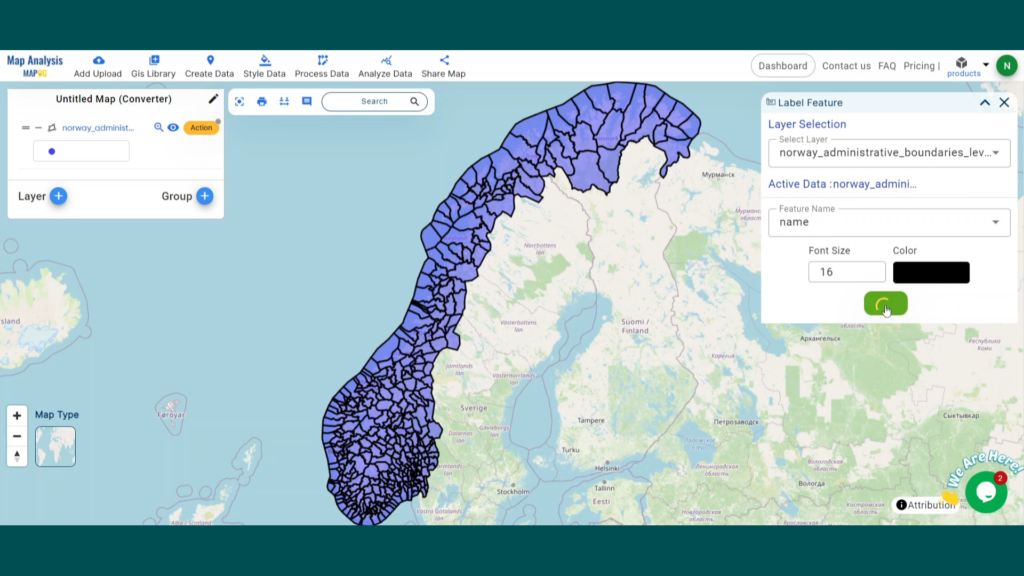
3. Now here you can see the newly converted data with all boundaries name mentioned into it.
That’s it! You’ve mastered the Converter Tool in MAPOG Map Analysis to turn your GeoJSON files into CSVs. Now, transforming your data is easier than ever, ready for any analysis you need. This handy feature streamlines dealing with various data formats, making your work smoother and more productive.
Here are some other blogs you might be interested in: