Looking to download golf courses data for mapping, planning, or recreational analysis? GIS Data by MAPOG offers a simple and efficient way to access detailed datasets of golf course locations worldwide. These data are available in a wide range of GIS formats—Shapefile, KML, GeoJSON, MID, and more—making them compatible with various geospatial tools. Whether you’re working on a tourism project, land-use planning, or environmental study, MAPOG provides curated and structured datasets that support accurate and insightful mapping.
How to Download Golf Courses Data
GIS Data by MAPOG streamlines the process through a user-friendly interface offering over 900+ layers across 200+ regions. Formats like SHP, KML, MID, CSV, DXF, GPX, SQL, and TOPOJSON are supported, allowing professionals to select the format that works best with their GIS environment.
Download Golf Courses Data of any countries
Note:
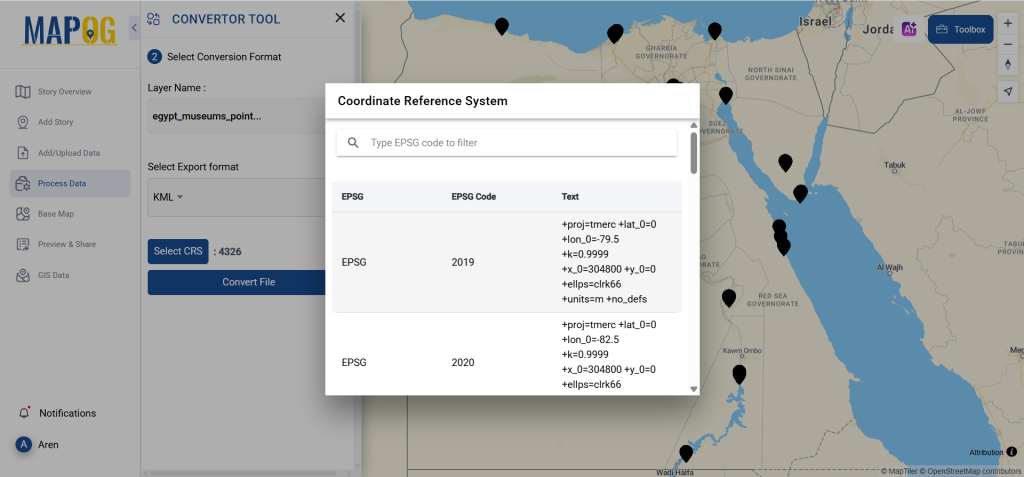
- All data is provided in GCS datum EPSG:4326 WGS84 CRS (Coordinate Reference System).
- Users need to log in to access and download their preferred data formats.
Step-by-Step Guide to Download Golf Courses Data
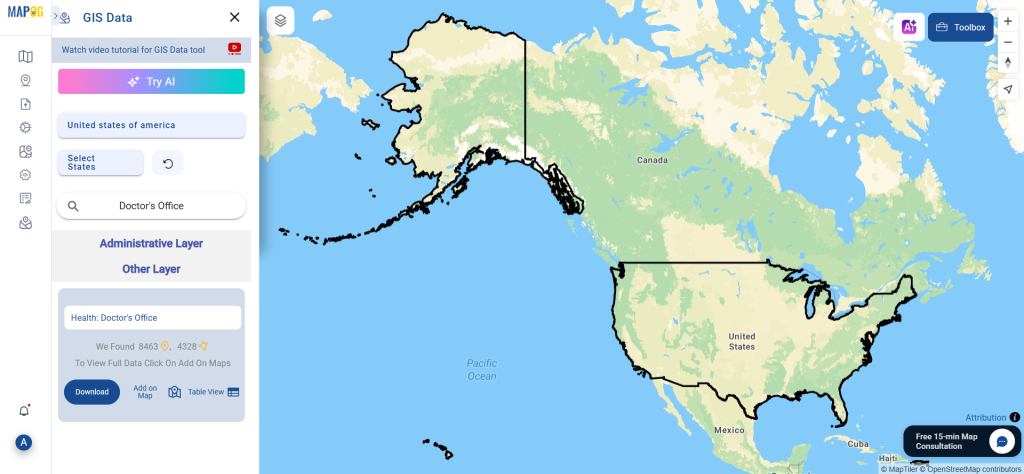
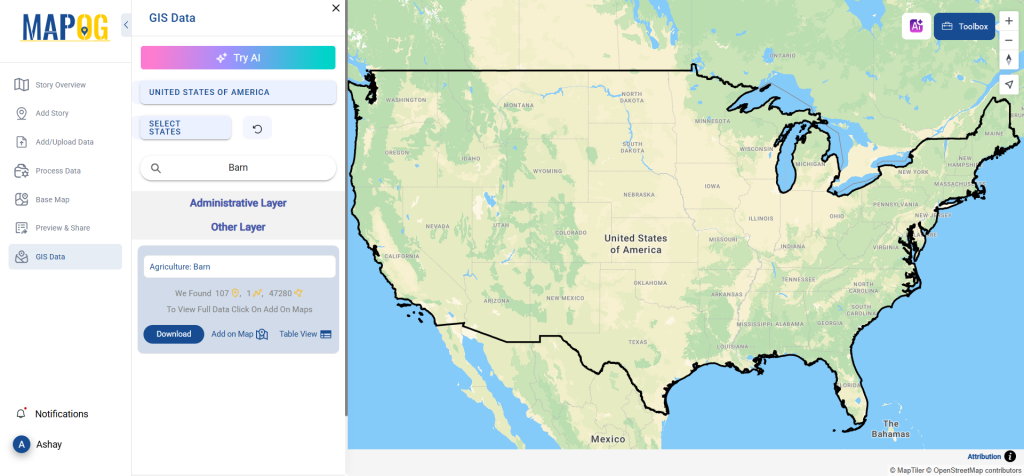
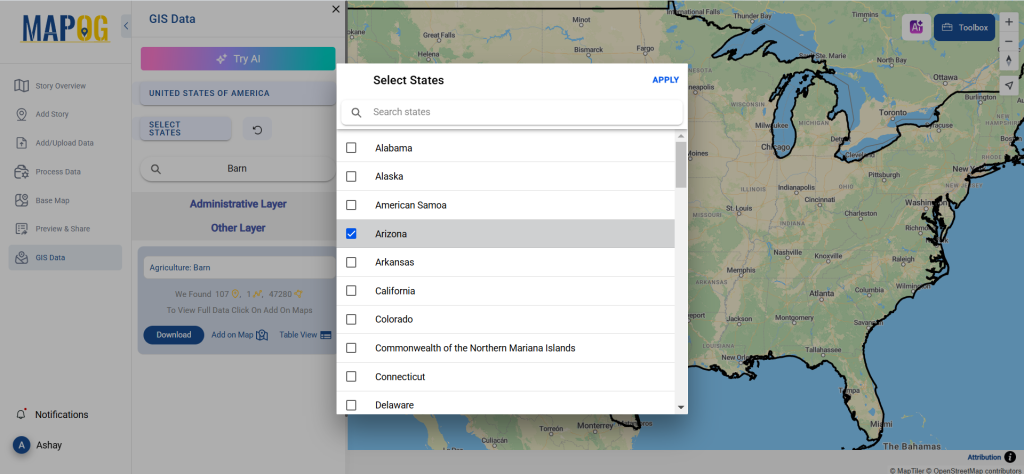
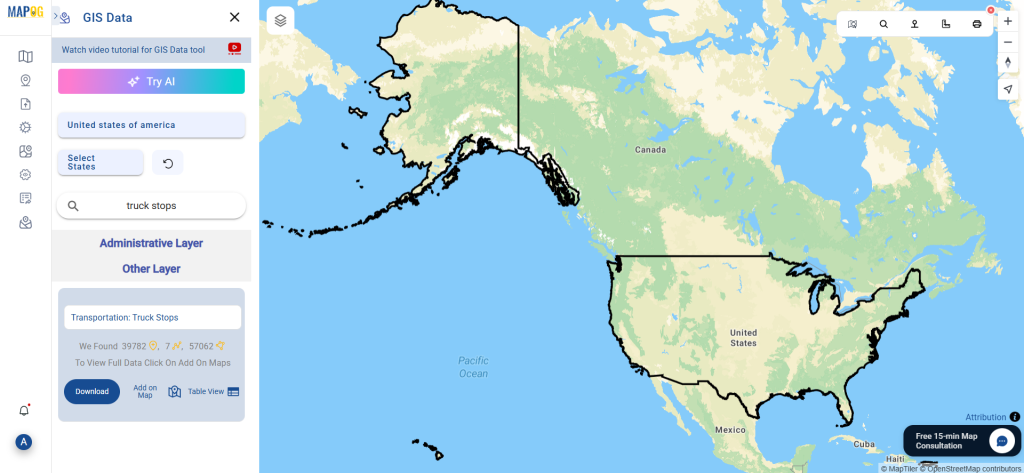
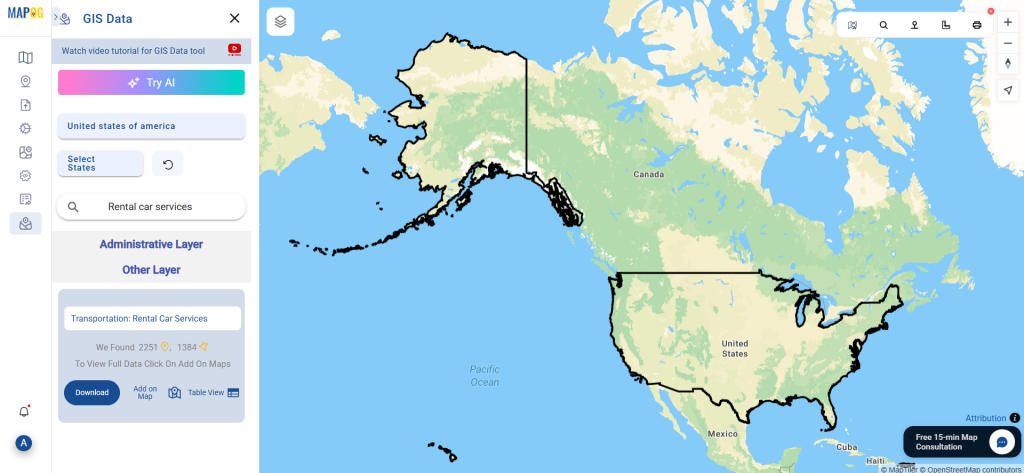
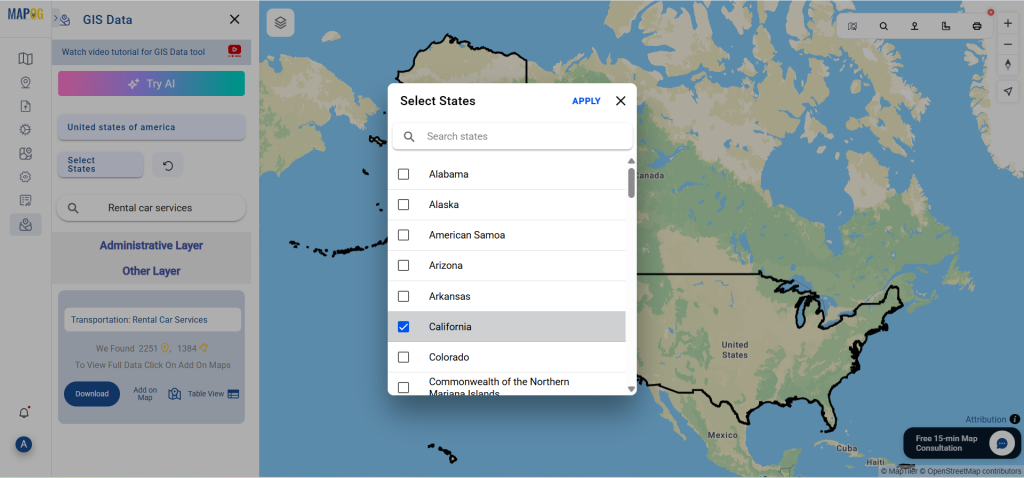
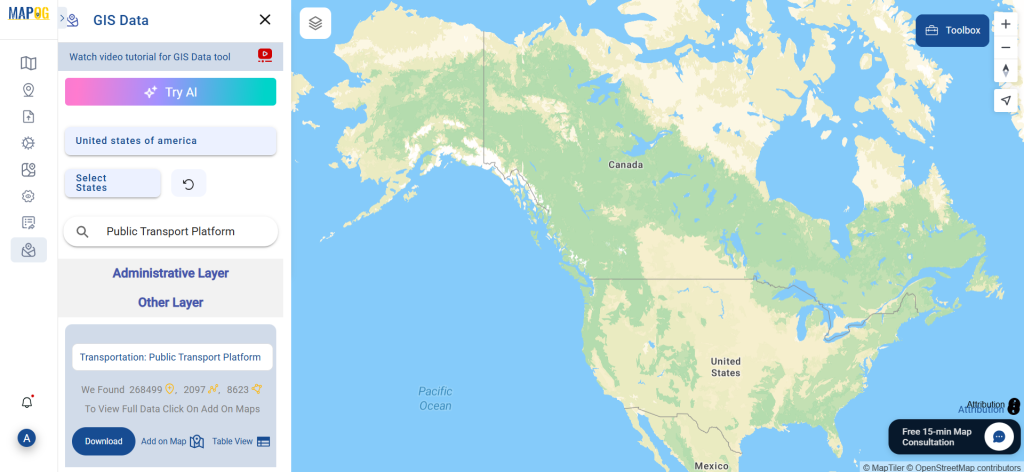
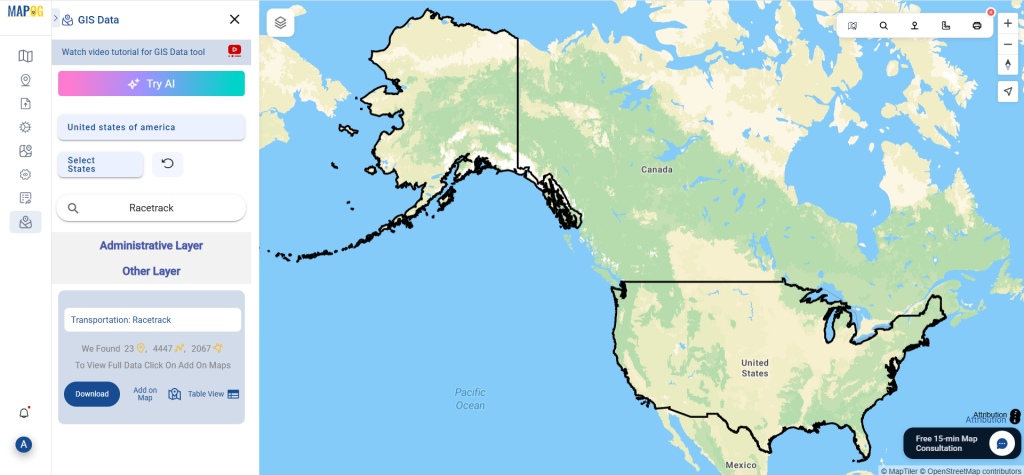
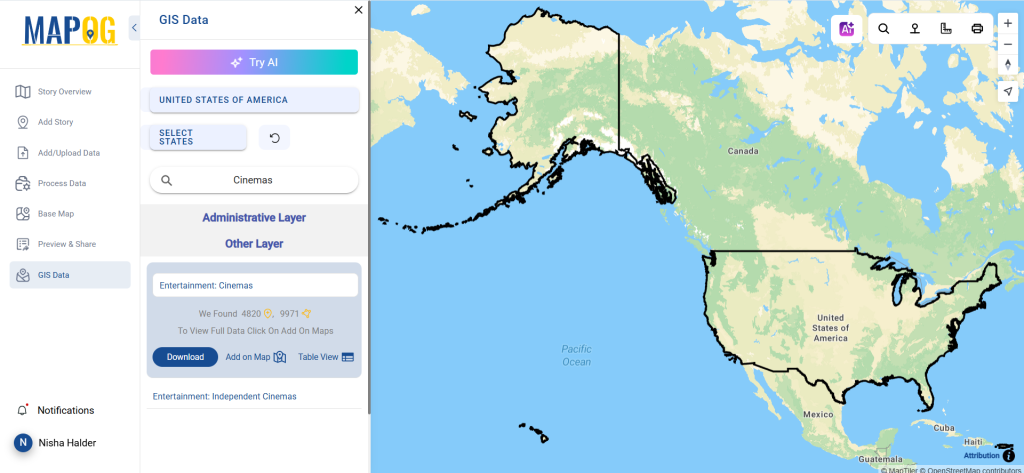
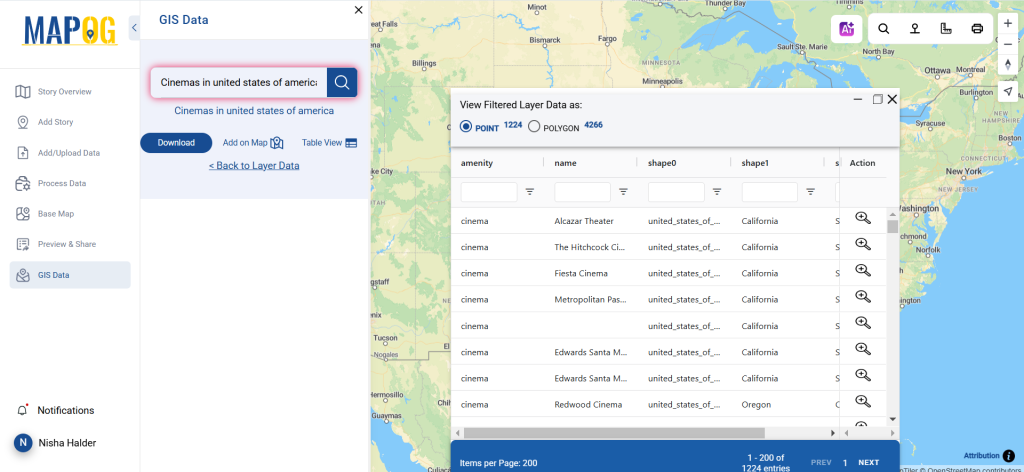
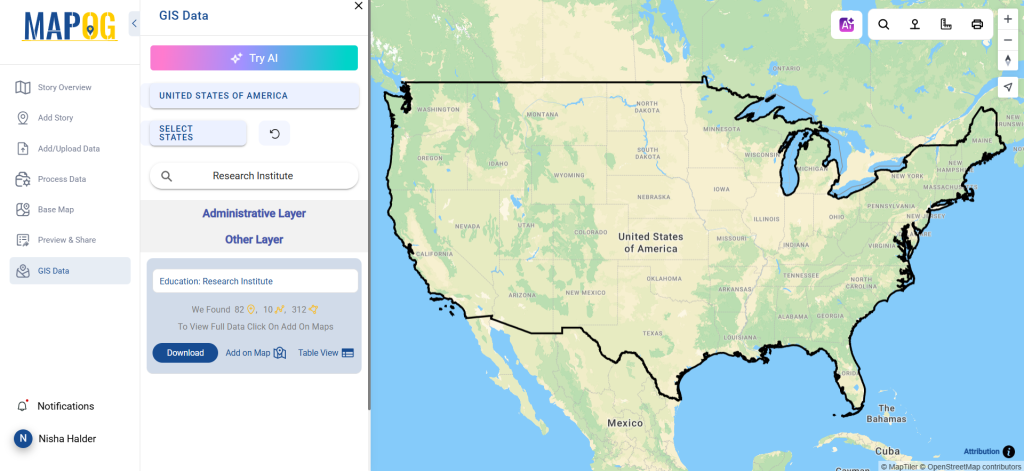
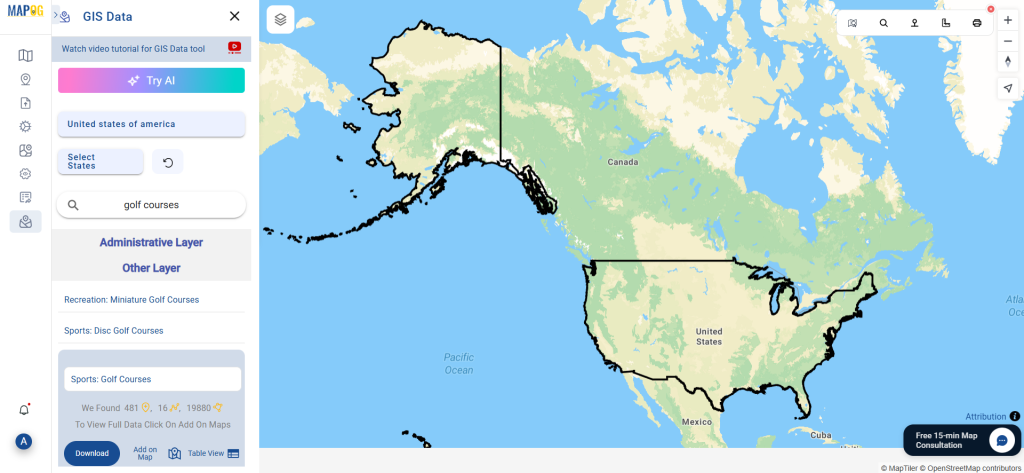
Step 1: Search for Golf Courses Data
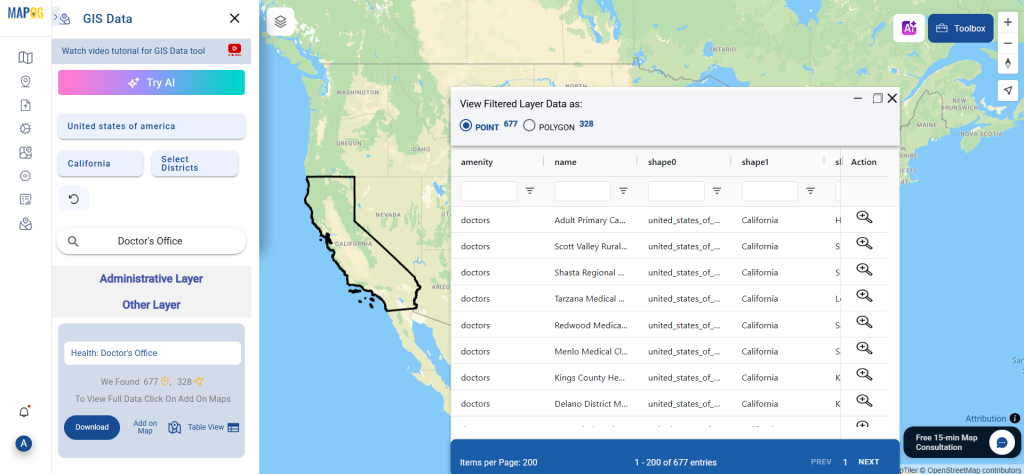
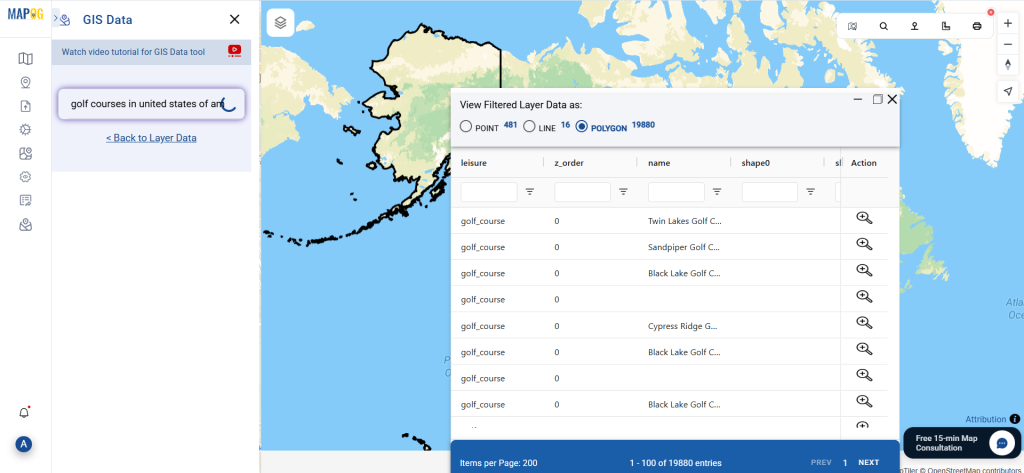
Start by entering “Golf Courses Data” into the search layer box. You can also select your desired region or area of interest. MAPOG will display whether the data is point-based (location pins) or polygon-based (area outlines).

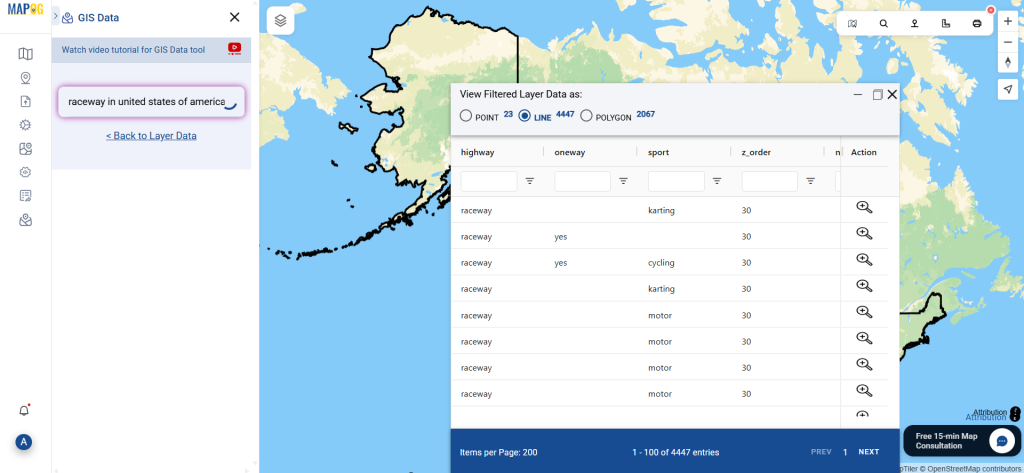
Step 2: Use the AI Search Tool
Accelerate your search using MAPOG’s built-in AI assistant. Just type phrases like “golf courses near area” or “golf facilities data,” and the AI will return the most relevant results—quickly and accurately.
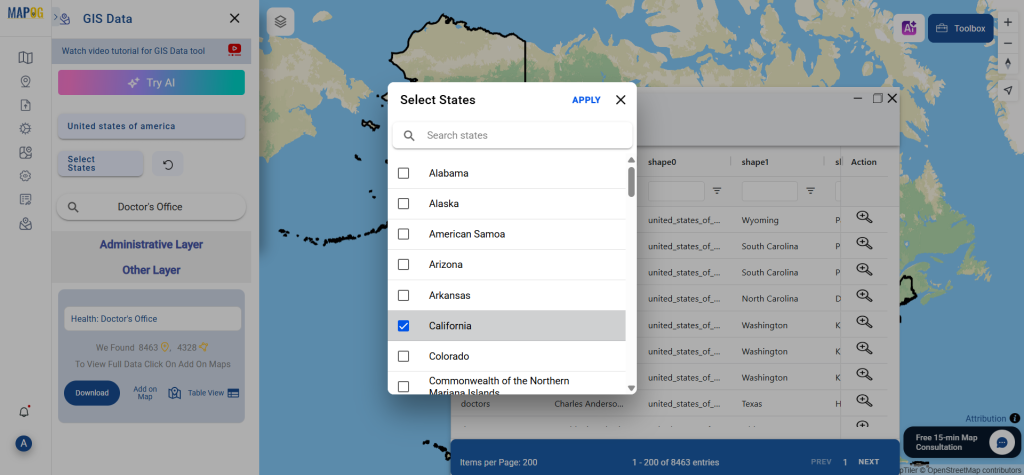
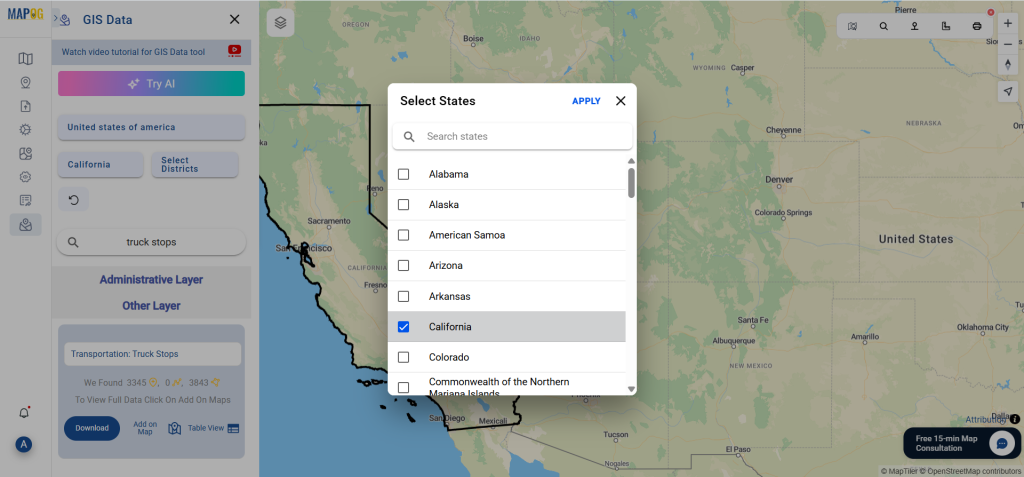
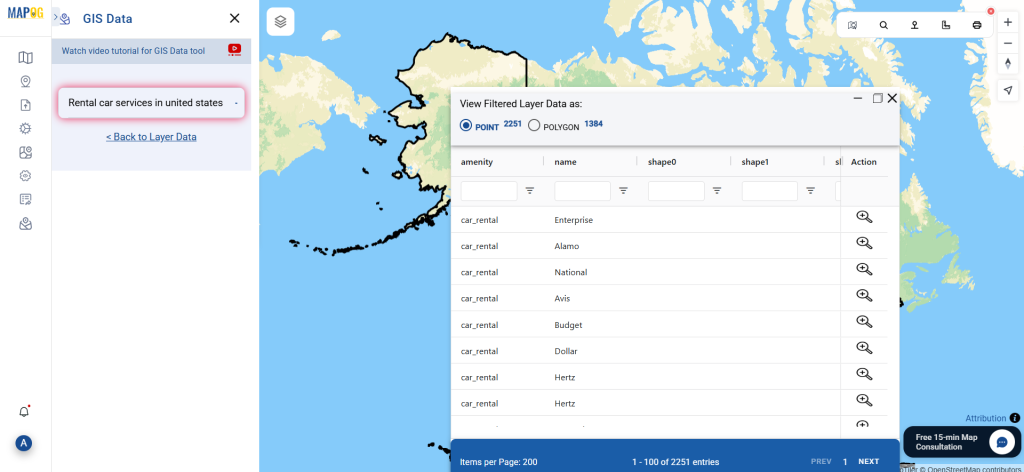
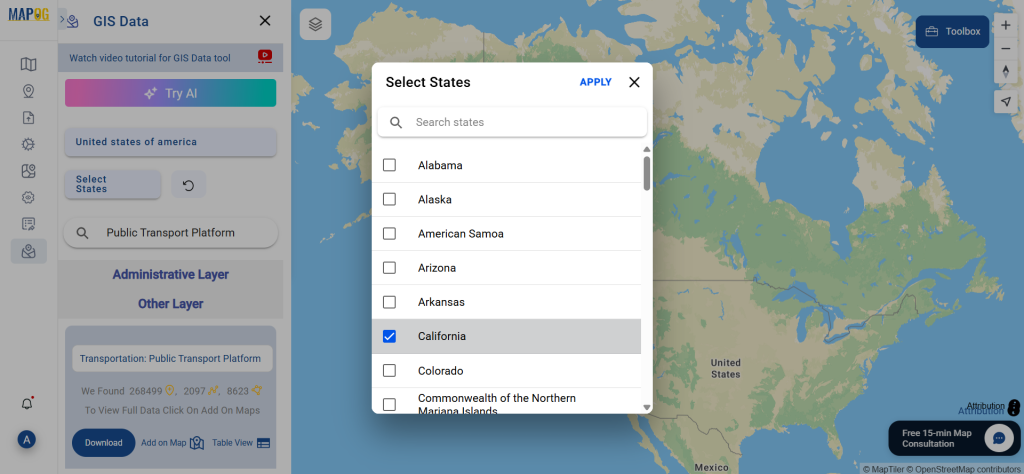
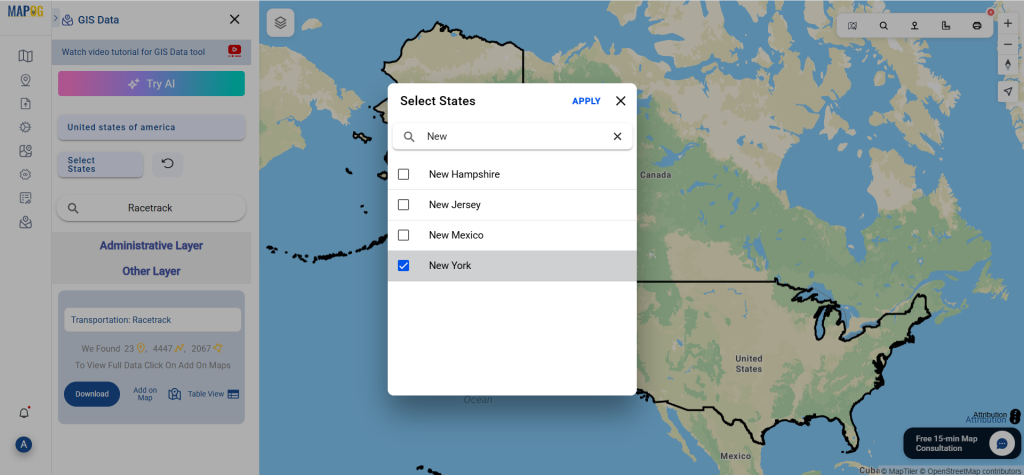
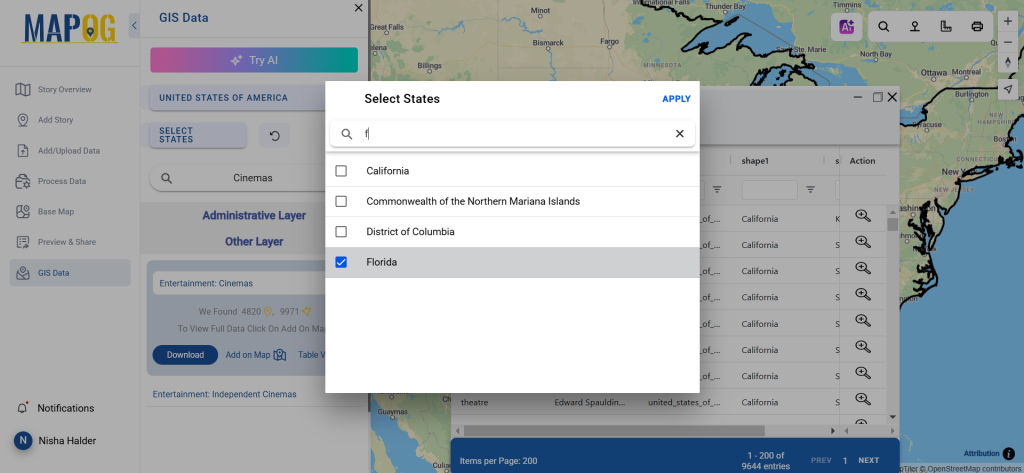
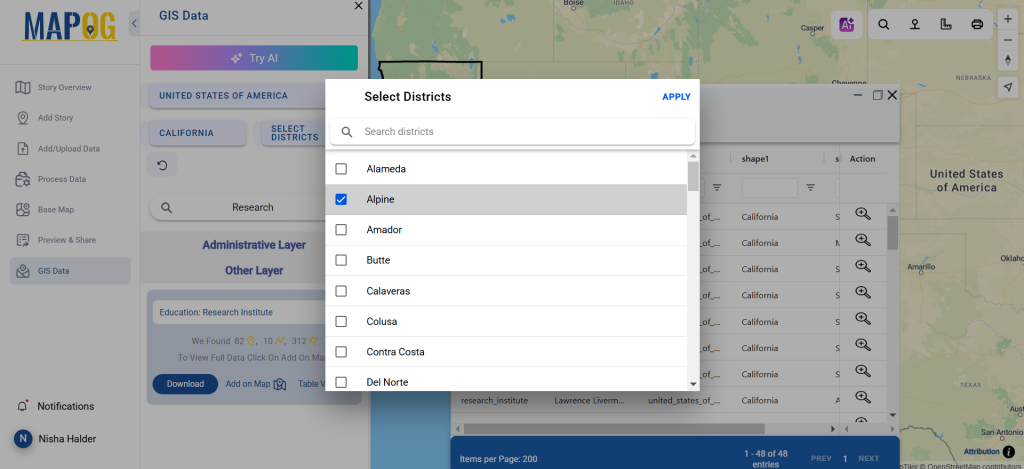
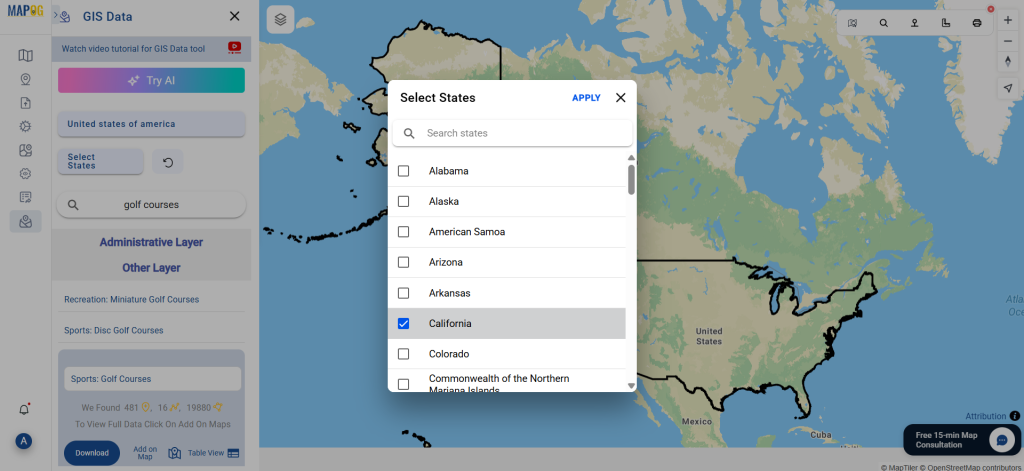
Step 3: Filter Your Data
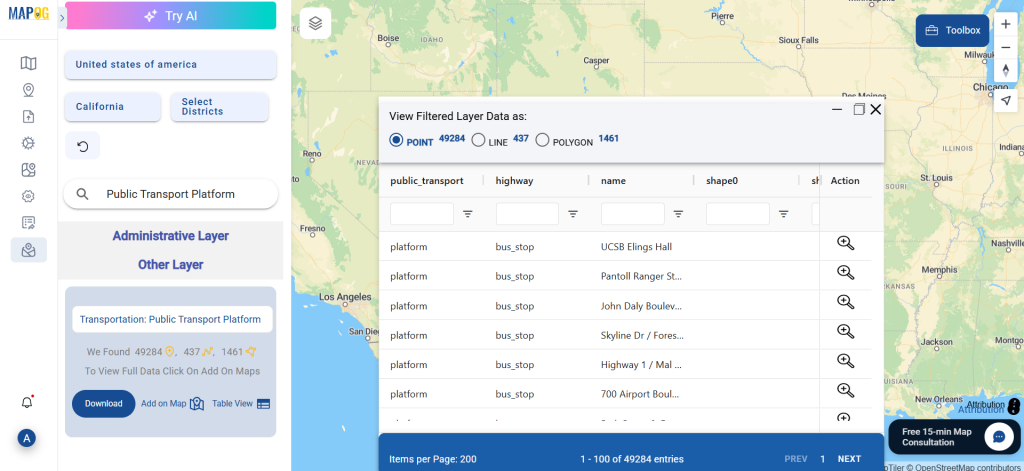
Use the Filter Data option to narrow your search based on district or state. This is especially useful when working with country-level datasets and needing granular insights at regional or local levels.

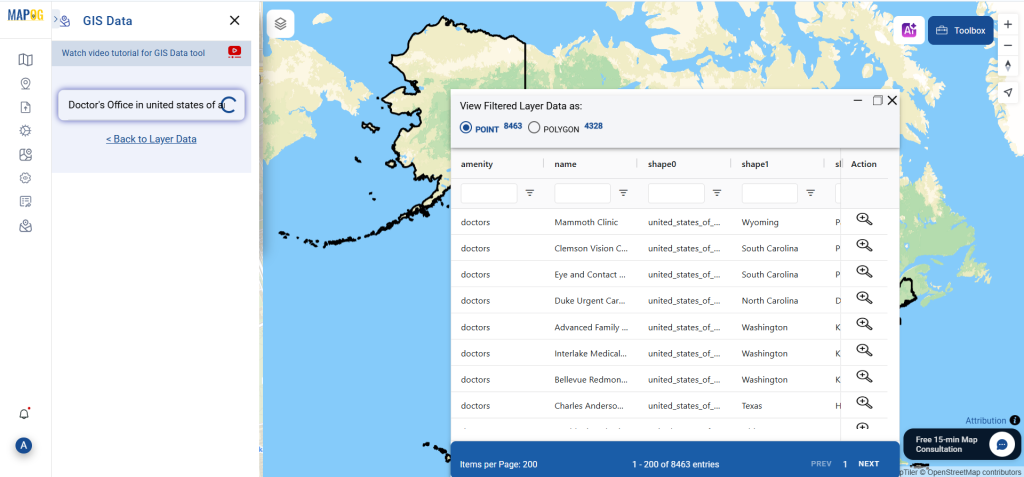
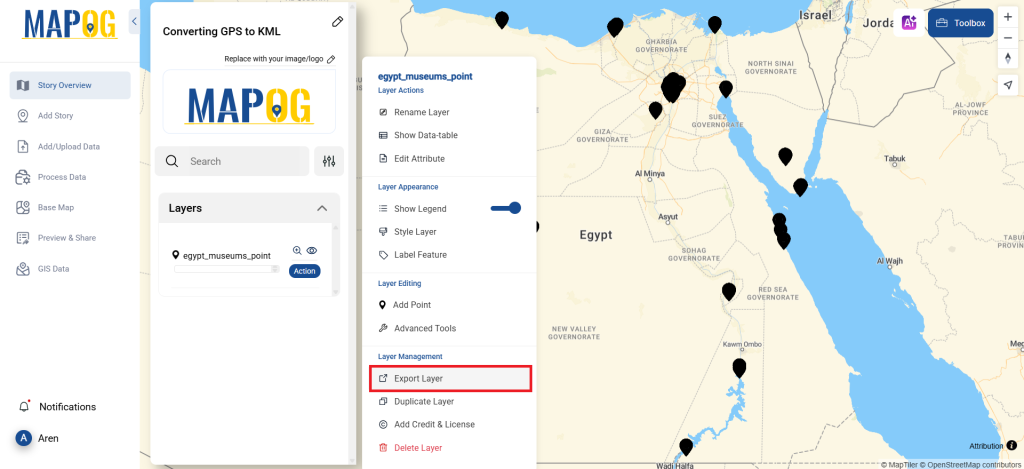
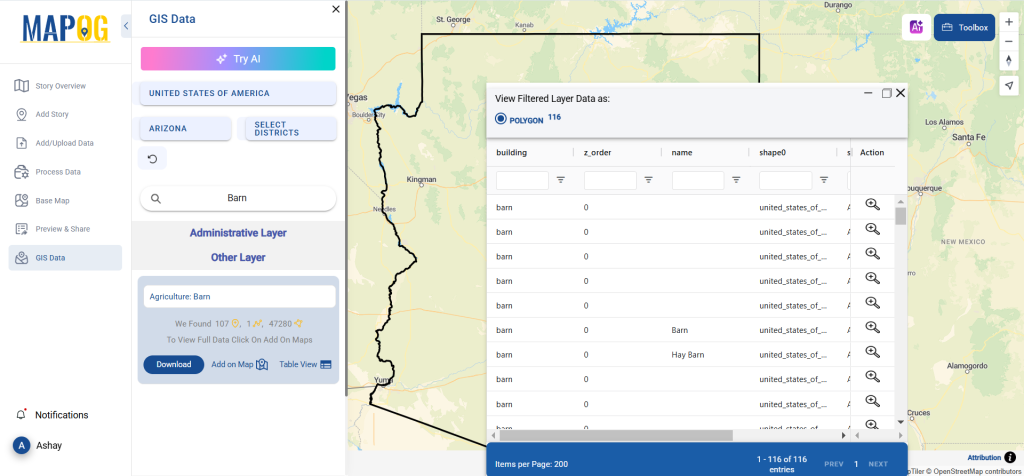
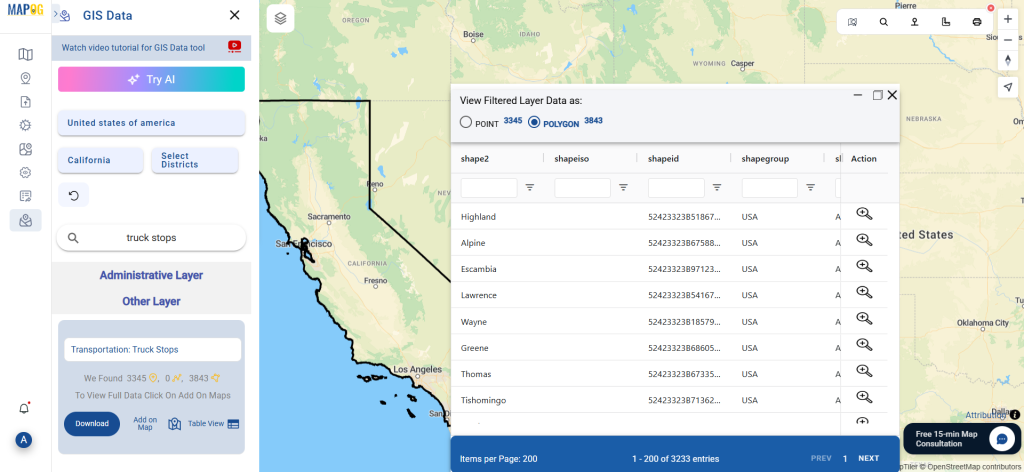
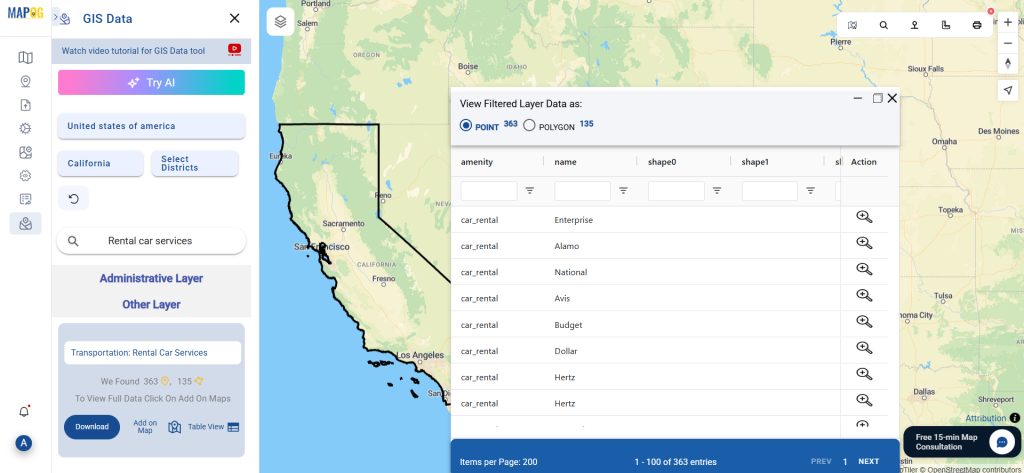
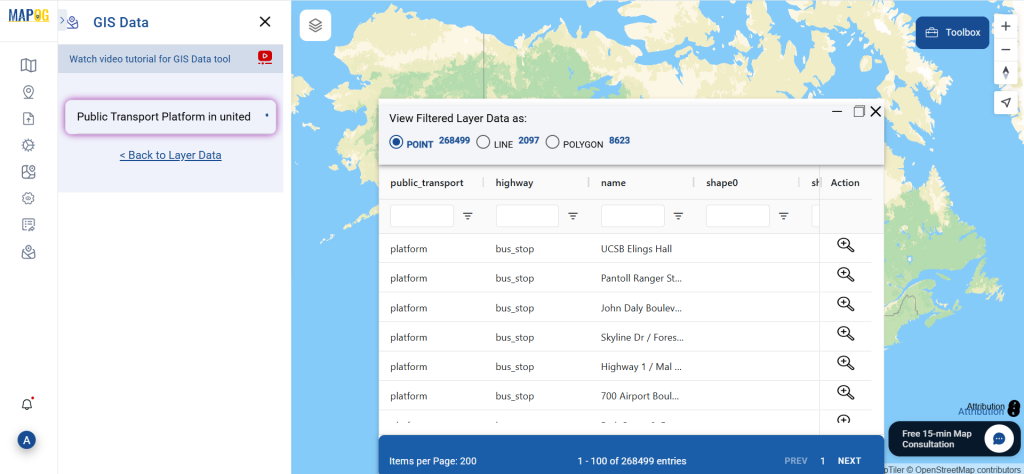
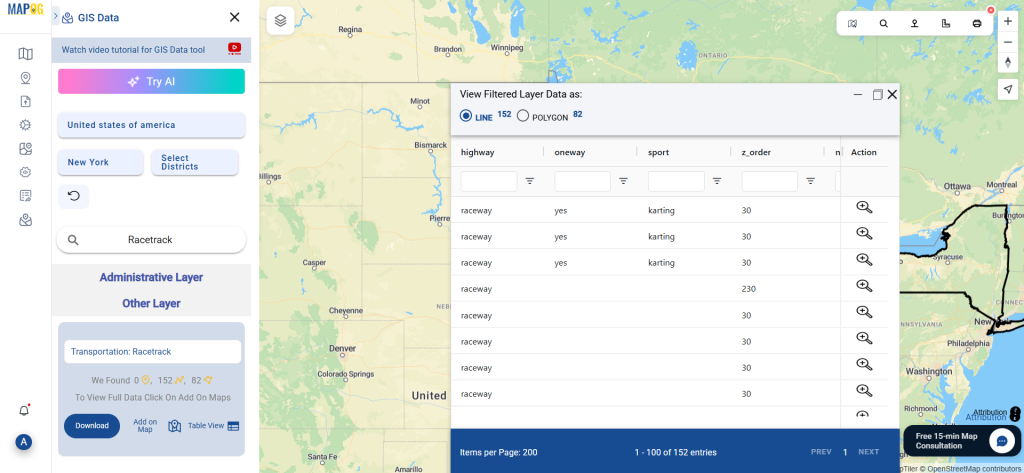
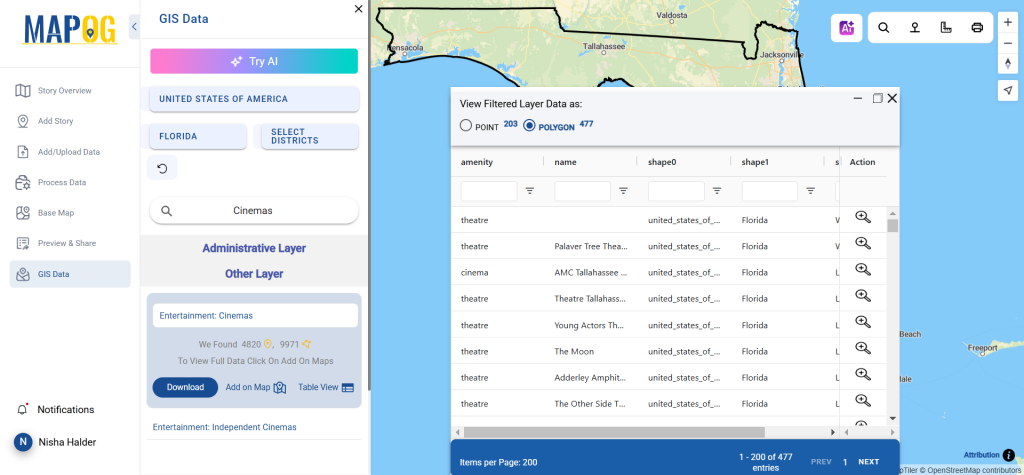
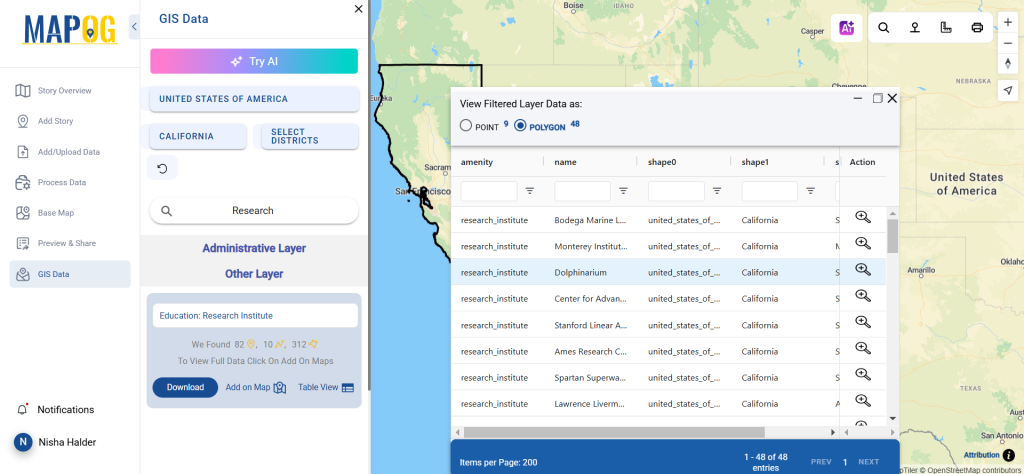
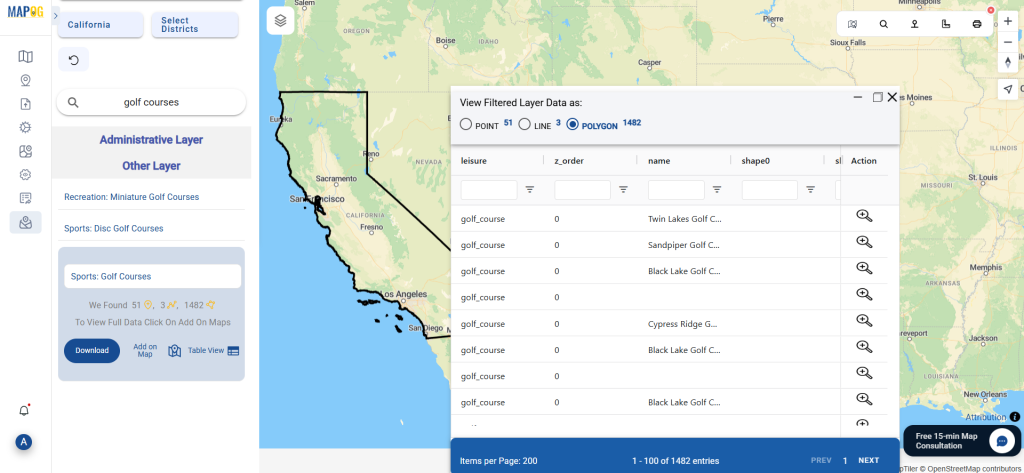
Step 4: Visualize with “Add on Map”
With the “Add on Map” feature, overlay the selected golf course layer onto the interactive GIS interface. This step allows you to visually analyze golf course distribution, proximity to urban areas, or potential environmental impact zones.
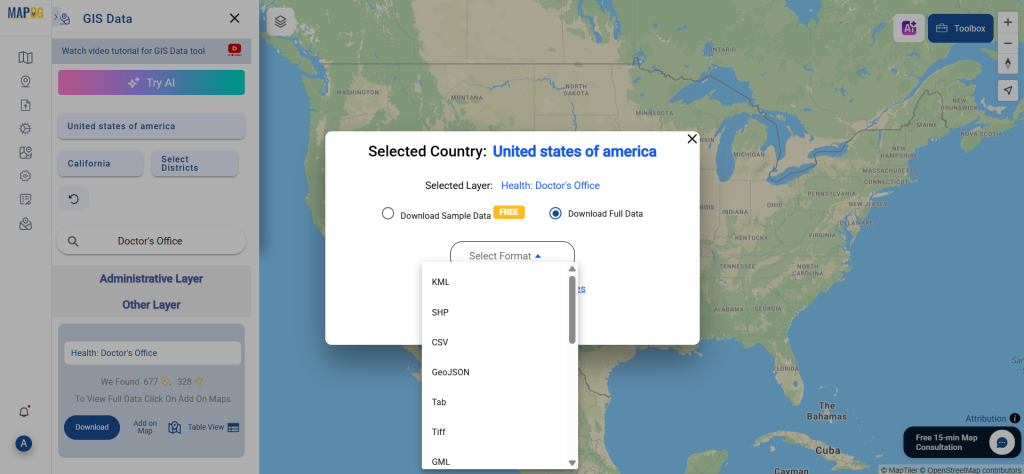
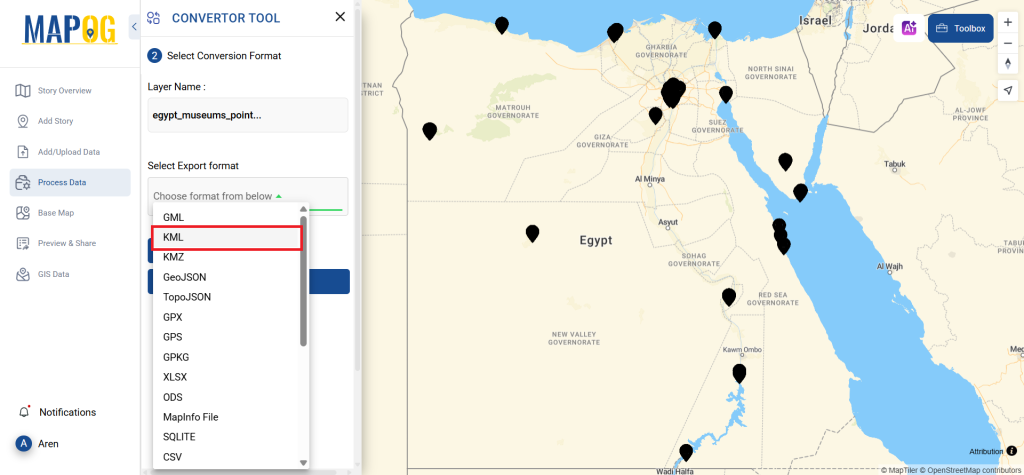
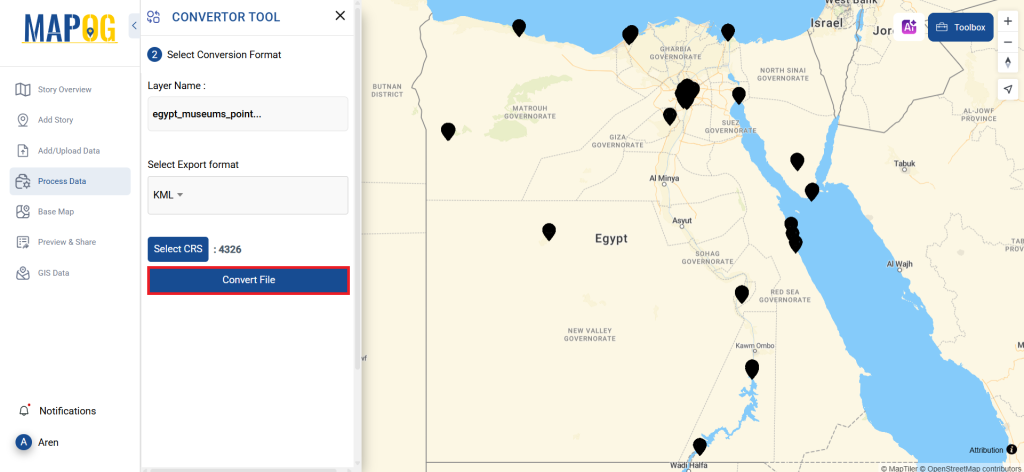
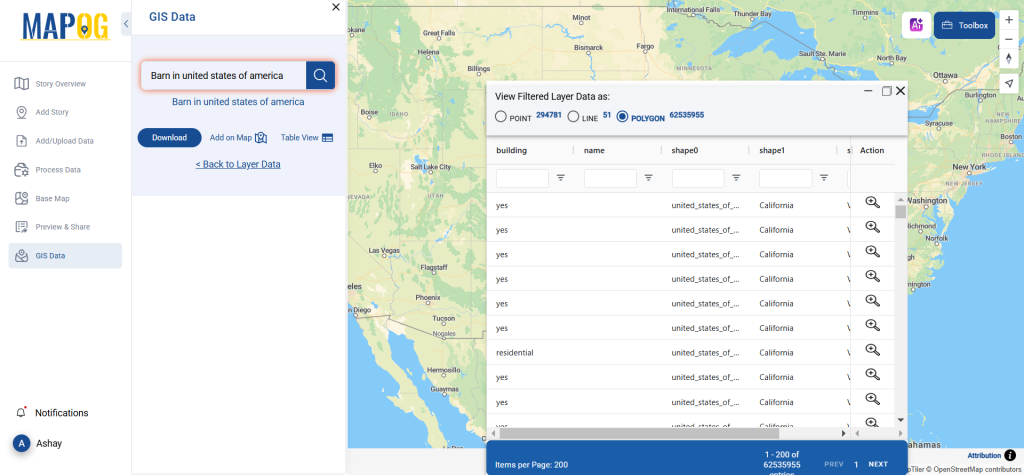
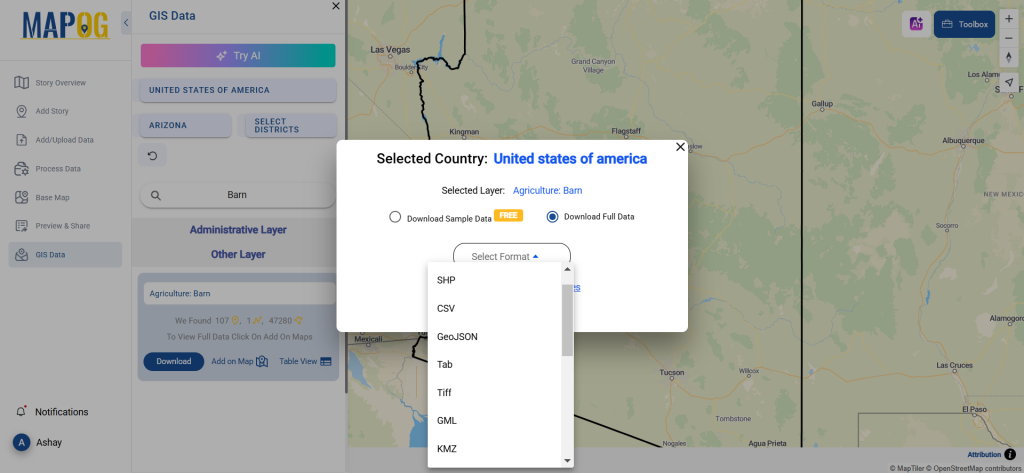
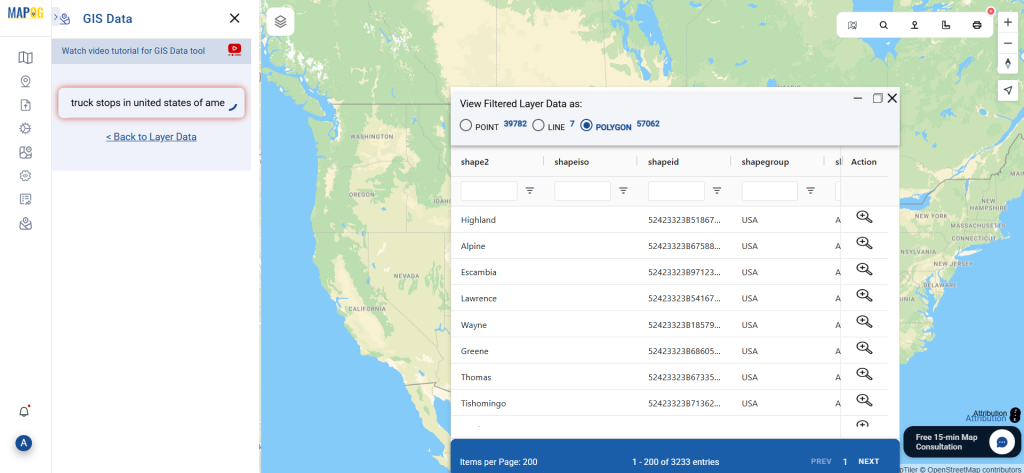
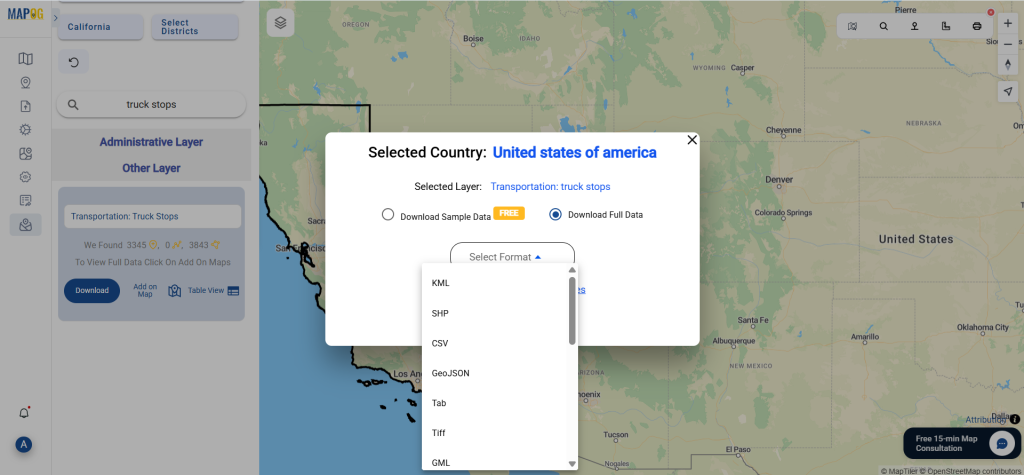
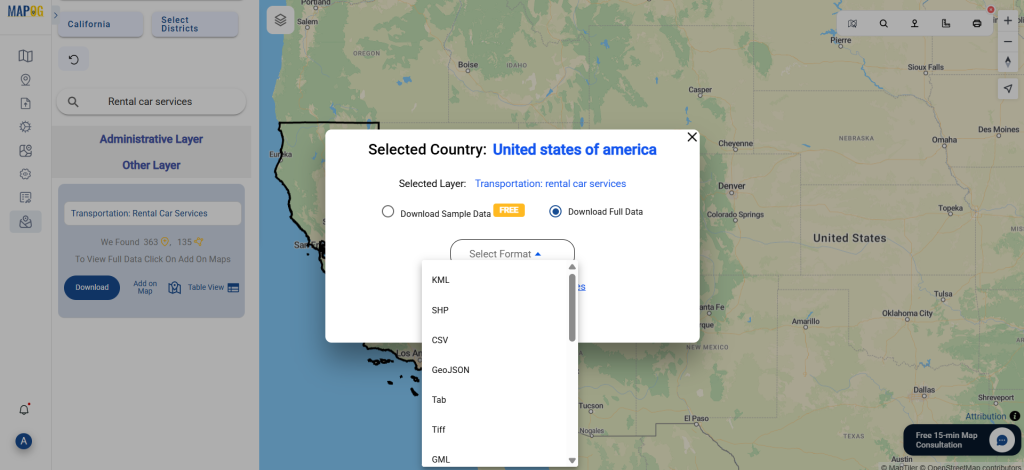
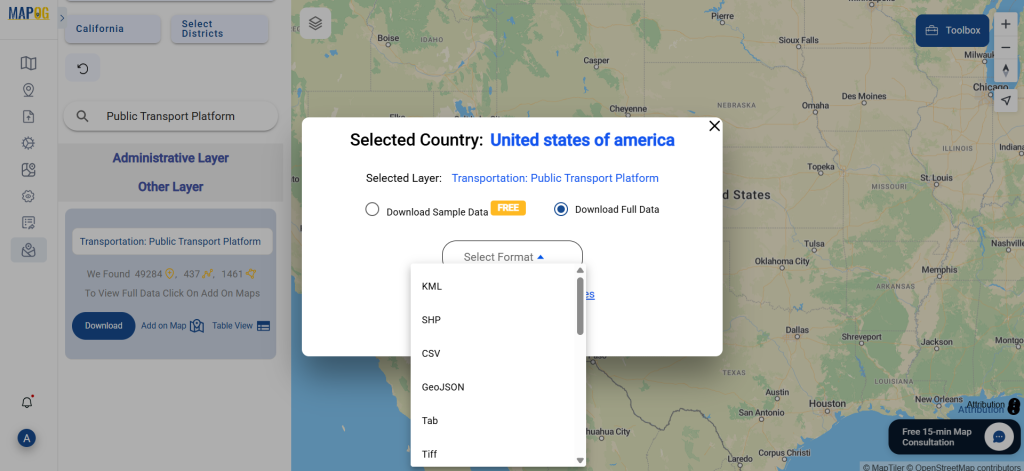
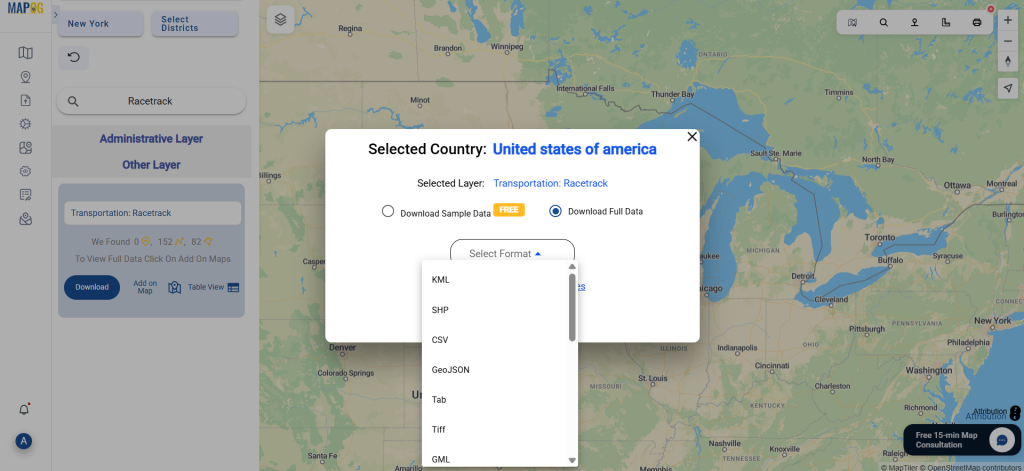
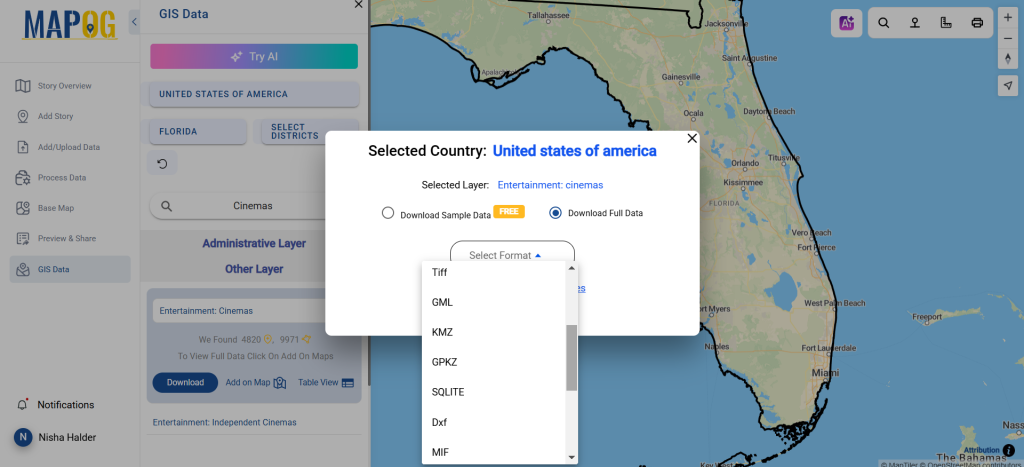
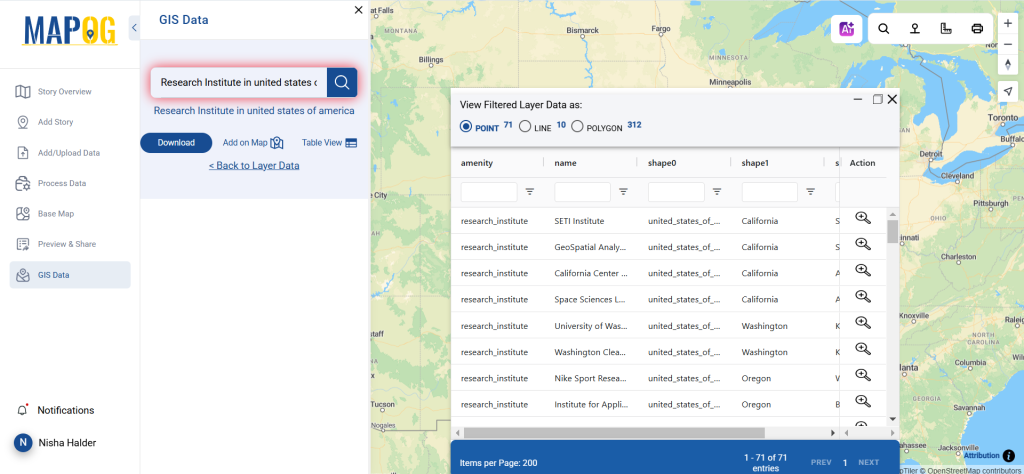
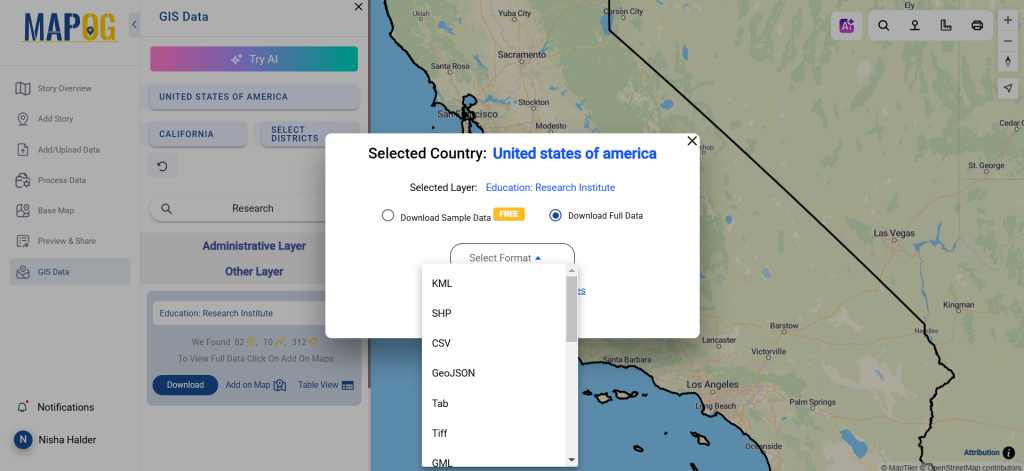
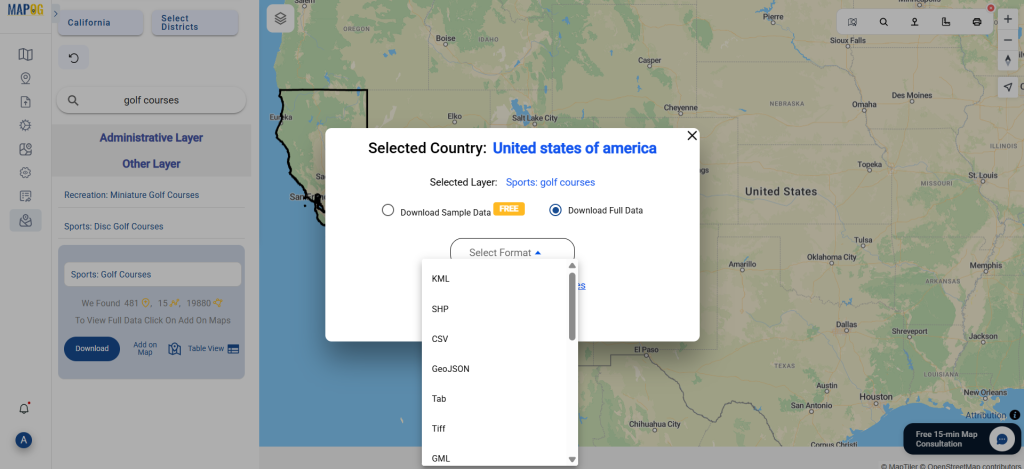
Step 5: Download the Data
Once you’re ready, hit the “Download Data” button. Choose from sample or full datasets, select the appropriate format (such as Shapefile, KML, MID, etc.), accept the terms, and begin your download.

Final Thoughts
In just a few clicks, users can download golf courses data tailored to their project’s scope and format needs. Whether you’re creating tourism maps, studying land use, or analyzing recreational infrastructure, MAPOG’s GIS Data platform provides flexible and comprehensive data access. Dive into rich geospatial insights with MAPOG and take your golf course mapping to the next level.
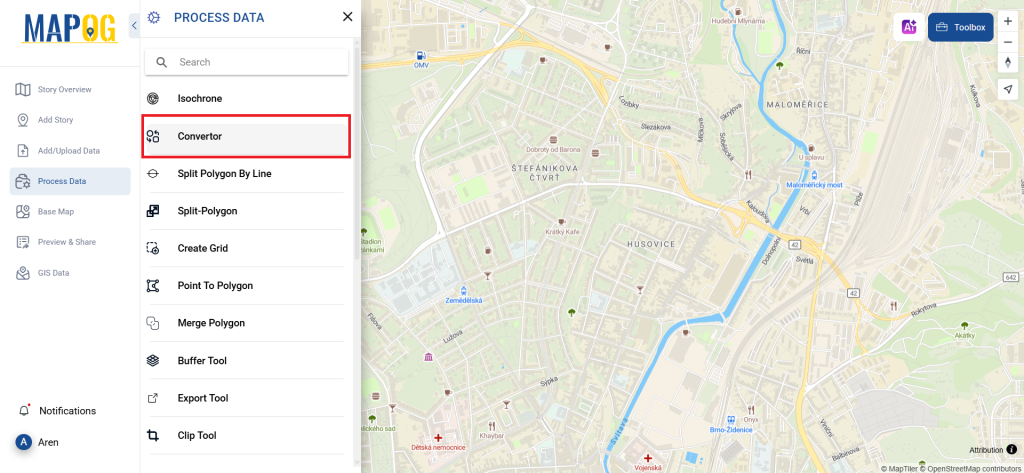
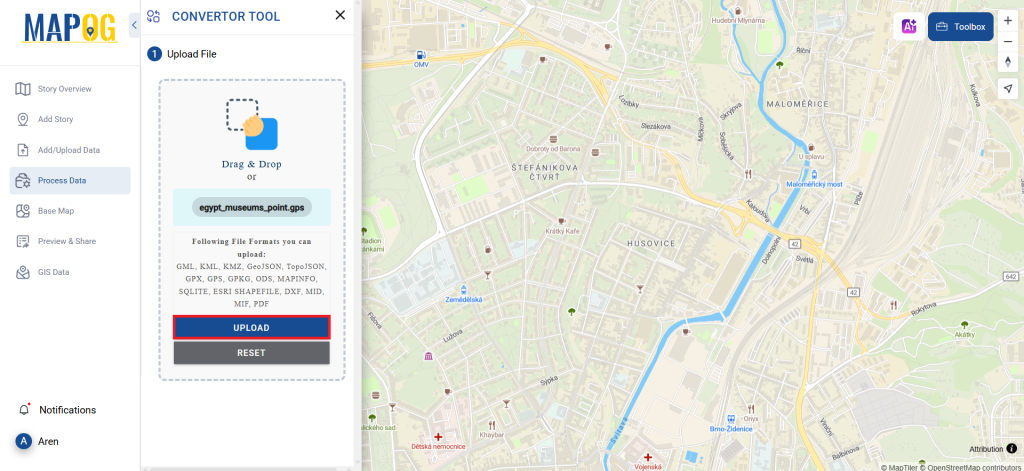
With MAPOG’s versatile toolkit, you can effortlessly upload vector and upload Excel or CSV data, incorporate existing layers, perform polyline splitting, use the converter for various formats, calculate isochrones, and utilize the Export Tool.
For any questions or further assistance, feel free to reach out to us at support@mapog.com. We’re here to help you make the most of your GIS data.
Download Shapefile for the following:
- World Countries Shapefile
- Australia
- Argentina
- Austria
- Belgium
- Brazil
- Canada
- Denmark
- Fiji
- Finland
- Germany
- Greece
- India
- Indonesia
- Ireland
- Italy
- Japan
- Kenya
- Lebanon
- Madagascar
- Malaysia
- Mexico
- Mongolia
- Netherlands
- New Zealand
- Nigeria
- Papua New Guinea
- Philippines
- Poland
- Russia
- Singapore
- South Africa
- South Korea
- Spain
- Switzerland
- Tunisia
- United Kingdom Shapefile
- United States of America
- Vietnam
- Croatia
- Chile
- Norway
- Maldives
- Bhutan
- Colombia
- Libya
- Comoros
- Hungary
- Laos
- Estonia
- Iraq
- Portugal
- Azerbaijan
- Macedonia
- Romania
- Peru
- Marshall Islands
- Slovenia
- Nauru
- Guatemala
- El Salvador
- Afghanistan
- Cyprus
- Syria
- Slovakia
- Luxembourg
- Jordan
- Armenia
- Haiti And Dominican Republic
- Malta
- Djibouti
- East Timor
- Micronesia
- Morocco
- Liberia
- Kosovo
- Isle Of Man
- Paraguay
- Tokelau
- Palau
- Ile De Clipperton
- Mauritius
- Equatorial Guinea
- Tonga
- Myanmar
- Thailand
- New Caledonia
- Niger
- Nicaragua
- Pakistan
- Nepal
- Seychelles
- Democratic Republic of the Congo
- China
- Kenya
- Kyrgyzstan
- Bosnia Herzegovina
- Burkina Faso
- Canary Island
- Togo
- Israel And Palestine
- Algeria
- Suriname
- Angola
- Cape Verde
- Liechtenstein
- Taiwan
- Turkmenistan
- Tuvalu
- Ivory Coast
- Moldova
- Somalia
- Belize
- Swaziland
- Solomon Islands
- North Korea
- Sao Tome And Principe
- Guyana
- Serbia
- Senegal And Gambia
- Faroe Islands
- Guernsey Jersey
- Monaco
- Tajikistan
- Pitcairn
Disclaimer : The GIS data provided for download in this article was initially sourced from OpenStreetMap (OSM) and further modified to enhance its usability. Please note that the original data is licensed under the Open Database License (ODbL) by the OpenStreetMap contributors. While modifications have been made to improve the data, any use, redistribution, or modification of this data must comply with the ODbL license terms. For more information on the ODbL, please visit OpenStreetMap’s License Page.
Here are some blogs you might be interested in:
- Download Airport data in Shapefile, KML , MIf +15 GIS format – Filter and download
- Download Bank Data in Shapefile, KML, GeoJSON, and More – Filter and Download
- Download Railway data in Shapefile, KML, GeojSON +15 GIS format
- Download Farmland Data in Shapefile, KML, GeoJSON, and More – Filter and Download
- Download Pharmacy Data in Shapefile, KML, GeoJSON, and More – Filter and Download
- Download ATM Data in Shapefile, KML, MID +15 GIS Formats Using GIS Data by MAPOG
- Download Road Data in Shapefile, KML, GeoJSON, and 15+ GIS Form