This article shows how to render topojson file data on OSM map with the help of d3 and Leaflet javascript library in the browser. Leaflet js is an open source small library to create interactive map. You may look over Getting Started with Leaflet js. TopoJSON is one of the GIS data structure which stores geographic data in JSON format. You can easily convert Shapefile to TopoJSON or convert GeoJSON to TopoJSON file. Rather than representing geometries discretely, geometries in TopoJSON files are stitched together from shared line segments called arcs. TopoJSON eliminates redundancy, allowing related geometries to be stored efficiently in the same file. A single TopoJSON file can contain multiple feature collections without duplication. Or, a TopoJSON file can efficiently represent both polygons (for fill) and boundaries (for stroke) as two feature collections that share the same arc mesh. You might be thinking why Topojson. Because TopoJSON files are almost 80% smaller than their GeoJSON equivalents.
Read Parse Render TopoJSON file – Leaflet js
Your html code will start with the DOCTYPE as :
<!DOCTYPE html>
<meta charset=”utf-8″>
<div id=”map” style=”width: 1000px; height: 1000px;”></div>
The <!DOCTYPE> declaration is not an HTML tag; it is an instruction to the web browser about what version of HTML the page is written in. The charset attribute specifies the character encoding for the HTML document. Div tag denotes division or a selection in document. Here it is a container for map with id as map, width and height as 1000px.
To use any library in document you first need to add that library into your document. The script tag contains the scripts which is leaflet and d3 javascrpit library. This library can be downloaded from http://leafletjs.com/download.html or you can add the given links as follows:
<meta name=”viewport” content=”width=device-width, initial-scale=1.0″>
<link rel=”stylesheet” href=”https://unpkg.com/leaflet@1.0.3/dist/leaflet.css” />
<script src=”https://unpkg.com/leaflet@1.0.3/dist/leaflet.js”></script>
<script src=”https://d3js.org/d3.v3.min.js” charset=”utf-8″></script>
<script src=”https://d3js.org/topojson.v1.min.js”></script>
Now to add OSM (Open street map) in division we create a variable named as newMap. Here L.map represents object of map class takes Html element as parameter. Setview is a method that set the center and zoom level according to given parameters.
var newMap = L.map(‘map’).setView([38.9188702,-77.0708398],6);
The tileLayer represents object of tileLayer class that takes URL of data. Here we have given OSM tiles in parameter. In attribution key you need to define the contribution of data source. You are free to copy, distribute, transmit and adapt OSM data, as long as you credit OpenStreetMap and its contributors. For this you need to add http://osm.org/copyright into your document. Method addto() adds the layer to the given map.
L.tileLayer(‘http://{s}.tile.osm.org/{z}/{x}/{y}.png’, {
attribution: ‘© <a href=”http://osm.org/copyright”>OpenStreetMap</a> contributors’
}).addTo(newMap);
Here d3 (data driven document) is a javascript library for manipulating document that visualizes data with HTML, CSS and SVG. Json() is a function that gets Topojson file. Here uk.json is a topojson data. The topojson.feature() function converts the geojson data into topojson data format. L.geoJson creates a GeoJSON layer, accepts an object in GeoJSON format to display on the map.
d3.json(“uk.json”, function(error, uk) {
var places = topojson.feature(uk,uk.objects.places);
var geo=L.geoJSON(places).addTo(newMap);
newMap.fitBounds(geo.getBounds());
});
As data is now added to the map by using addTo() method. Now to get the area covered by topojson file on the map or directly pan to the area where this data has rendered you can use the methods getBounds() and fitBounds(). The getBounds() method returns the geographical bounds visible in the current map view. Here this method is used with geoJSON layer to get its bounds or diagonal corner coordinates. The fitBounds() sets a map view that contains the given geographical bounds with the maximum zoom level possible.
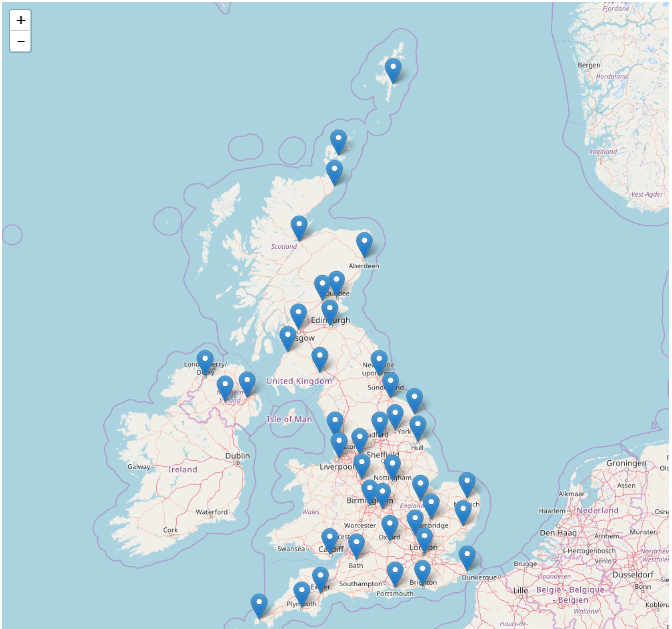
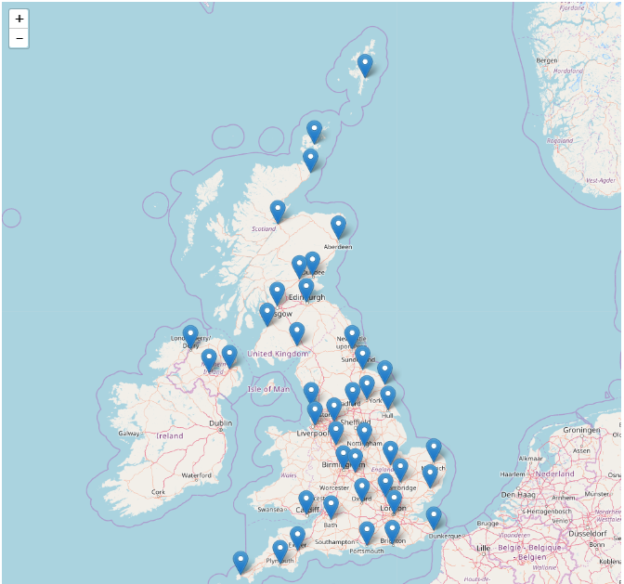
“var places = topojson.feature(uk,uk.objects.places);” command has used which shows the places (geometry primitive as points) on the map.

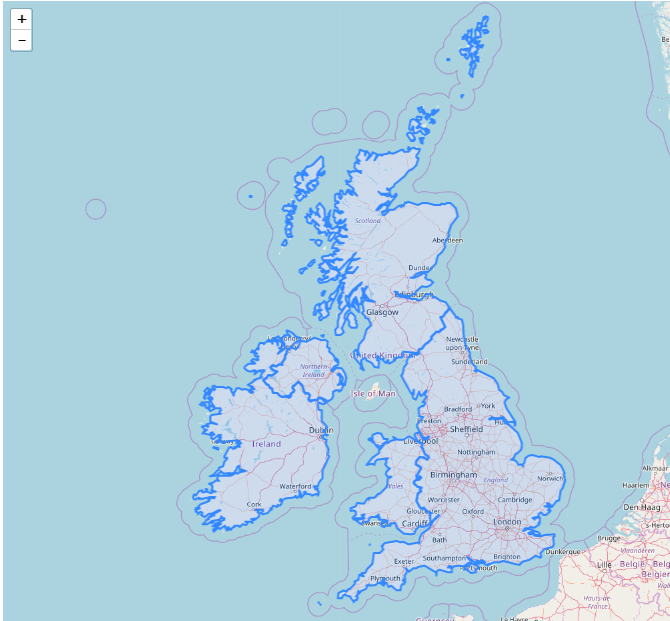
If var subunits = topojson.feature(uk, uk.objects.subunits); command you use then it will show the subunits (geometry primitive as polygon) on the map.

That is all about read, parse, render Topojson file with Leaflet js. You may also look in to rendering point, polyline and polygon geojson file with leaflet js. If you find any problem in Rendering TopoJSON file then do comment below, I would love to help you in providing solution.
