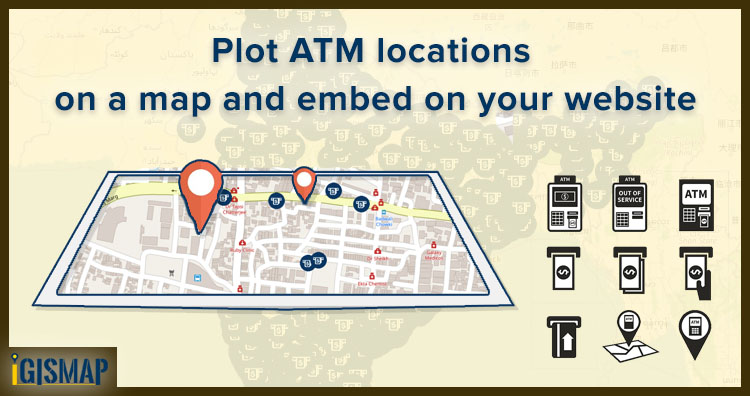
Consider that you are an engineer working for the technical support team in a bank. And you were asked to host a web map of the ATM locations under your branch. This same map should be later available to dynamically visualize the transactions associated with each ATM in a quantitative representation. In this article, you will learn how to plot atm/shop locations on map and embed it on your website.
There are limited GIS software and online tools where you can do this job. Most of them are limited to any single service, ie., either creating a map and hosting the map on a website, but IGISMap allows you to do both. MAPOG is a GIS based web platform providing multiple GIS applications that are most important in the field of geospatial analytics. The peculiarity of IGISMAP in the GIS Industry is its UI/UX which helps the user to perform effortless geospatial operations. GIS tools of IGISMAP allow you to Add Your Data, Create Your Data, Map Your Data, Style Your Data, Process Your Data, and Analyze Your Data, and additionally, it helps you to share your Data privately or publicly.
How to Plot ATM/shop locations on map
Create Point Data tool of IGISMap is a powerful GIS tool to plot point vector data to represent locations and point objects with single latitude and longitude values. Using Create Point Data tool, we can create an interactive map of ATM locations like the following.
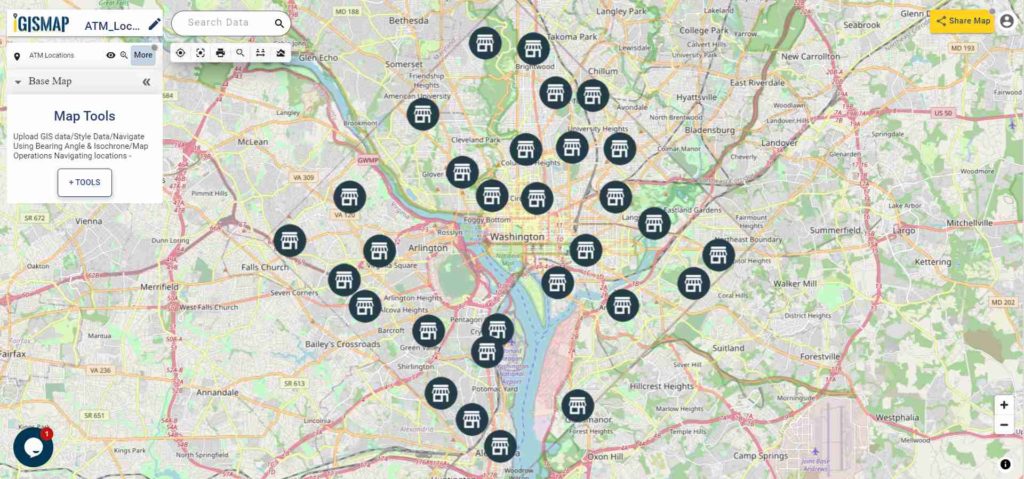
Lets walk through each step of the Create Point Data tool to create a map like this and share with your team.
- First, you need to log in to MAPOG . If you haven’t signed up for IGISMap, click the Sign Up button to create an account.
- After Logging In, you will be directed to the dashboard of your IGISMap account.
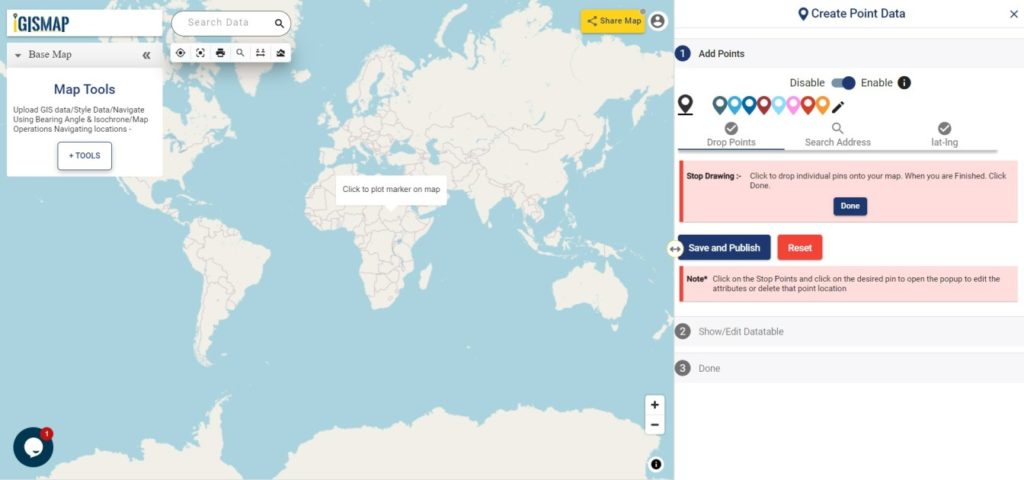
- From the dashboard, click on the Create Point Data tab to open the tool as shown below.
Start Plotting Points for the ATM Locations
First step is Add Points, where we can start plotting the ATM locations as points, in the form of pins. IGISMap provides you with three features for plotting points: Drop Points, Search Address, and Lat Lon Values.
- Let’s select the Drop Points option and zoom to the location with the desired ATM Machine to plot a pin in that specific location on the map
- Search Address option opens a search address box, where you can enter an address and choose the right option from the dropdown list, then click the Plot button to plot a point on that location.
- Lat Lon Values will open two boxes to enter latitude and longitude values of the location you want to plot, Plot Location button in this option will plot a pin at the location you have entered.
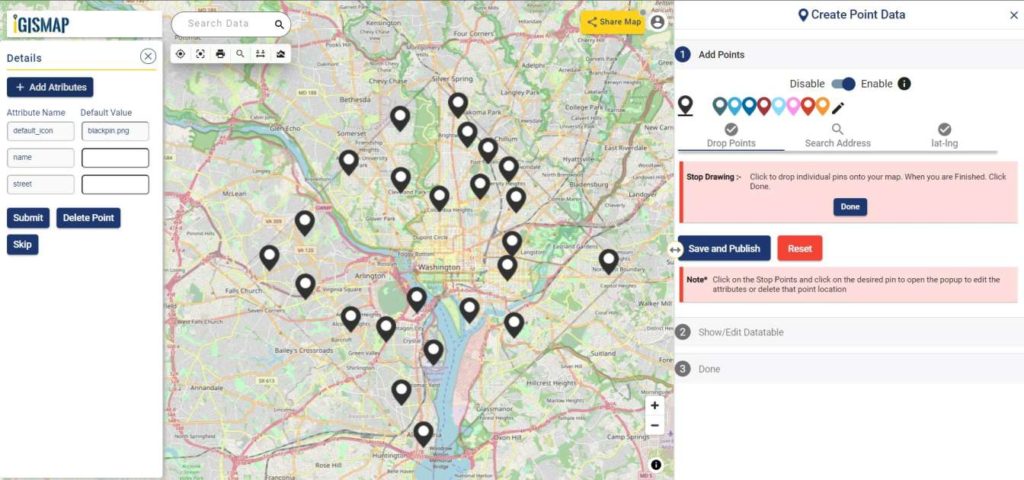
Also, a popup will open for entering attribute values in each attribute field for that atm location when a point is plotting. Click the Submit button to Submit the save the attribute entries. You can choose to delete the point you plotted by clicking the Delete Point button. You can disable the default opening of this popup using the toggle button.

But we can open this popup anytime while plotting, by simply clicking on an existing pin.
Note: If the Drop Points option is active for dropping pins, it should be unselected for selecting the plotted pins to open the attribute popup.
After plotting every desired ATM location for our data, click the Save and Publish button to publish your data in the map.
Review and Edit the Datatable
After the atm location is published, Show/Edit Datatable section will be open. Here you can edit the attribute values entered for each point location after clicking ![]() the button in the data table along each row in the data table. You can also choose to delete a point by clicking
the button in the data table along each row in the data table. You can also choose to delete a point by clicking![]() button.
button.
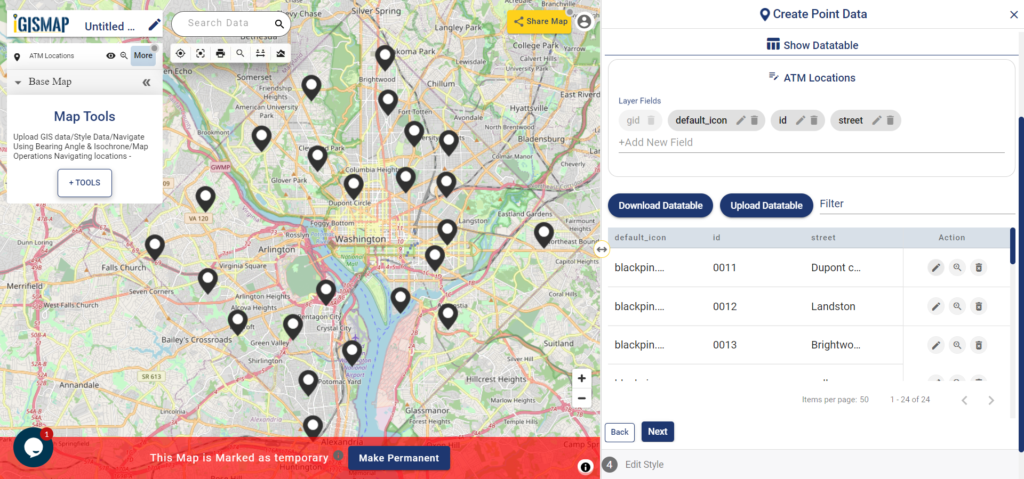
Options to edit or delete the attribute fields are also available in this step along with the option to add new attribute fields to this data. If you thought of adding more points to the data of ATM Locations, select the Back button to go to the Add Points section, where you can add more points and make changes to the already published data.
Option to update the data table as bulk is available in this section. Where the whole data table can be downloaded in Excel format using Download Datatable button. And to make the changes outside IGISMap, then upload the edited/updated spreadsheet file using Upload Datatable button and integrate with the same point data of ATM locations.
After making all the changes in the datatable, let’s move to the styling section by clicking the Next button to finish plotting.
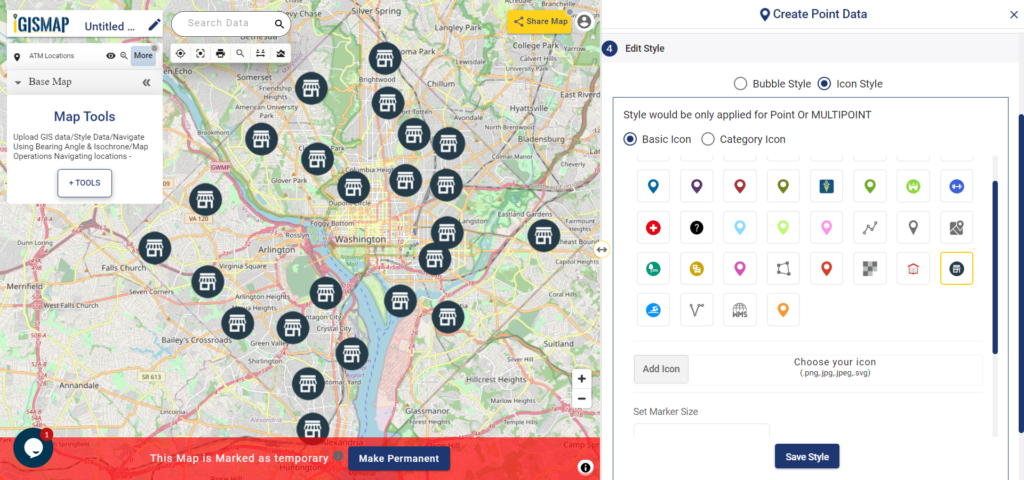
Style Your ATM Location Points
A map will become more meaningful if appropriate icons and colors are used to visualize the features of the map. In IGISMap styling options, Bubble Style and Icon Style are provided for point GIS data.
Check this article understand How to create Bubble Map for point GIS data.
Here we are going to style our data using Icon Style. In Icon Styling, IGISMap provides two more options – Basic and Category styling. For now, let’s make it simple by providing an appropriate pin icon for styling the ATM location points. And apply it on the ATM Locations data as follows.
Check this article to understand How to style point GIS data categorically using Icon Style tool.
IGISMap provides direct access to Icon Style and Bubble Style tools from an existing map, where you can style point GIS data published in that map
Embed Your ATM Locations Map in a Website
As the data is created completely and styled appropriately, let’s embed the map of ATM Locations in a website. For this, click the ![]() button at the top right, where you will reach the UI to control the sharing of this map.
button at the top right, where you will reach the UI to control the sharing of this map.
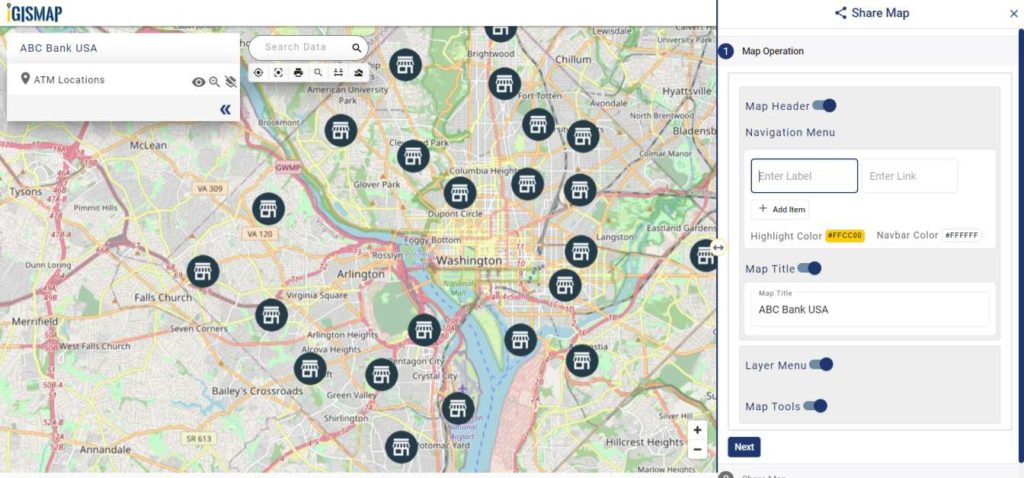
Once the components are enabled and disabled as desired. After that click the Next button to proceed to the step of copying the iframe link to embed in a website.
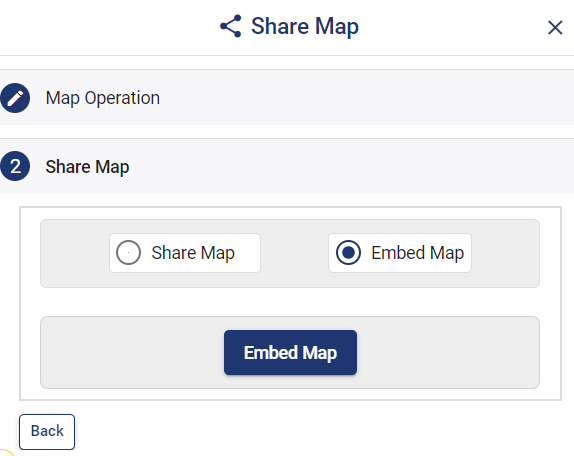
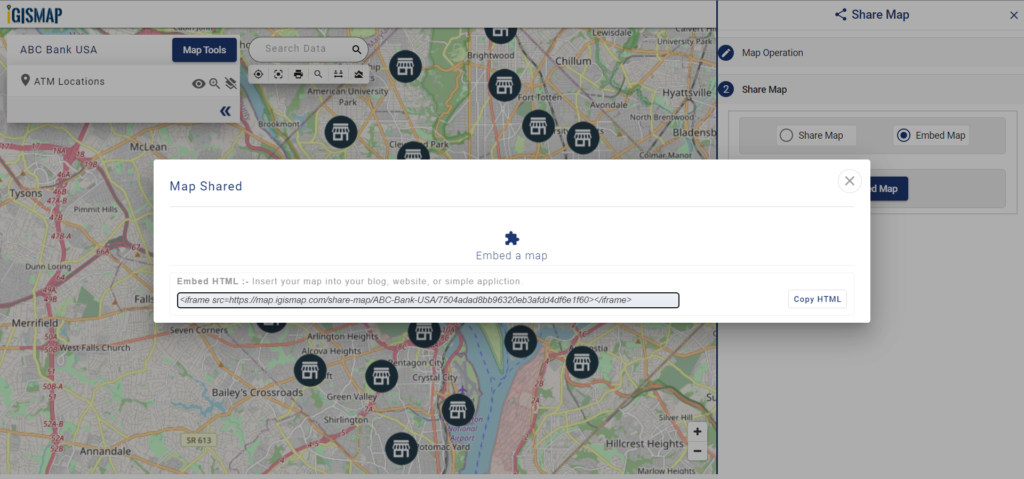
Copy the HTML code link and embed it on your website. Thus the map will be available as interactive as below.
Afterward merge the data table of the ATM Locations with the transaction data of each ATMs. Furthermore, for quantitative visualization, we can use Bubble Style. The style will apply automatically to your website. So with the following steps, you can plot atm/shop locations on a map and embed them on your website.
Article Share your Map will help you understand more about Share Map feature of IGISMap.
Other articles:
- Map the locations of slums and embed the map on your website
- Create a Map of the Bank Locations in South India
- Create point data and convert it into polygons
- Download point GIS data from IGISMap
- Charts with Map – Create Bar Chart, Histogram, Number Chart, Table
Check the following IGISMap tools:
- Create Point Data
- Create Polygon Data
- Create Polyline Data
- Icon Style
- Bubble Style
- Download GIS Data