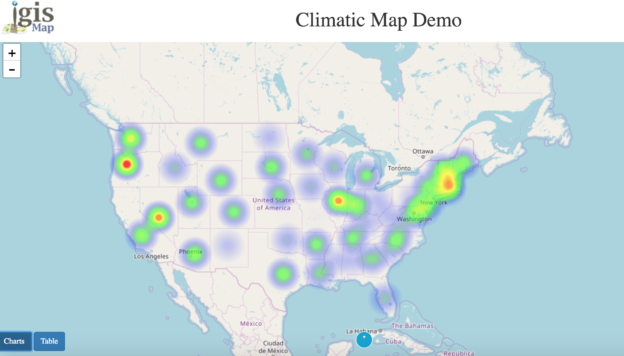
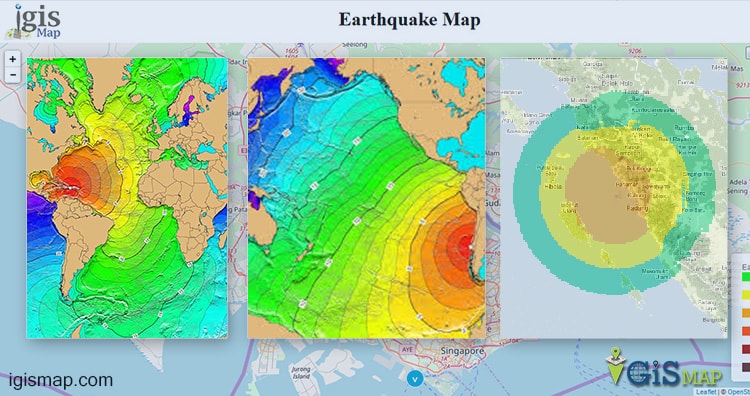
Earthquake Map – Create EarthQuake Map GIS

An earthquake (also known as a quake, tremor or temblor) is the shaking of the surface of the Earth, resulting from the sudden release of energy in the Earth’s lithosphere that creates seismic waves. Earthquakes can range in size from those that are so weak that they cannot be felt to those violent enough to … Continue reading “Earthquake Map – Create EarthQuake Map GIS”