Interactive map with data table are made in IGISmap along with maps, data can be viewed in form of table. Once adding a data table chart, it will display data in form of table. If the map is zoomed to a particular region then table will update and only data in that region will be displayed in form of table and you would be able to know the actual details of a particular location on map.
Analysis with Data Tables and Map
The combination of data tables and map in IGISmap makes it very useful to analyse and understand the data in both visualization on map and accurate data tables side by side. It gives the exact idea about data of a region to the user or analyst.
Users can zoom in and out to different regions to understand data patterns of different region so that tables will be auto updated according to the region user is viewing at an instance.
Analysis of data is better with visualization. Map provides visualization of data. A lot of data can be represented on map. Different areas on map have different data patterns. When you focus on a particular region stats of that area will be displayed in data table and it gives you exact values of data in that region.
Customise Table in Map
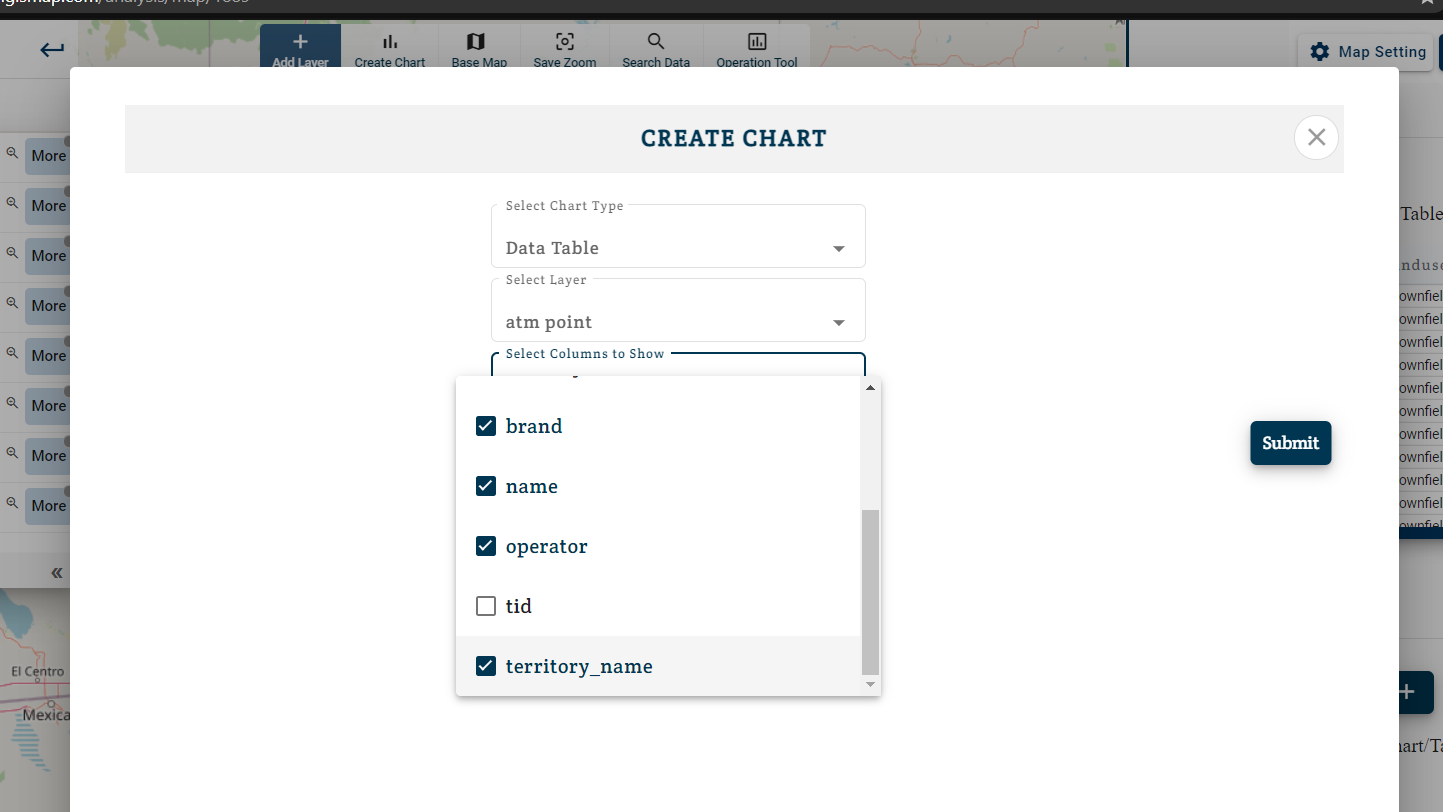
Every layer has multiple types of data. User can select attributes of the data to be shown in table so that attributes selected by the user will be displayed as columns in the table and only the attributes selected by user will be viewed.
Steps to add Data Table chart in Map
- Login to IGISmap tool. And navigate to a map already added by you. If you don’t have any map added, you can add the map easily. Once the map is created add GIS layer.
- Click on Create chart. The create chart and data table dialog box will appear.
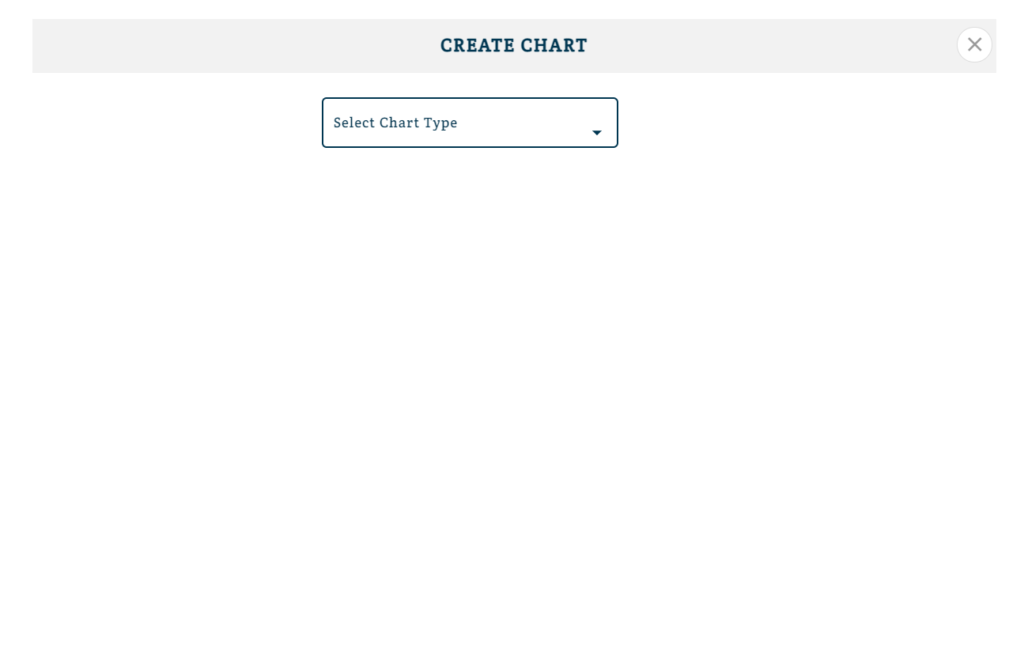
2. Select Chart type and then choose data table.
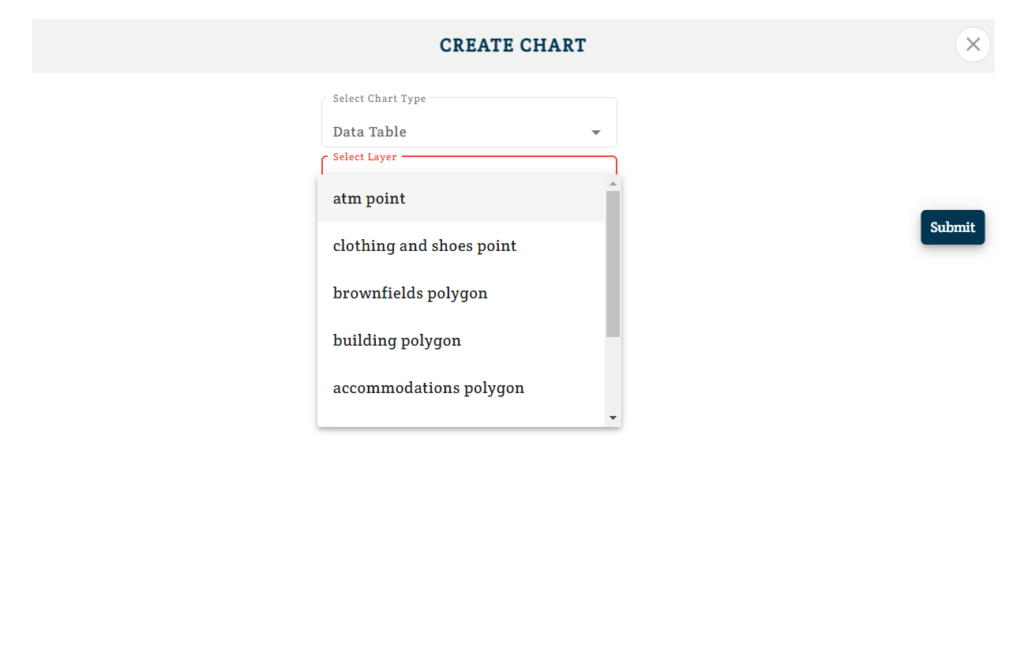
3. Select Layer from which you want to make table.
4. Select Columns to show – Attributes selected will be displayed as column of table. You can select multiple attributes.
5. Click on Submit a chart with Data Table will be added.
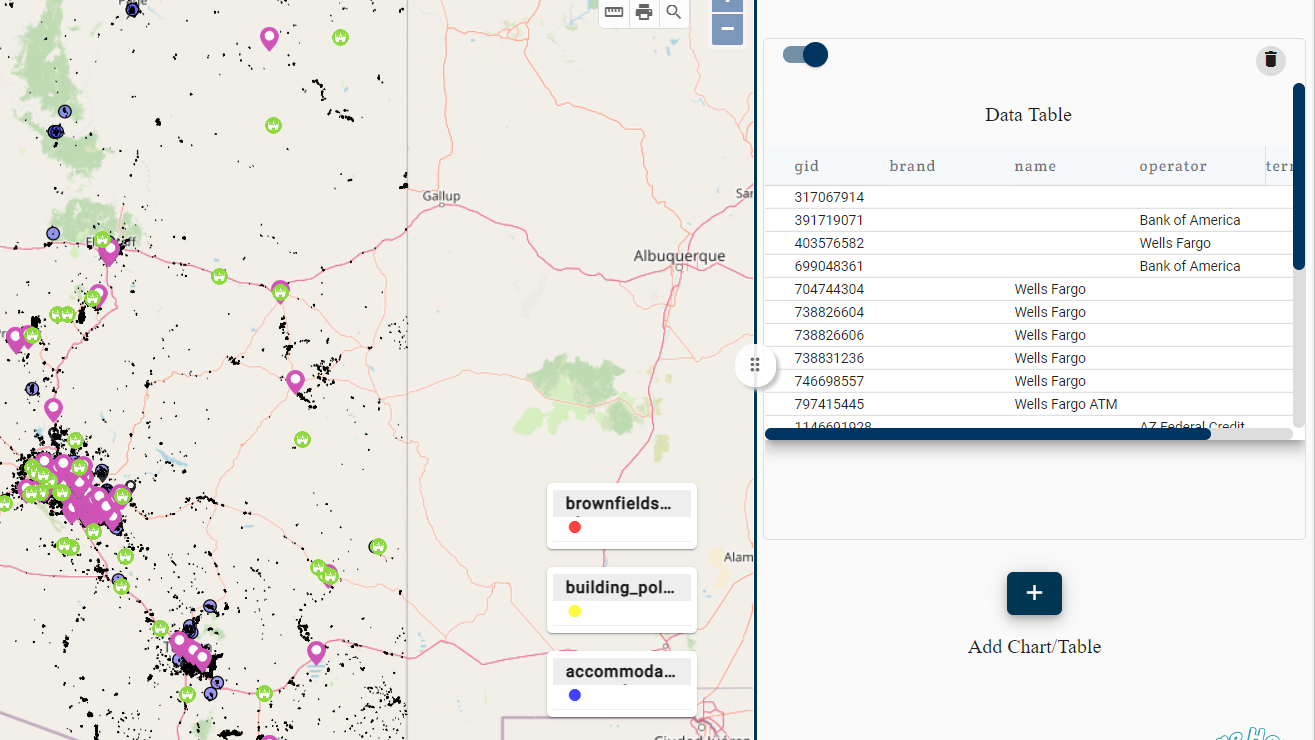
6. You can add multiple charts in same project.
These charts and tables along with map helps to understand data to the user also it becomes easier with this presentation to explain the plain with other team members.
IGISmap does not require any programming or coding background so anyone can use this tool easily to create or add Data table in map. You can also embed charts and maps to your website or blog.