Bar chart represents categorial data with rectangular heights in proportion to value. It gives idea of data to user by showing data distribution patterns. Bar Chart in Map makes your BI (Business Intelligence) more powerful. Let’s look into where and how we can add interactive bar chart in maps.
Real case Scenario – Maps with Bar chart
Maps with Bar chart can be used in different scenarios because it gives clear comparison of different entities.
Let us take example of different lands for Supermarket. Here with the help of igismap tool, we can show different plots or land pieces and area or parking corresponding to it on Map. As shown in Image below:
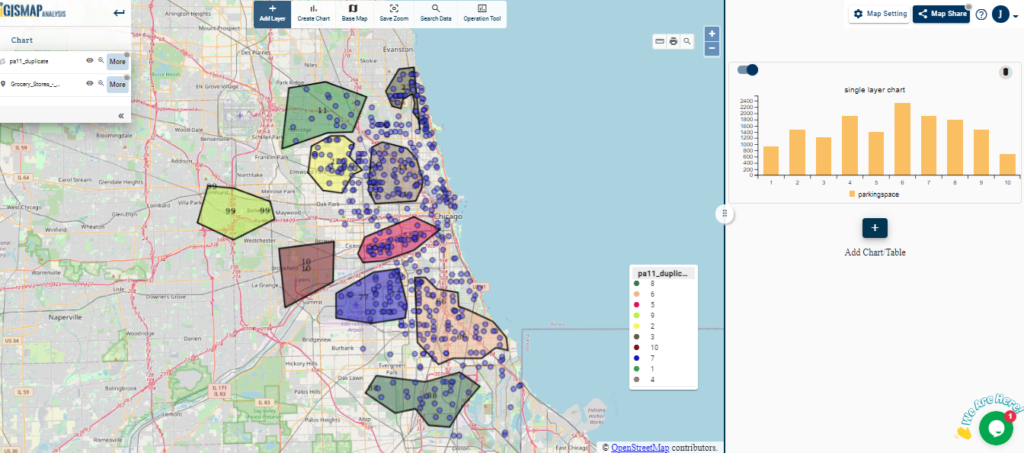
Here with image Where bar chart in maps are shown, we can easily analyse ,that plot number 6 which is shown in orange color on map, can be easily identified as with most number of parking space when we compare the figures on bar chart.
Steps of adding Bar Chart in Map
- Login to IGISmap tool. And navigate to a map already added by you. If you don’t have any map added, you can add the map easily. Checkout this tutorial to add map. Once the map is created add GIS layer.
- To create Bar chart in map, Click on Create Chart button.
- Note : Charts can be added to Template with charts and not to a full map.
- Under Select chart choose single layer bar chart.

- Select Layer which you want to be displayed.
- Choose Property on x-axis. Select from attribute to be displayed on x axis.
- Similarly select attribute on y axis. You can select multiple attributes from here. Only numerical data can be represented on y axis.
- Now select the calculation on y-axis and you can select different calculations such as max, min,average ,sum etc accordingly.
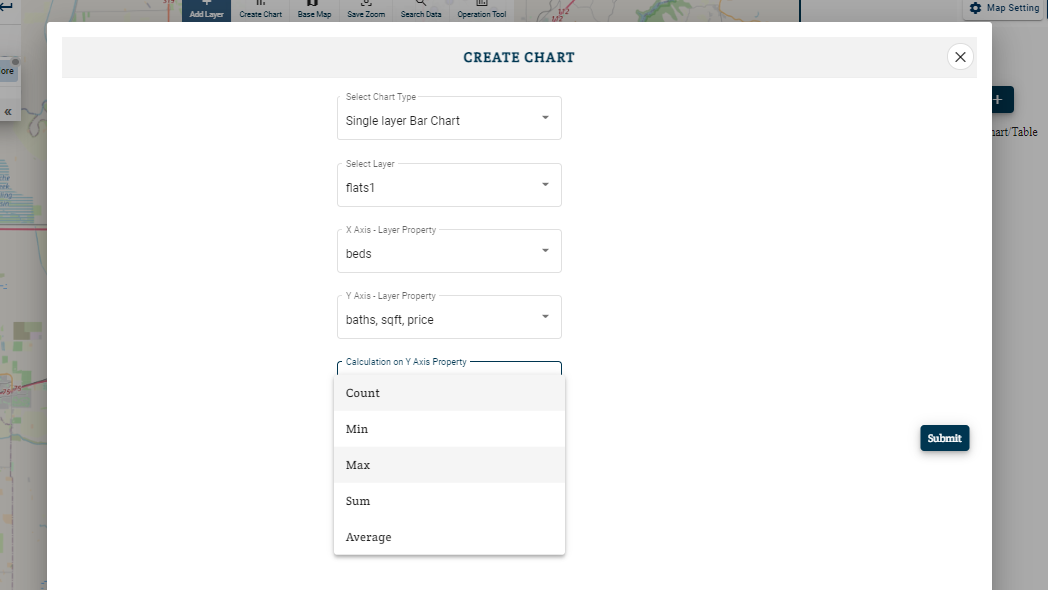
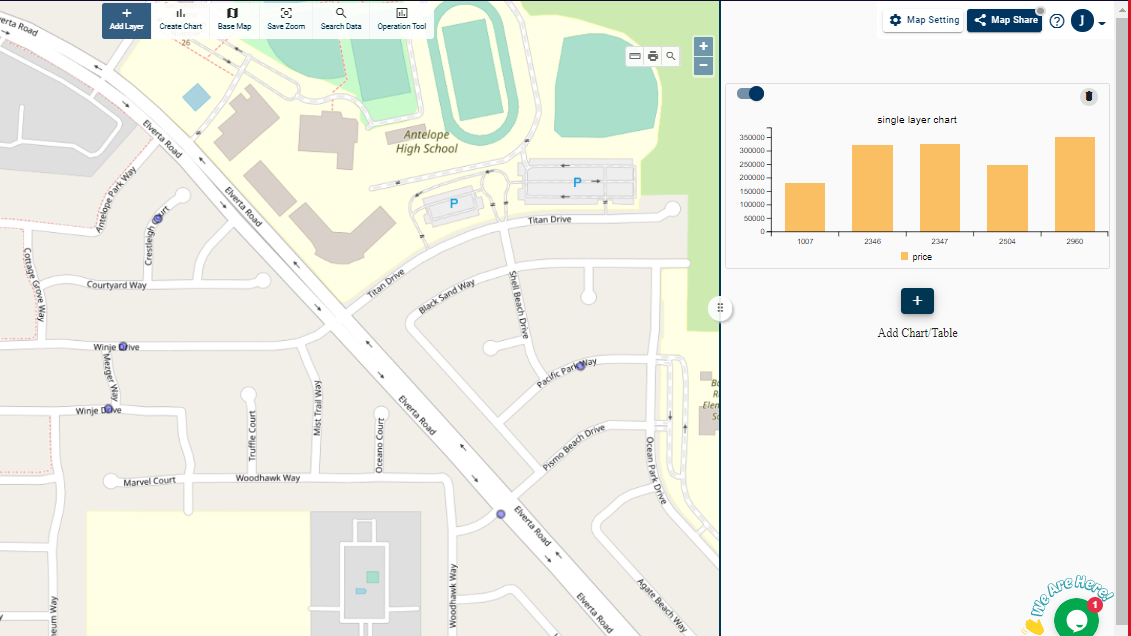
- Click on Submit button and a Single Layer Bar Chart will be added.
The best thing about this tool is that you can also create or embed this map and chart together in your blogs or websites without having any prior knowledge in coding or programming.