To represent any kind of data on a map. We should have some geographic data of that particular point or region. In the blog we will learn how to create a map with CSV or Excel. With your data just make two more columns and add Latitude and Longitude of that particular point.
Eg. Data of properties in a region with their geographic data.
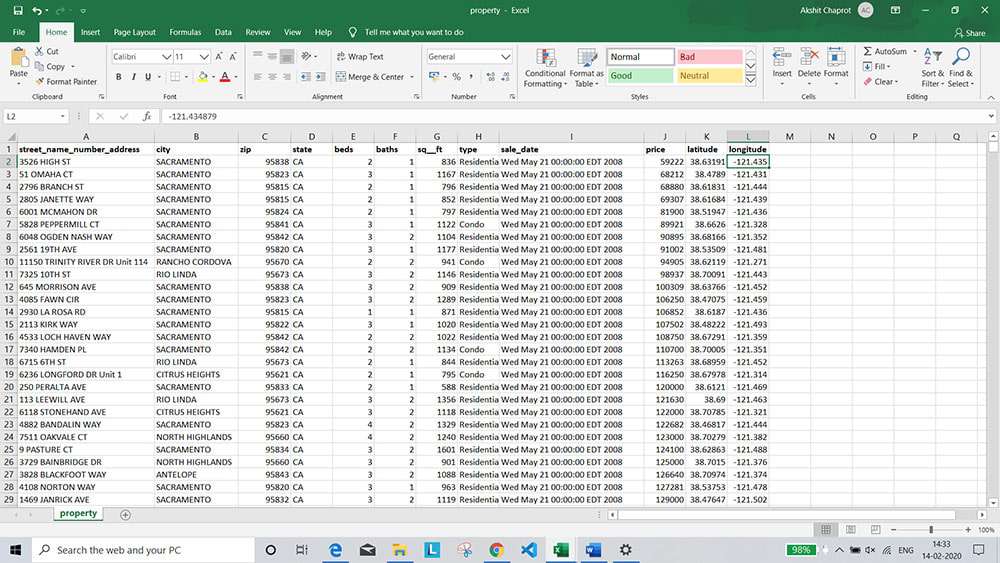
note:- The above file is in .csv format
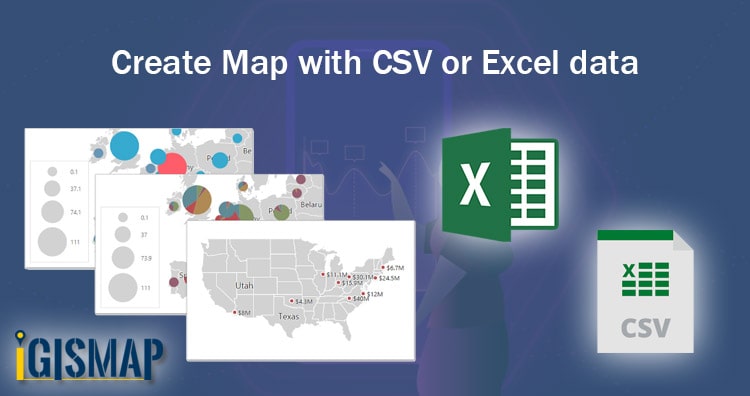
Create a map with CSV or Excel
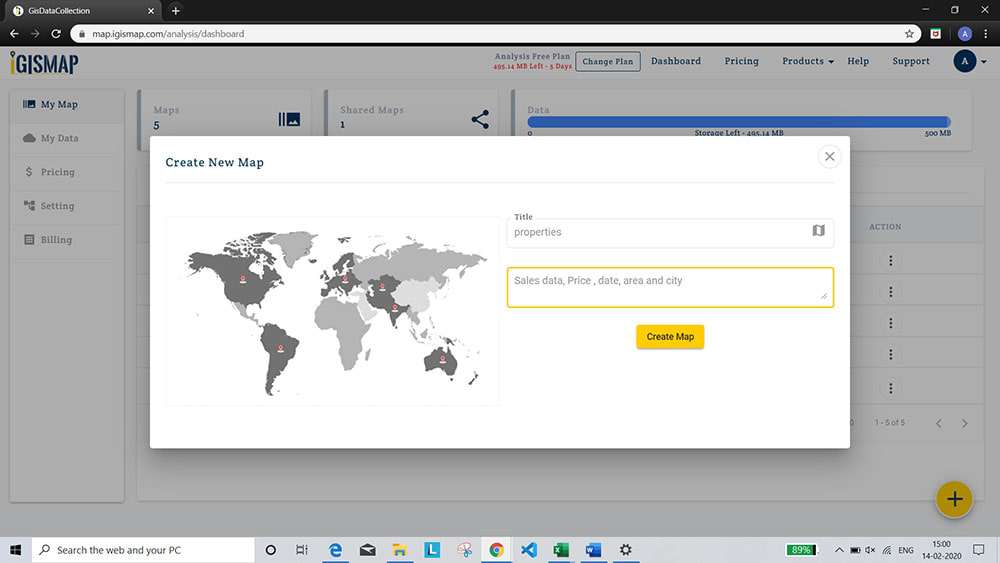
- Go to IGIS map dashboard and create a new map. (Or select a map you want to add this data).
Click on + (plus button) to add a new map and fill the details.
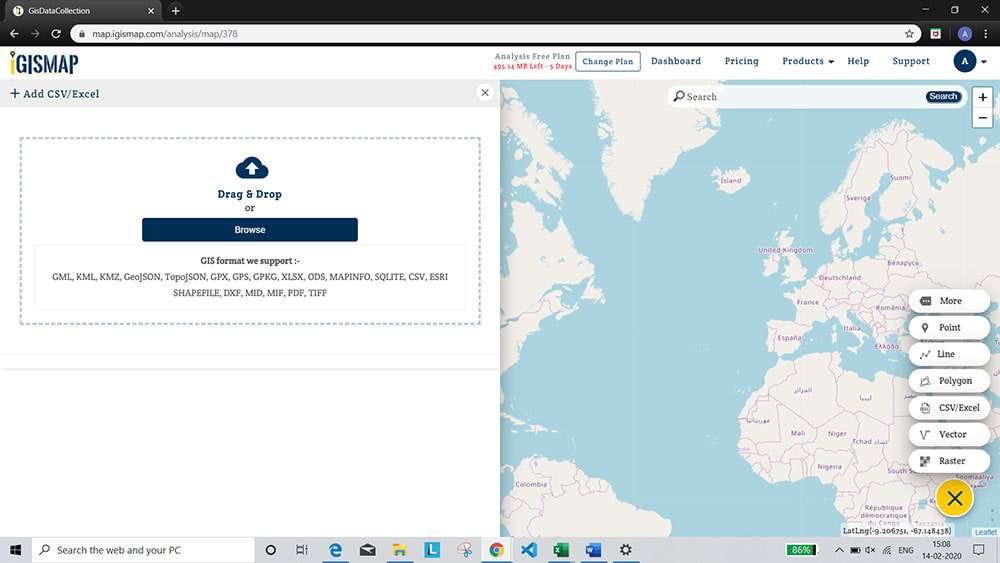
2. A plane map will appear. Now upload CSV/Excel data to the map.
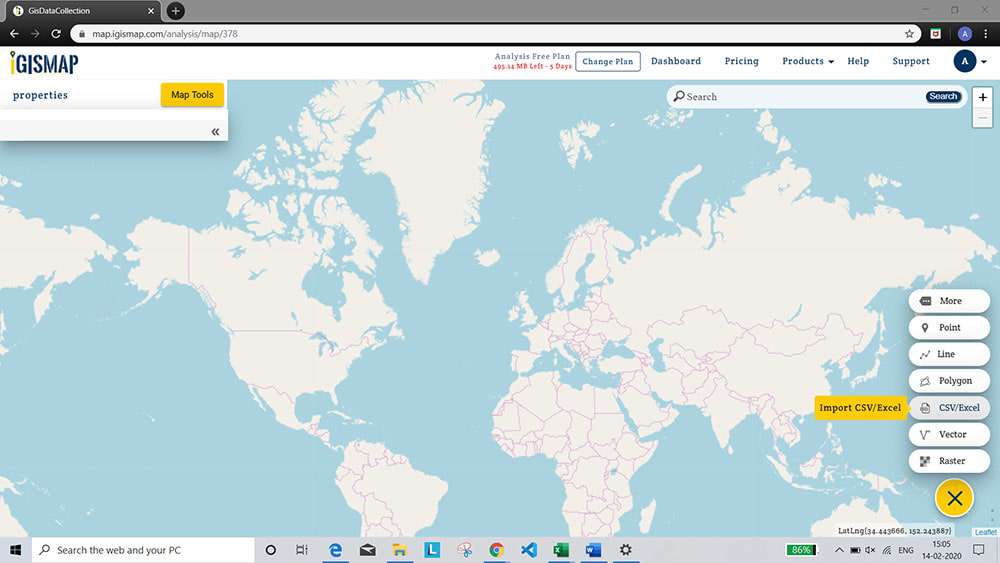
Drag & Drop your file or browse from the system.
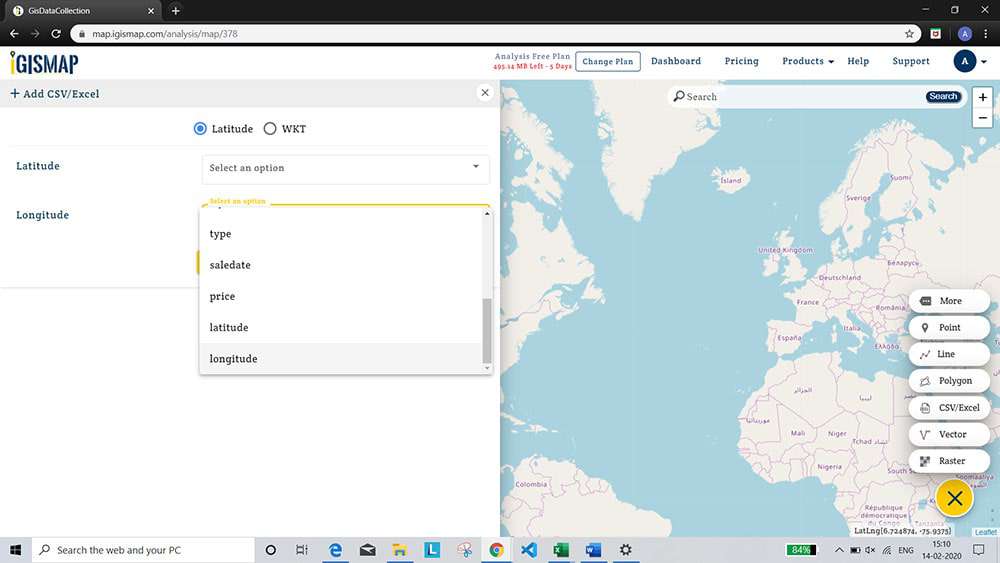
3. Now select the columns for Latitude and Longitude.
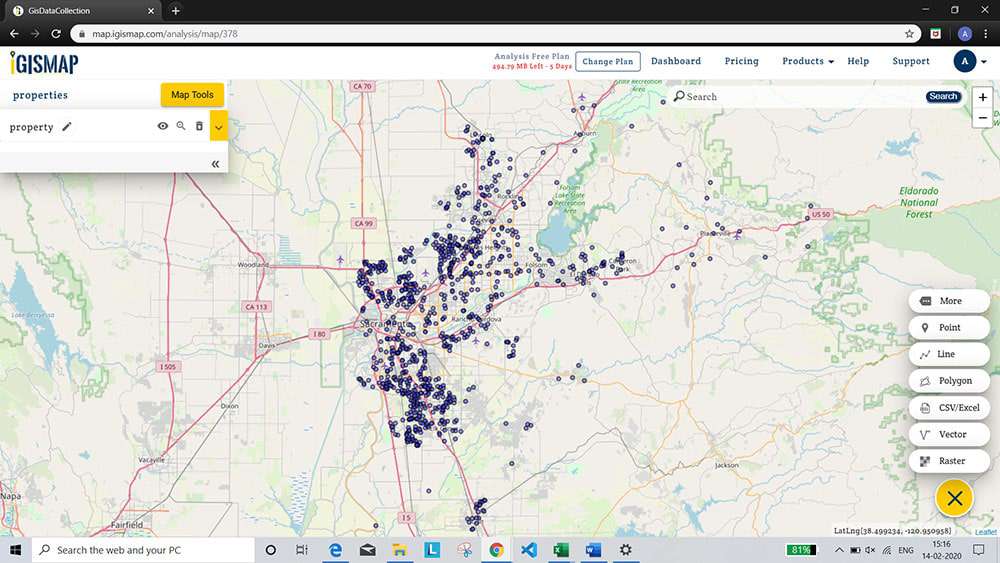
4. Once you upload the data you will automatically get a map layer which will represent this data.
Tip:- To zoom in and out use mouse dragger or zoom buttons on right top corner of screen.
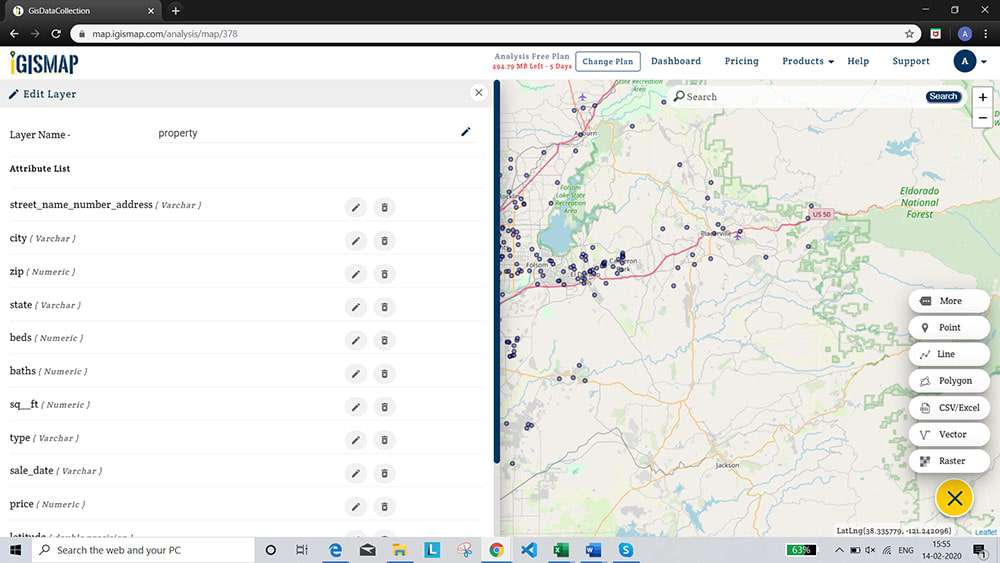
Note:- After making this map please check and correct datatype of your fields under the layer. To use all analysis tools and all features properly. Default datatype is varchar. Change them to proper and suitable datatypes. Click on edit icon near layer name.
You can see default data type is varchar change them to proper data type. i.e number for area size price and any numeric quantity, String for name, City name etc. And Varchar for data having both numbers and characters.

Alter or change the type of attribute data type.
Your Data is changed into a map. Zoom in and zoom out for more analysis.
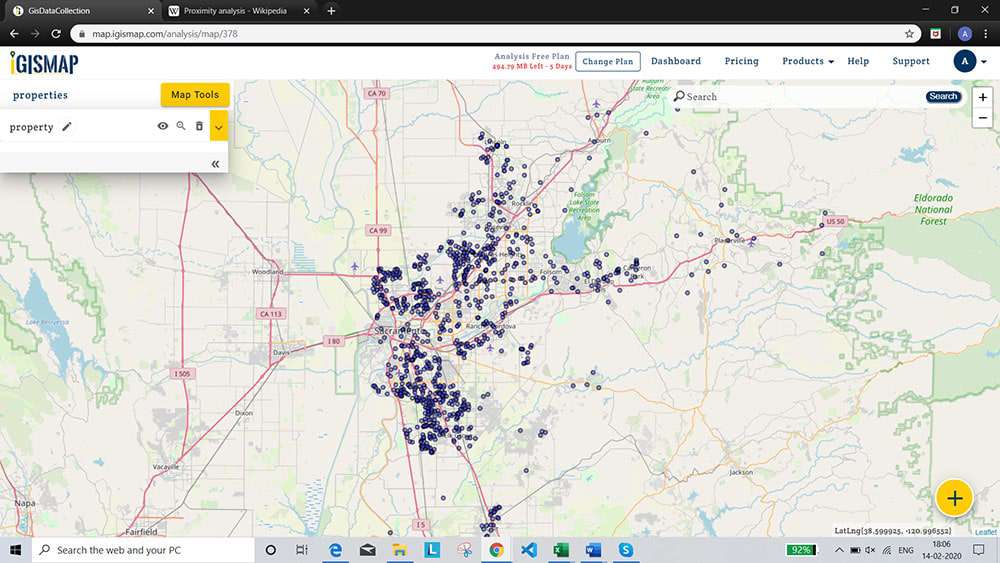
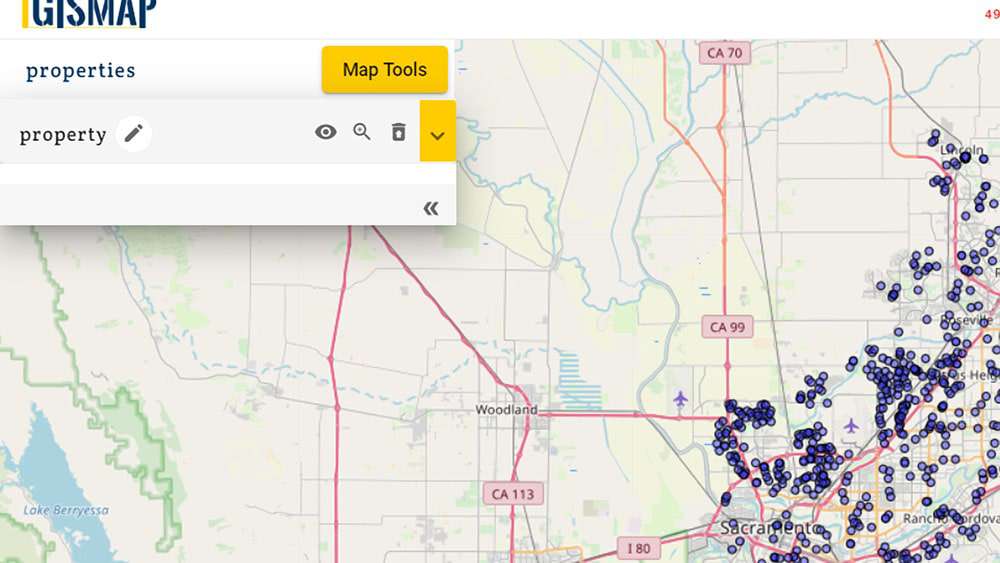
Your Data is changed into a map.
Create a Map using IGIS Map Tool.
Customize and style points to make it attractive and more meaningful.
Use proximity analyser and Query tools for analysis purpose.
You can also download it as a shapefile for further use.
You can share this map with others to show them data or to ask for contribution.