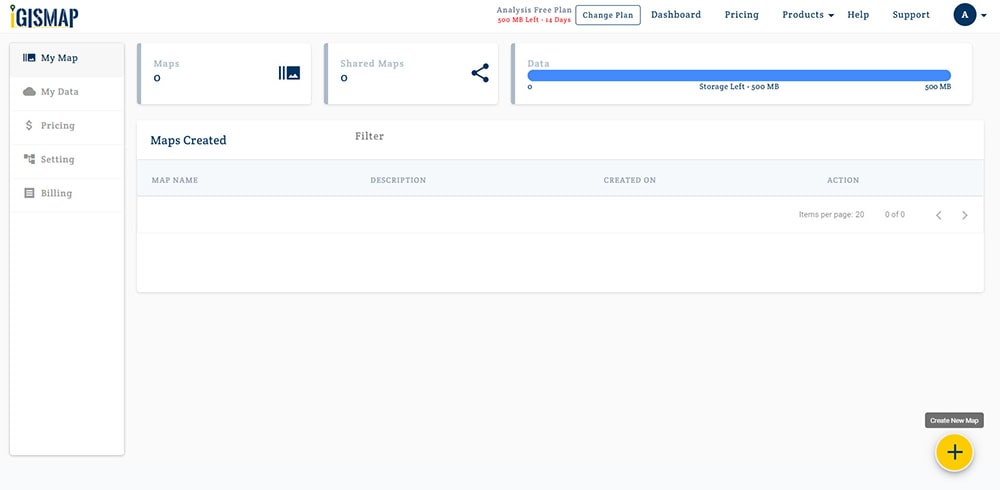
Login with email id and password and next screen will be the dashboard. For creating a map click on plus button.
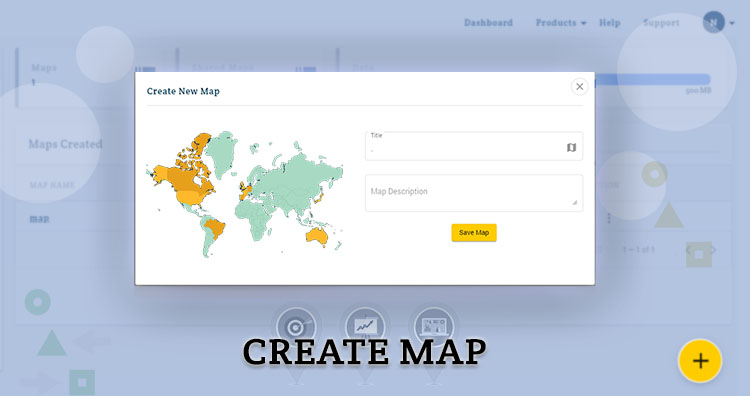
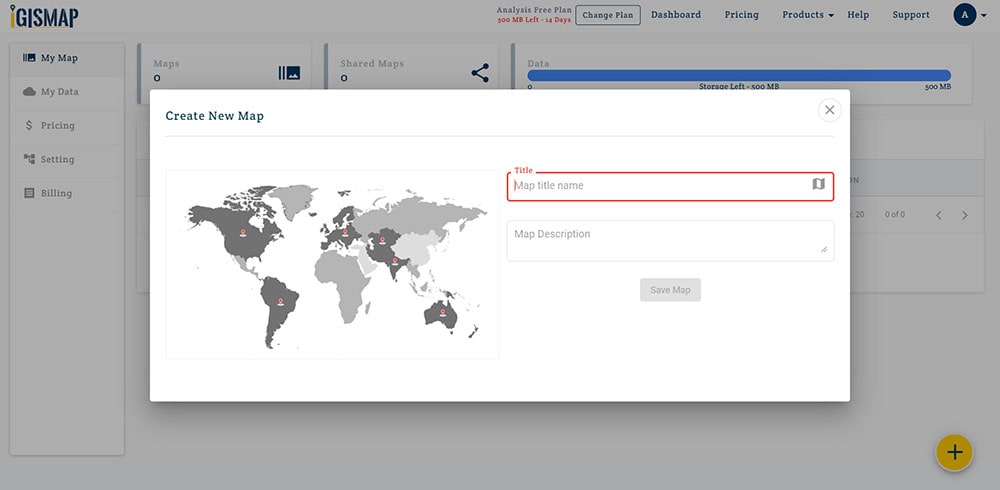
A modal will appear on the screen. Give a title to your map and write description if you want to write. In the last tap on create map.
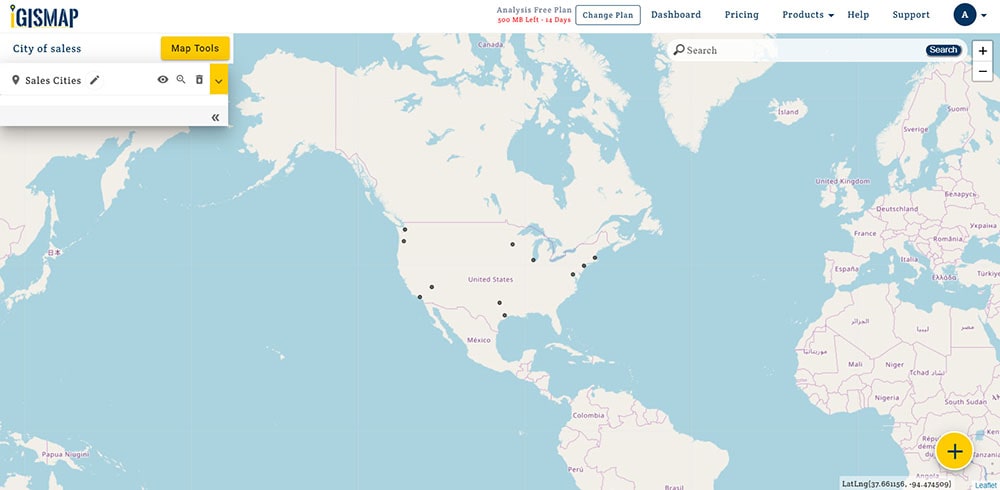
After creating map you will be redirected to map canvas. Here you can add layers to your map.
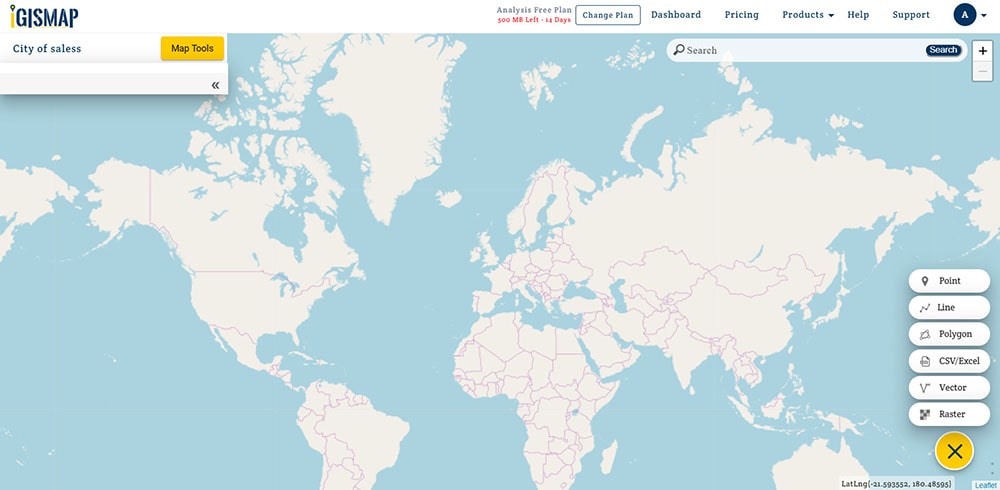
Vector data is split into three types : point, line and polygon data. Lets learn how to create a point, line and polygon layer in the map.
Create a Point Layer
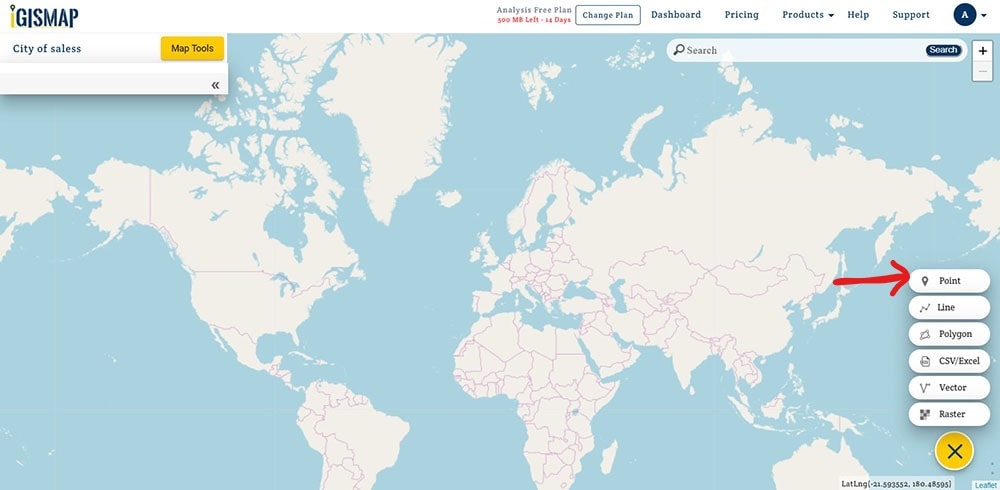
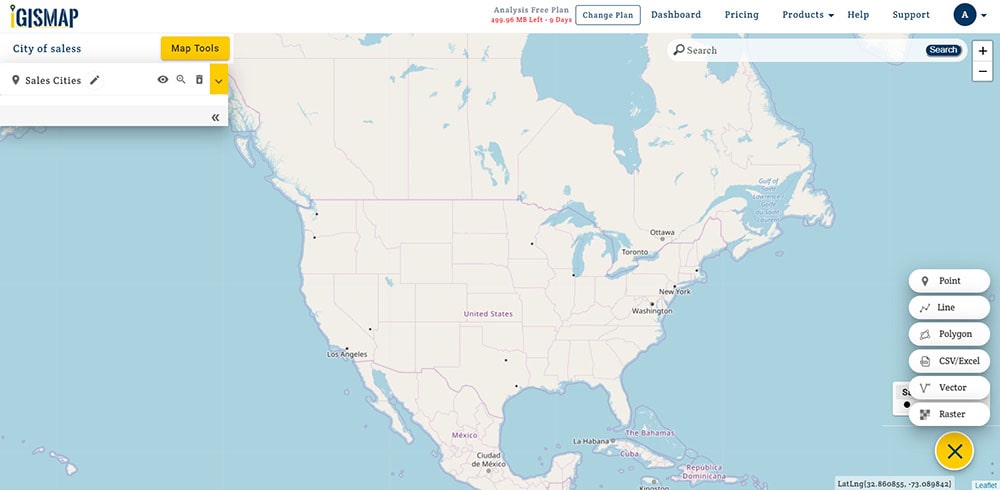
For creating a point layer click on plus button and choose Point.
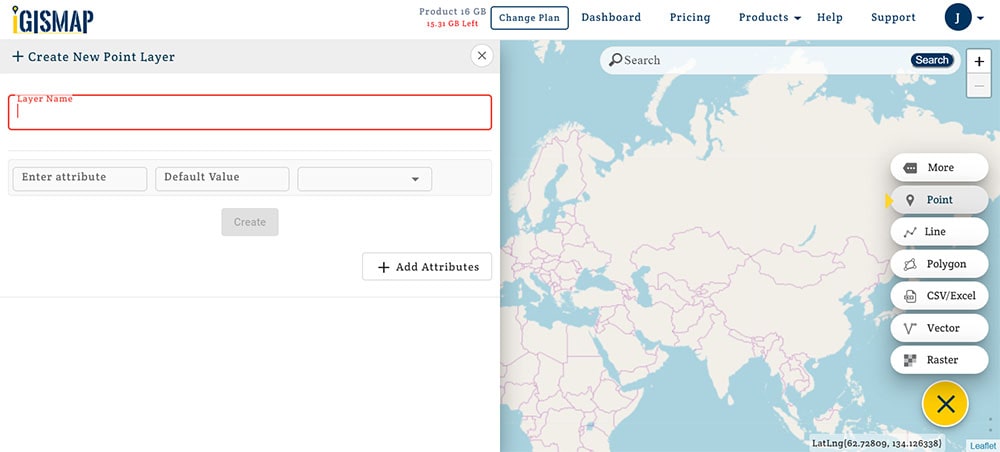
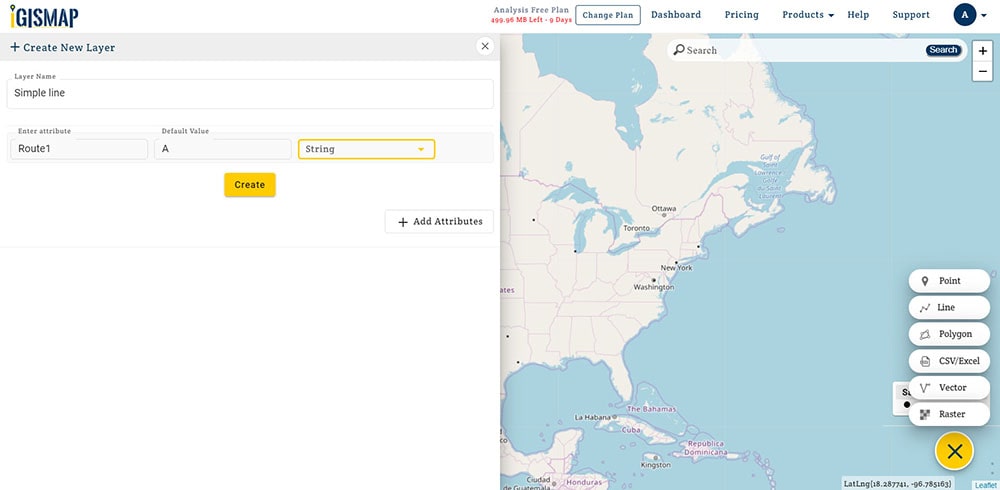
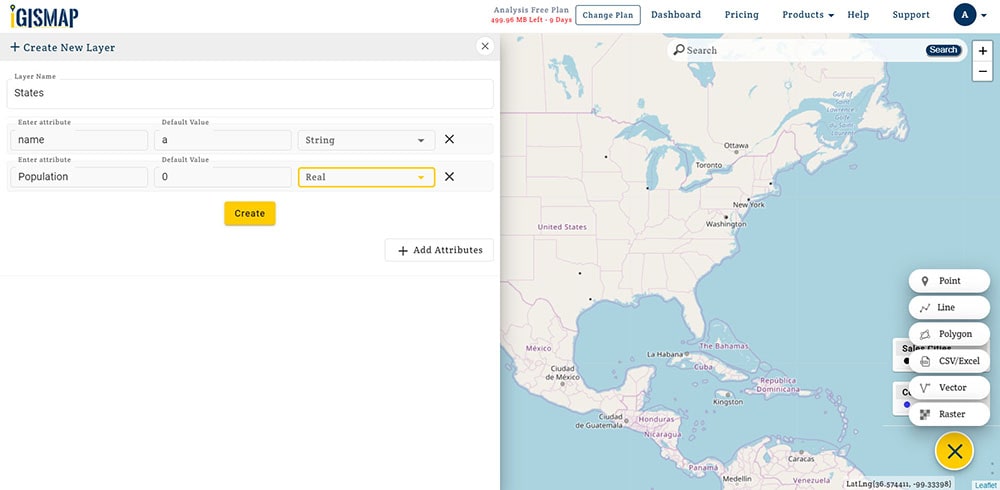
Give a name to point layer and enter attributes. For adding more attributes click on Add Attributes and create.
Click the drop down button for more option and choose Add Point. Locate the points on map. Every time you need to click on add point for new point.
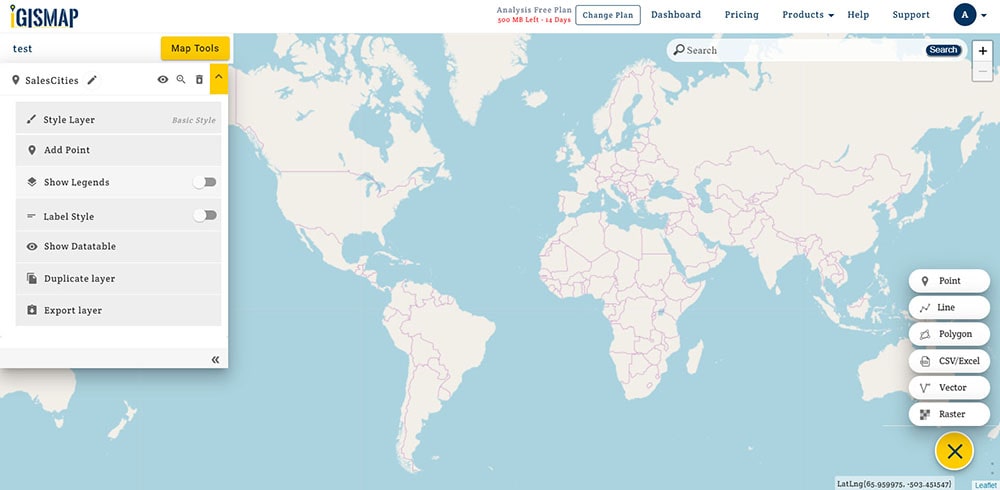
Use zoom in and zoom out for exact location and add point to that location. You can add multiple points in a layer. Points also can be added by uploading CSV/ Excel file.
(Zoom in for exact position) Click on the point (location) for edit in geometry or attributes. By editing geometry point location will be changed or altered.
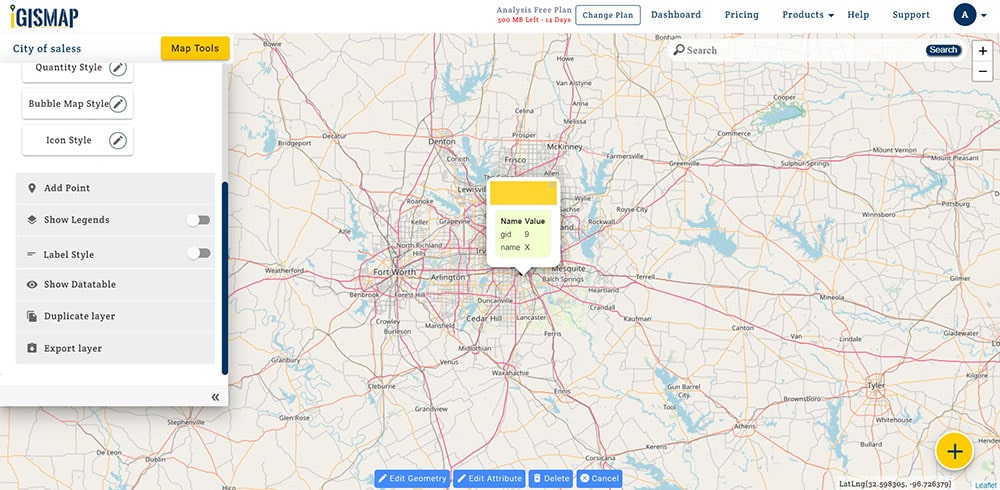
For detailed steps please check the video and create a map with point layer.
Create a Line layer
Line data is used as representing linear features. It have only one dimension. It shows roads, pipelines, route planning or to highlight anything on the map.
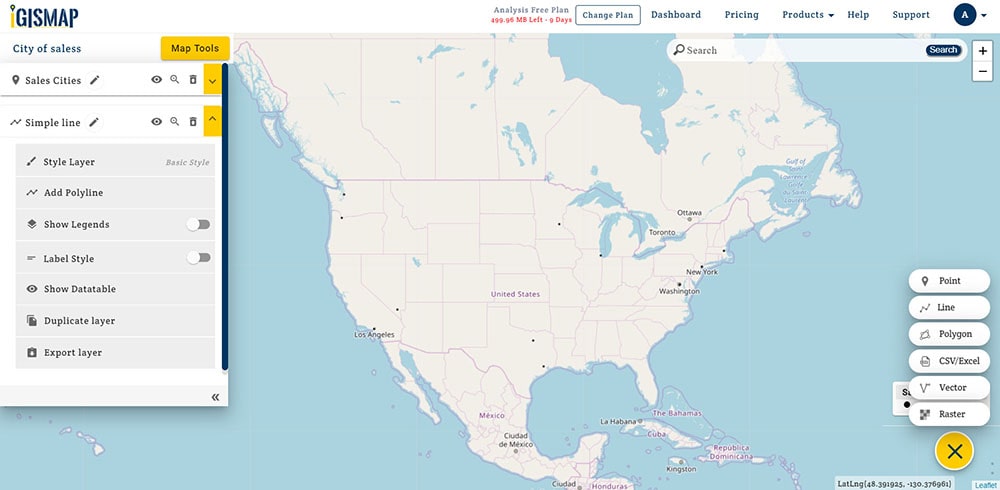
For creating line layer click on Plus button from the bottom right of the screen. Select line to draw line.
Give a name to the layer. Add attributes for the data.
In the layer panel/list click on drop down button and tap on Add polyline.
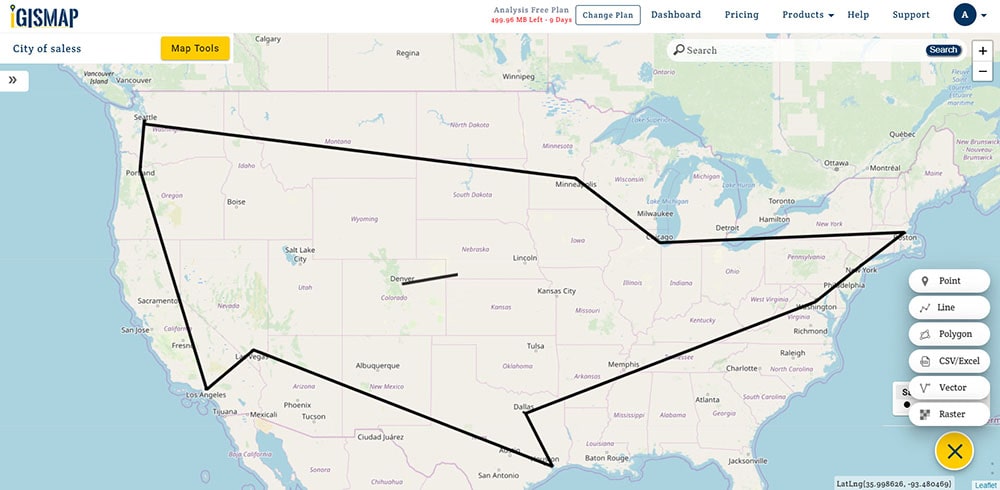
To draw a simple line. Click on the place/location where you want to start a line and then click on the place where you want end of line.
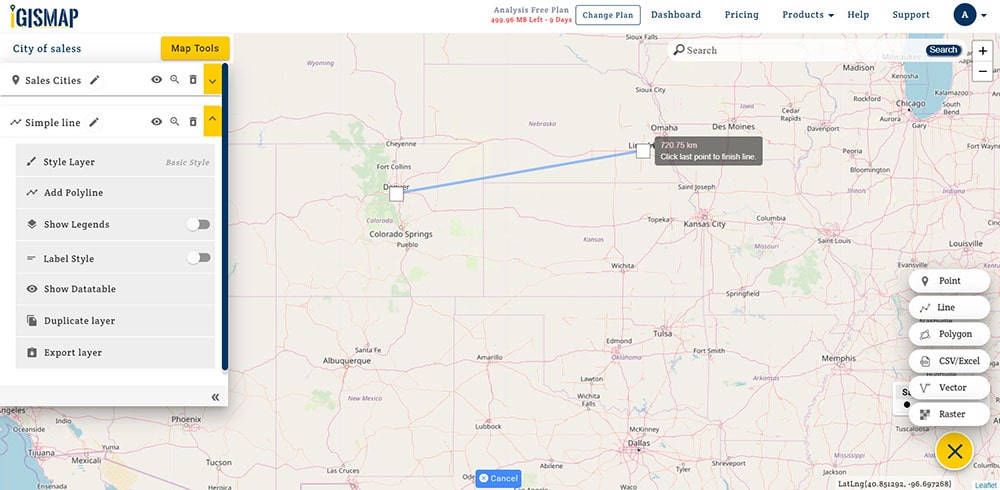
Again, click on the endpoint of the line you just created and a line will be made.
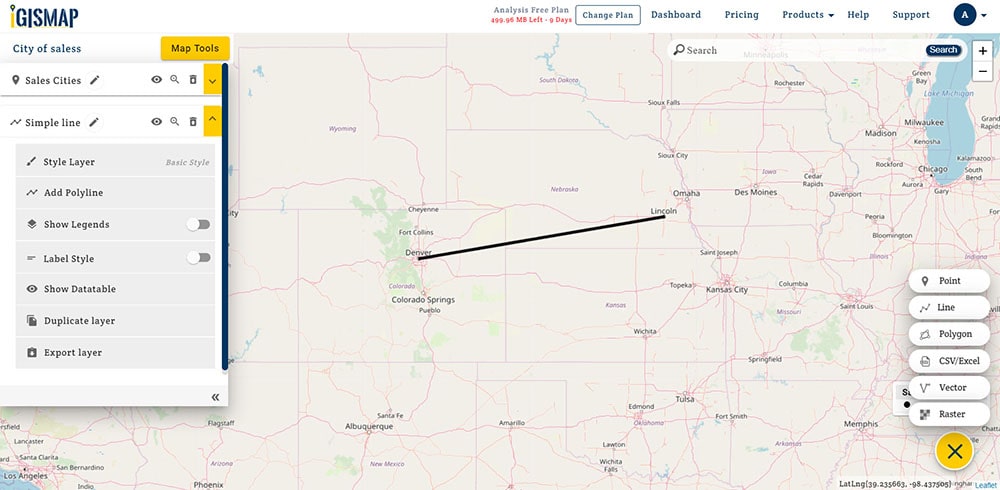
Using these steps you can create different types of lines and add in the map. .
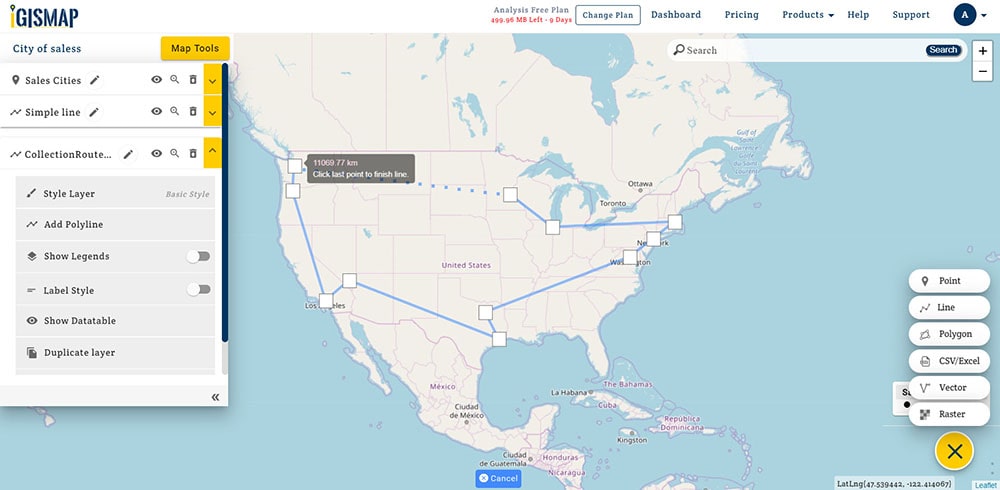
Similarly, we can add a polyline by clicking all the points from where the line turns. Polyline is used to create any shape that consists of only straight lines (that is connected at several points)
You can make line map more interactive and meaningful using labels, attributes and styling of line and also by adding attribute to the line.(For adding styles to line) Click on layer name.
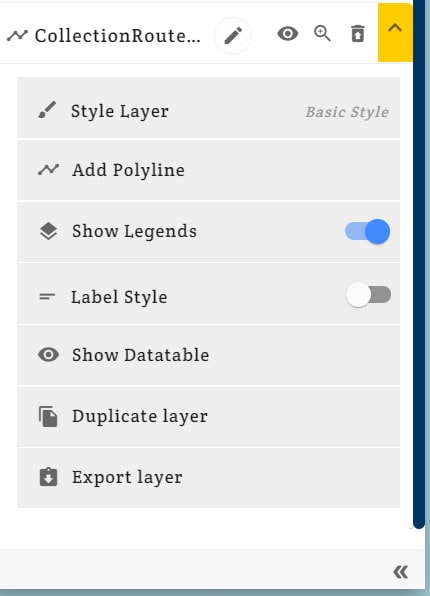
In the dropdown list choose style layer
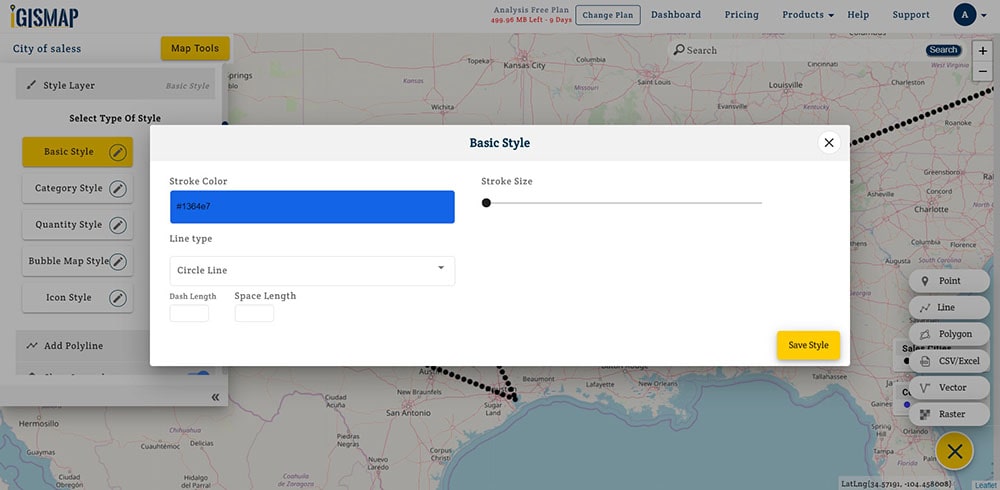
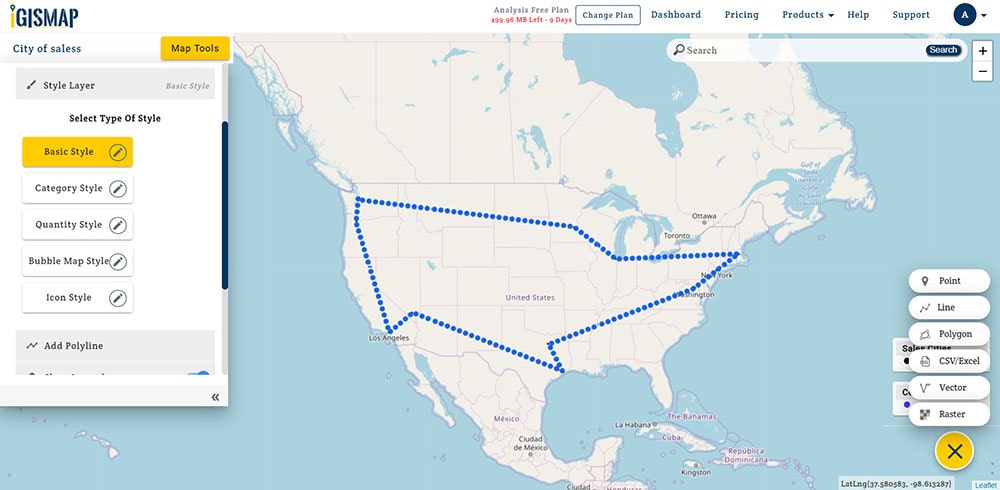
Change the color of line, you can change line type and stroke size (default size is one)
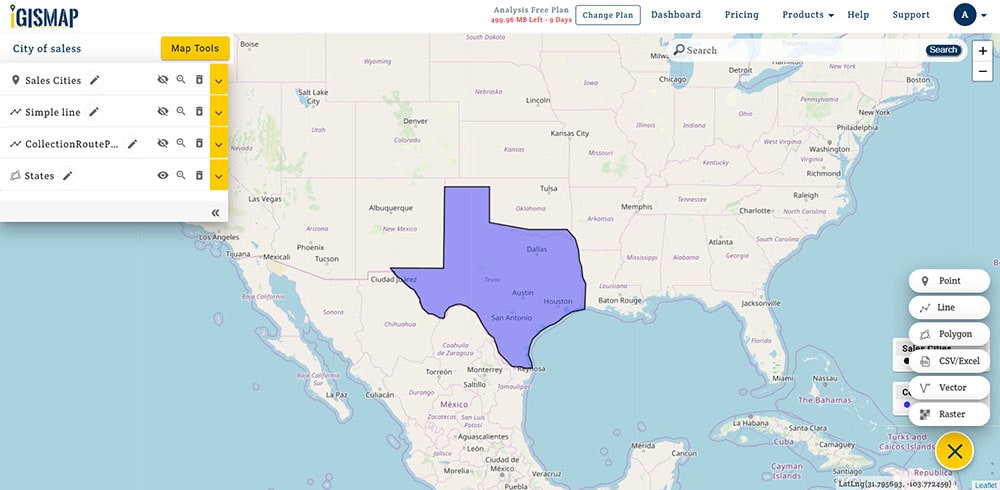
Create a Polygon Layer
Polygon shapefile is used to represent any feature or location on map like a agricultural farm, housing block or any piece of land. Click on + button. Select polygon to draw a polygon

After click on Polygon a modal will appear. Assign the layer name. Enter required attributes for the layer.
Tap on dropdown of layer and select add polygon. Click on the map location from where you want to start your polygon. It’s similar to line layer. As polygon is a closed shape so 1st point will also be last point of a polygon.
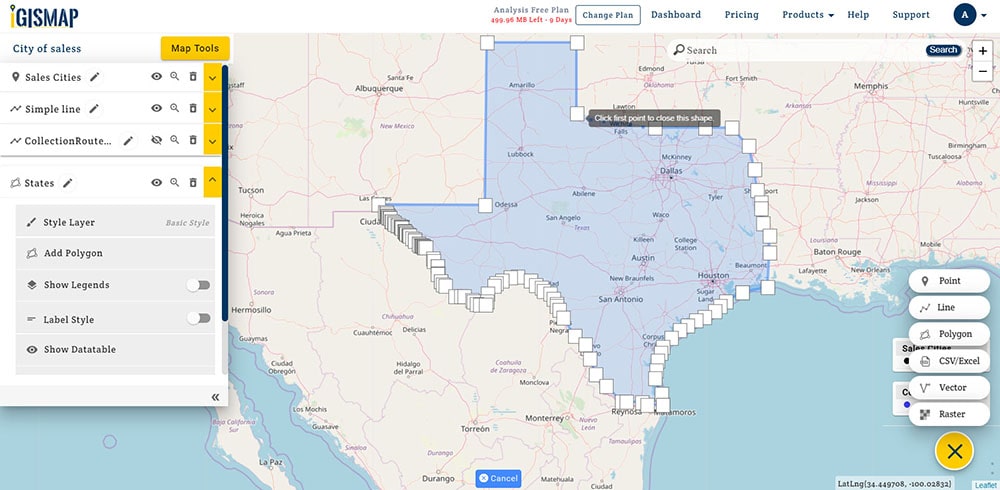
Here you can see the polygon on the map screen. It was just an example to show how to make polygons. Usually this is used for custom polygons like crop planning construction fields etc.