
In this article we are going to add legends to choropleth map with topojson Data using leaflet. Legends are the element of map that provides information about map with the help of symbols. Here symbol can be colour, shapes, figures etc. The choropleth map gives information using colours. Lets play around with : Create beautiful Legend map – leafletjs topojson. If you are very new to Leafletjs then before going through this article you should look over to Getting started with Leafletjs article and how to render topojson with leaflet js.
Dynamic Legend map – Leafletjs TopoJson
Lets get started with code. For this first we need to create a method getColor(d). The method takes “d” as parameter, which takes a specific value from topojson data, and then returns the colour value (in form of colour) after comparison. For instance, if d is greater than 5000 then return red color i.e ‘#FF0000’ otherwise return blue colour i.e ‘#0000ff’. Here colour codes are given in hexadecimal value you can give RGB value or colour name. We will create this function as:
function getColor(d) {
return d > 5000000 ? ‘#7a0177’ :
d > 200000? ‘#BD0026’ :
d > 80000? ‘#E31A1C’ :
d > 10000? ‘#FC4E2A’ :
d > 5000 ? ‘#FD8D3C’ :
d > 500 ? ‘#FEB24C’ :
d > 0 ? ‘#FED976’ :
‘#FFEDA0’;
}
Now to show the legend section on map, we need to create a division with the help of DomUtil and add that to the map. Here a variable name legend is created which is positioned to bottom right. The style “position: ‘bottomright’ “ is done using CSS. L.control is a base class for implementing map controls from leaflet javascript library. This handles positioning. All other controls extend from this class.
var legend = L.control({position: ‘bottomright’});
The above function i.e getColor() will be called once we add Legends on Map. for that we need to create an event of adding legends on map. onAdd() method, which is from leaflet’s control class returns the container DOM element for the control and add listeners on relevant map events. Here it takes value as function that returns HTML element (div) as like:
legend.onAdd = function (map) { }
Then DomUtil class has used. But what is DOM (data object model), connects web pages to scripts. It is object oriented representation of web pages, which can be modified with scripting language like javaScript. DomUtil works with Dom tree. Here create() method has used which is from leaflet’s DomUtil class. This method returns a HTML element and takes parameter as tag name and class name. Tag name to create that element on document and class name style that element. Here HTML element is division and two classes are given as info and legend. An array name grades is created with value given by getColor(d) method.
var div = L.DomUtil.create(‘div’, ‘info legend’),
grades = [0,500,5000,10000,80000,200000,5000000];
To add field and colour in legend on map, a for loop has written. This shows variable i has initial value as zero and condition is as, “if variable i is less than length of array grades then loop will run and after one cycle increment will take place”.
HTML element div has styled inside loop having background colour values from getColor() method and &ndash is HTML entities used for typography.
for (var i = 0; i < grades.length; i++) {
div.innerHTML += ‘<i style=”background:’ + getColor(grades[i] + 1) + ‘”></i> ‘ + grades[i] + (grades[i + 1] ? ‘–’ + grades[i + 1] + ‘<br>’ : ‘+’);
}
return div;
};
The following statement adds the legends on map i.e:
legend.addTo(newMap);
As in create() method we have used info and legend class and that classes are designed inside style HTML tag i.e as :
<style>
.info {
padding: 6px 8px;
font: 14px/16px Arial, Helvetica, sans-serif;
background: white;
background: rgba(255,255,255,0.8);
box-shadow: 0 0 15px rgba(0,0,0,0.2);
border-radius: 5px;
}
.legend {
background-color: “black”;
line-height: 25px;
color: #555;
width: auto;
}
.legend i {
width: 18px;
height: 18px;
float: left;
margin-right: 8px;
opacity: 0.7;
}
</style>
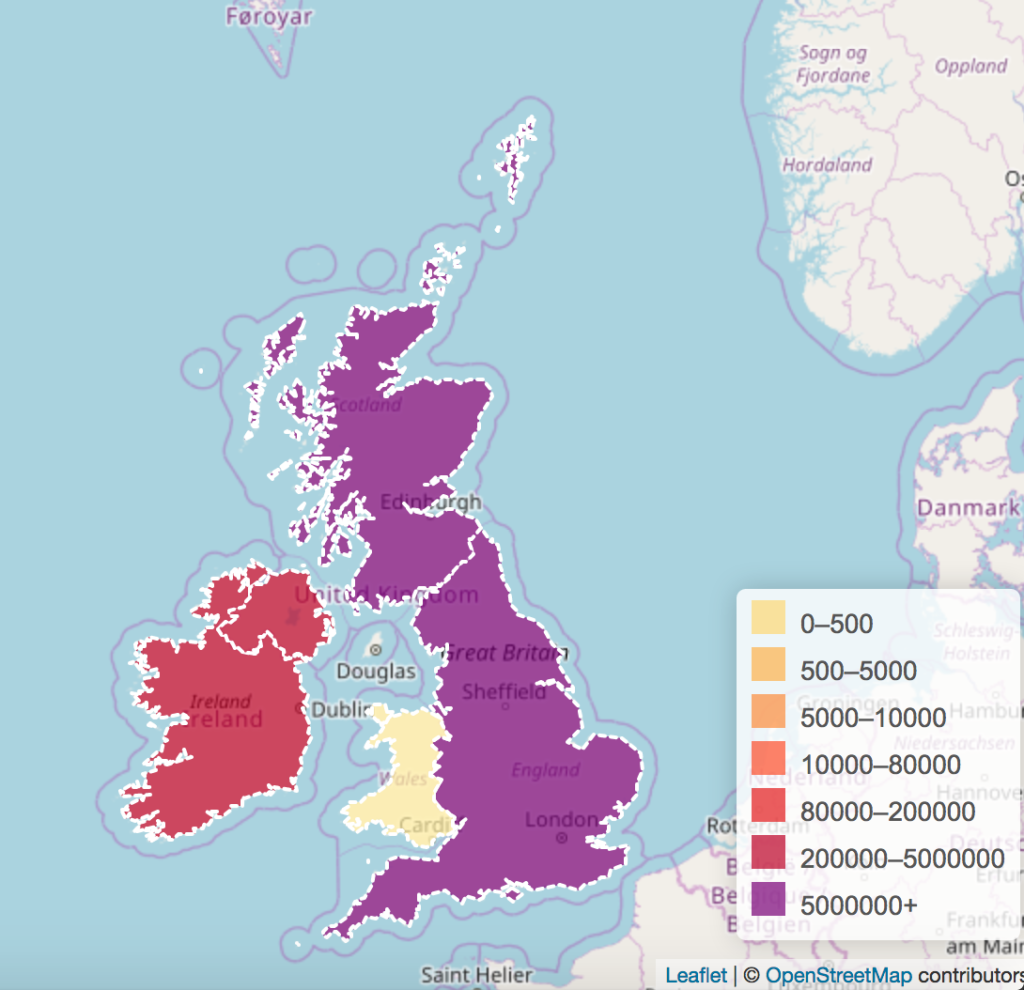
Here is how the output will look like. I had taken UK topojson file. If you have shapefile to geojson or kml file, you may look over to an article to convert shapefile to TopoJson or Geojson to Topojson Conversion. If you have Kml file then you can convert the kml file to Shapefile and then to TopoJson file.
This will finally make you to create dynamic legends with leafletjs library in Mapping system. I hope article helped you. If you find any problem in creating dynamic legends, do comment below in the box provided, we will discuss and solve the issue.