GIS helps users to understand patterns, relationships and geographic context. It benefit includes improved communication and efficiency, as well as improved management and decision-making. GIS combines datasets with maps, integrated regional datasets with any type of descriptive information or data. It provides mapping and assessment prerequisites for technology and almost every industry.
Visualization and intepretaion of data is what makes GIS a beautiful and interesting fields in data analytics. Science of visualization is the core essence in the art of cartography and mapping. Any type of geospatial features presented in the map with proper color combination, accurate size and location helps in better image interpretation. Quantity and category based representation of spatial features are the common visualization styles used in GIS.
IGISMap Styling Tools
IGISMap is a web platform providing multiple GIS applications that are most important in the field of geospatial analytics. The peculiarity of IGISMap in the GIS Industry is its UI/UX that helps the user to perform effortless geospatial operations. IGISMap provides the following styling tools:
- Basic Style
- Category Style
- Quantity Style
- Bubble Style
- Icon Style
Among the styling options listed above – Basic, Category and Quantity styling options are used to style polygon and points, whereas Bubble Style and Icon Style are used to symboloze point GIS data. Basic Style will give any single color for the while GIS layer. Quantity Style is used to visualize the GIS data quantitatively. And Category Style will style your GIS map with separate colors assigned to each category of features
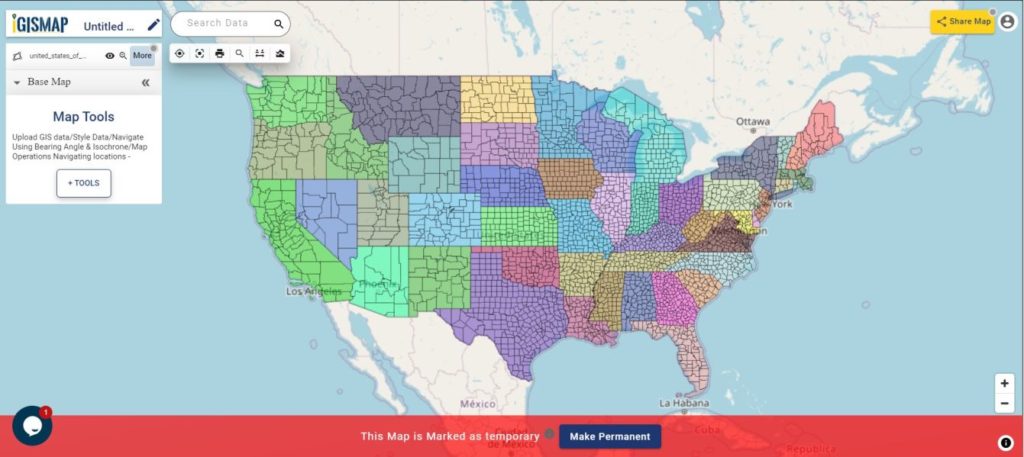
In this article we will talk about Category Style tool of IGISMap and how it can be used to categorically visualize your polygon GIS data like the following.
Add your GIS data
For the demonstration, let’s add county boundary polygon data of USA from IGISMap GIS data collection. For this let’s use Add GIS Data tool of IGISMap.
Click to open https://story.mapog.com/app/tools/vector Upload Vector File tool.
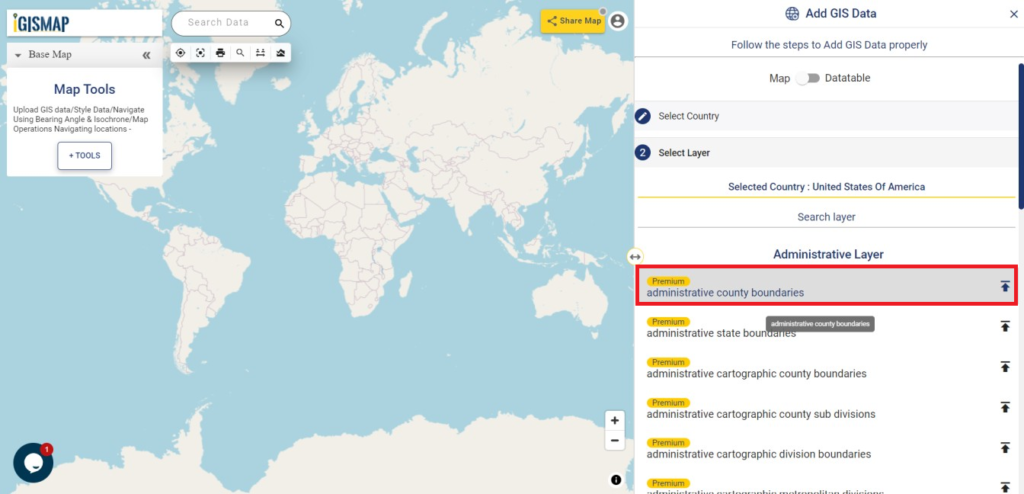
After opening the Add GIS Data tool, in the Select Country section we will select United States of America. Then Search Layer section opens with the list of GIS data of USA, where we need to select ‘administrative county boundaries‘.
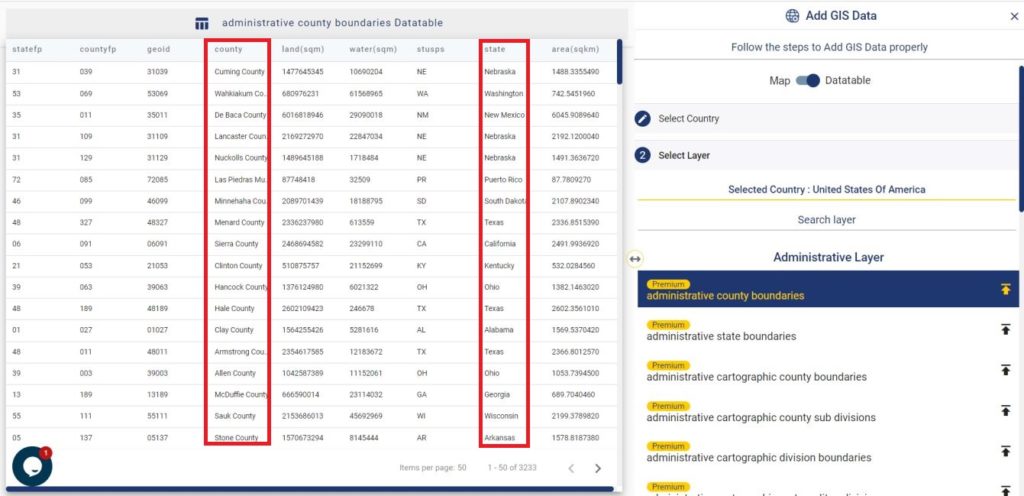
Before adding this data, lets check the data table of this data and verify the attribute field which we need to categorize this data. Switch the view from Map to Datatable and review the attribute fields. Here we are going to categorize the polygon features of county boundaries based on the state which it belongs to.
As you can see below, we have the attribute field for counties and the attribute field with states it belongs to.
Since we have confirmed the data, lets continue downloading. First click the download icon beside the data name and then click the Add Layer button in the next section that opens.
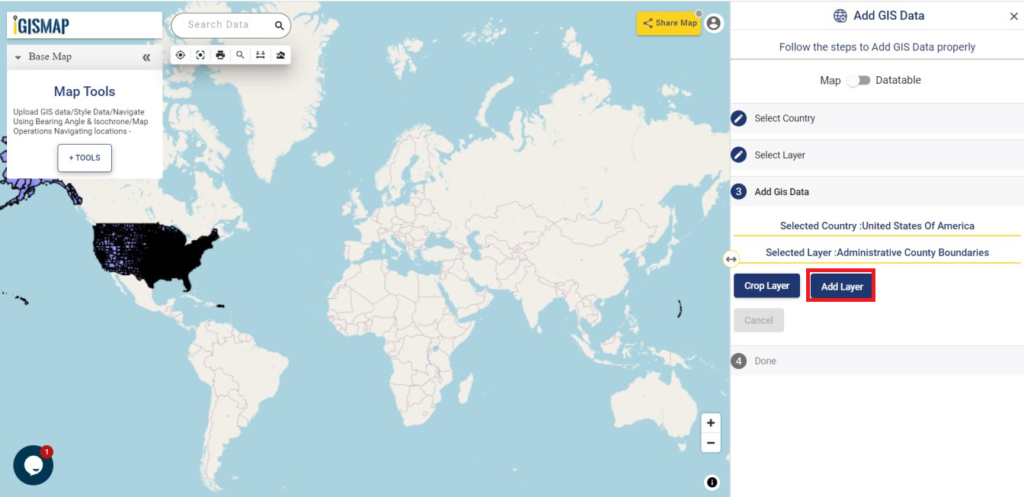
Now the layer is published in the map with the name ‘united_states_administrative_county_boundaries‘
Click here – Download USA County Boundaries GIS Data
Open IGISMap Category Style tool
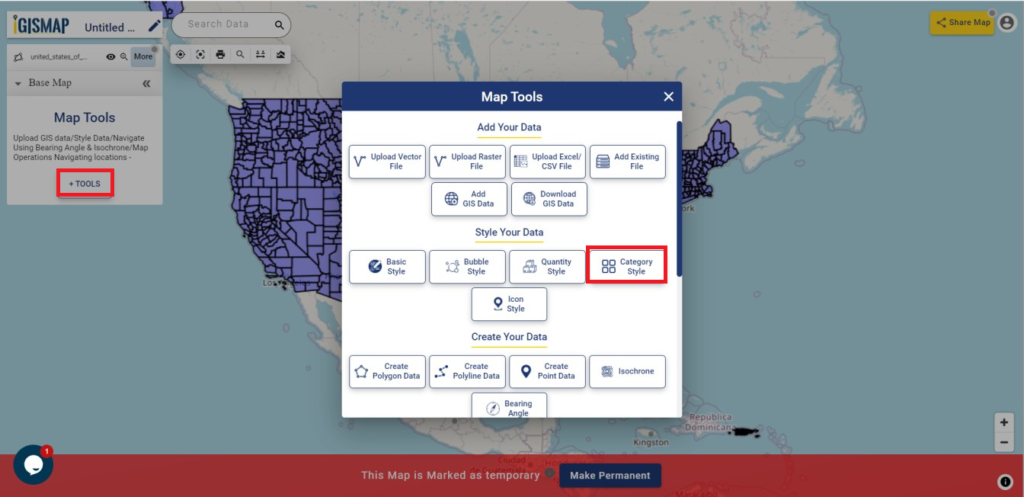
After adding the input GIS data from Add GIS Data, we can style the counties categorically using Category Style tool. For accessing the tool, click Tools button at the upper left side of screen to open the map tools popup. Then select Category Style tool listed under Style Your Data section.
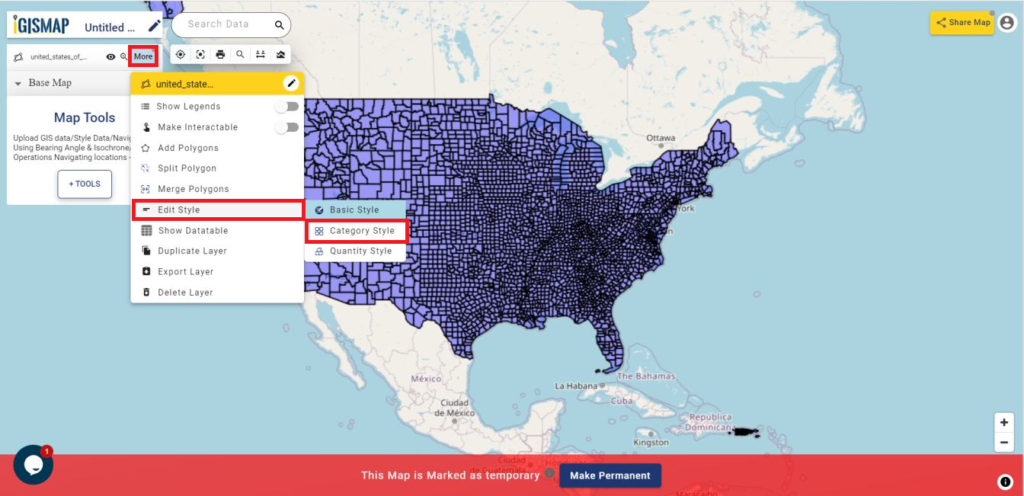
We can also open the Category Style tool by going to the More option of input point data and choose the Category Style from the Edit Style option.
Styling GIS data categorically
Then the tool is appeared on the screen of IGISMap.
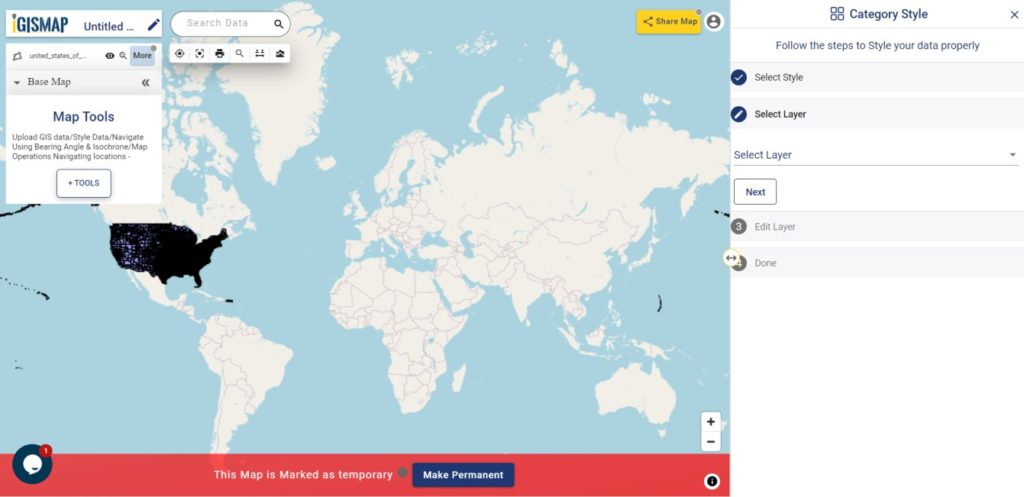
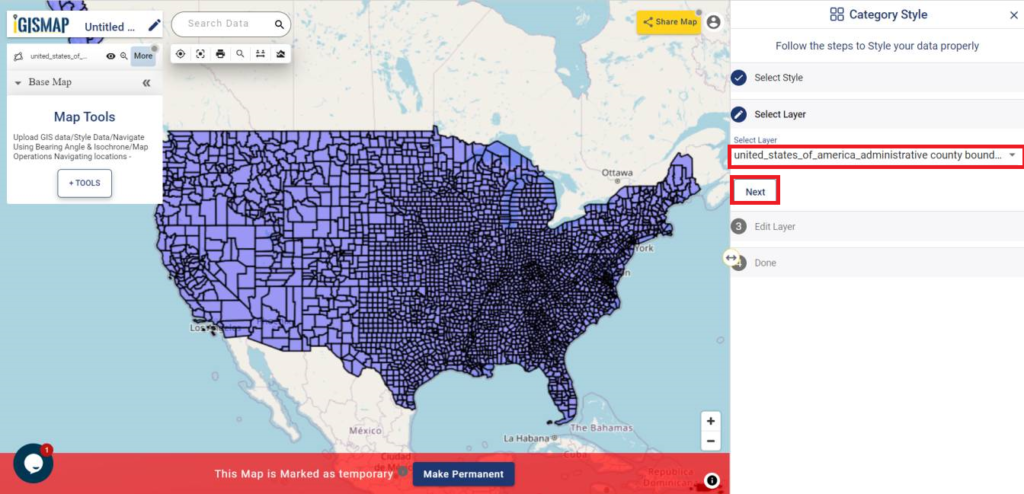
Then the tool appears and we have to select the layer from Select Layer section which is the ‘united_states_administrative_county_boundaries‘ data that is published in this map and then we have to click Next option.
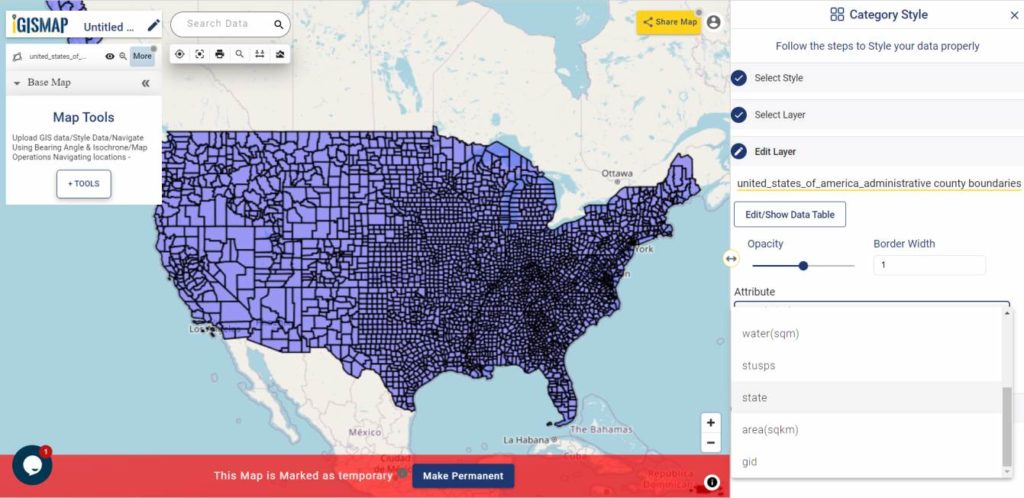
After clicking Next, in the Edit Layer section, we can change the style as we want. In this section we can can change Opacity and change the Border Width as required. Now in the Attribute field, select state field to categorize the counties based on its individual attributes values.
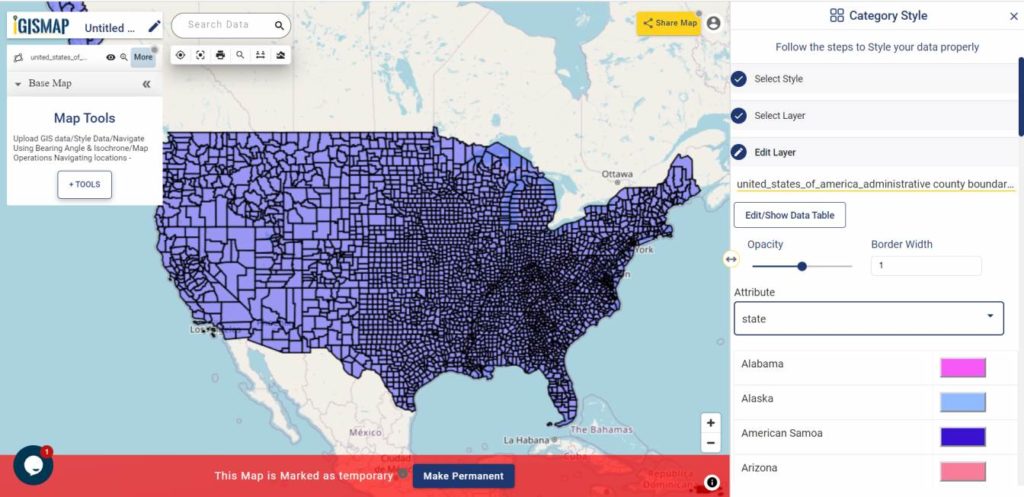
After selecting the required attribute field, all individual values will be listed with different colors assigned for each category.
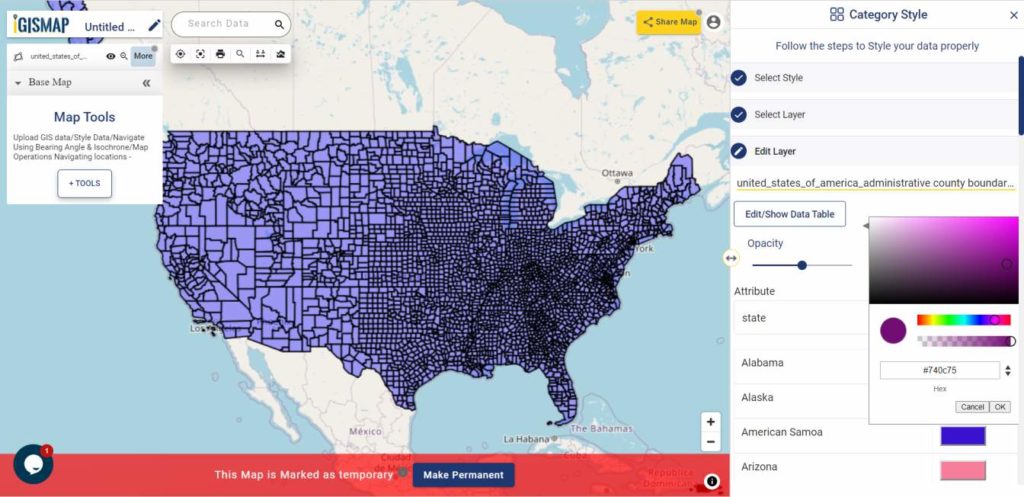
We can change the color for each category by the color and choosing the right color. Then we have to click OK.
After changing all color of the attributes we have to click on Save Style for styling the map categorically.
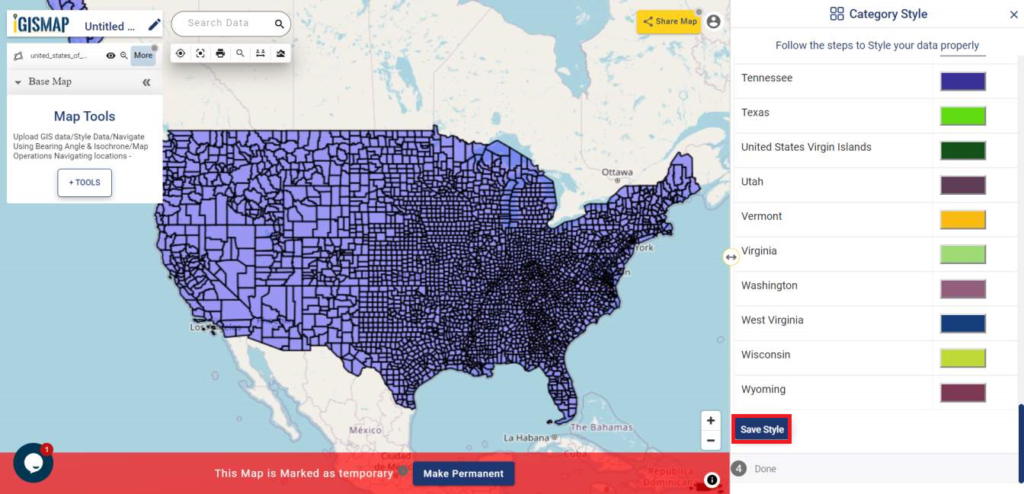
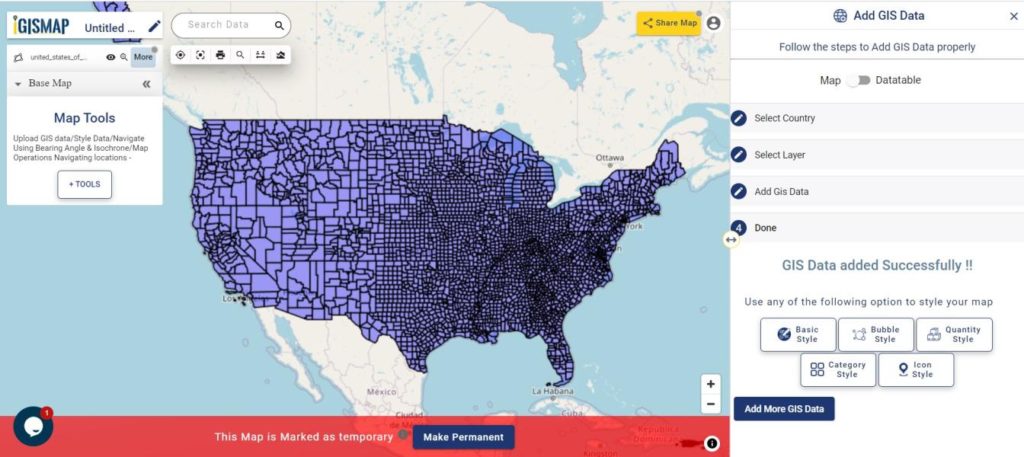
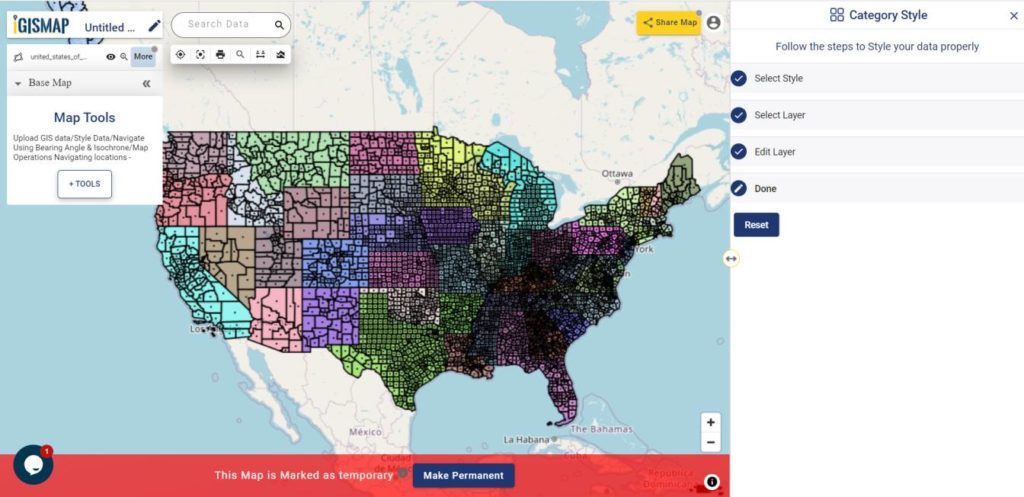
Now as you can see the map is converted into categorical style and the output map is shown.
For better view and make your data more interactive in the map, go to More and enable Make Interactive option.
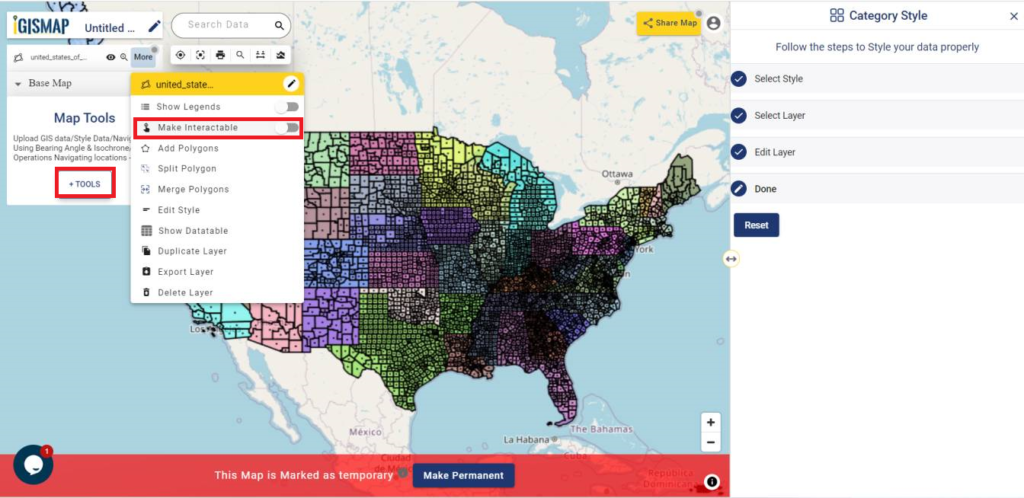
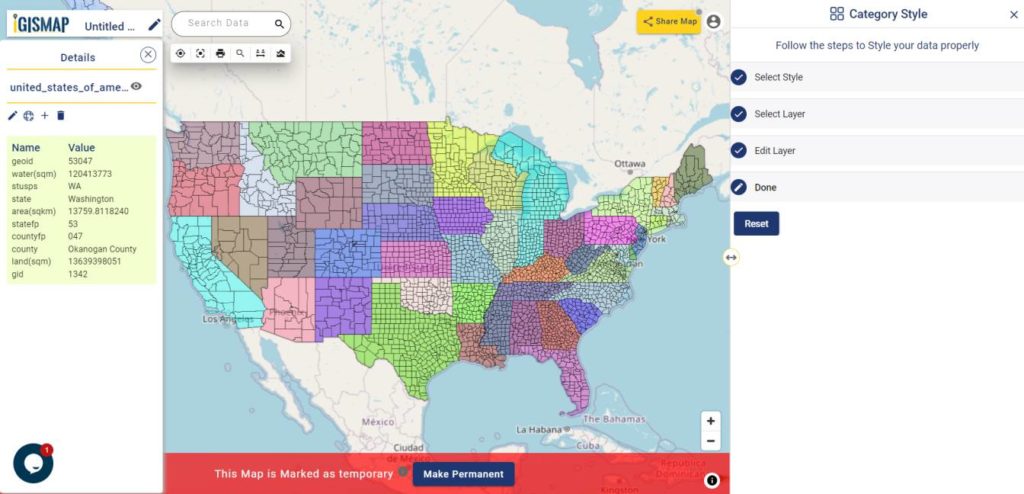
Now as you see below, the USA county level boundaries GIS data is better visualized in state based categories and the map got more interactive.
You can share your map with others in public or private mode. Article Share your Map will help you understand more about Share Map feature of IGISMap.