GIS helps users to understand patterns, relationships and geographic context. It benefit includes improved communication and efficiency, as well as improved management and decision-making. GIS combines datasets with maps, integrated regional datasets with any type of descriptive information or data. It provides mapping and assessment prerequisites for technology and almost every industry.
Visualization and intepretaion of data is what makes GIS a beautiful and interesting fields in data analytics. Science of visualization is the core essence in the art of cartography and mapping. Any type of geospatial features presented in the map with proper color combination, accurate size and location helps in better image interpretation. Quantity and category based representation of spatial features are the common visualization styles used in GIS.
IGISMap Styling Tools
IGISMap is a web platform providing multiple GIS applications that are most important in the field of geospatial analytics. The peculiarity of IGISMap in the GIS Industry is its UI/UX that helps the user to perform effortless geospatial operations. IGISMap provides the following styling tools:
- Basic Style
- Category Style
- Quantity Style
- Bubble Style
- Icon Style
Among the styling options listed above, Bubble Style and Icon Style are used to symboloze point GIS data, whereas Basic, Category and Quantity styling options are used to style polygon and polyline GIS data. Bubble Style is used to style the point GIS data quantitatively and Icon Style is used to style point GIS data with the icon or categorically by assigning separate icon for each categories.
In this article, we will talk about how to categorically represent point GIS data using Icon Style tool of IGISMap and will walk through the steps to style your data categorically like the following
Uploading the data
For the demonstration, we will upload the point GIS data of administrative buildings locations in London city and categorize it based on types. First lets upload this data using Upload Vector File tool of IGISMap.
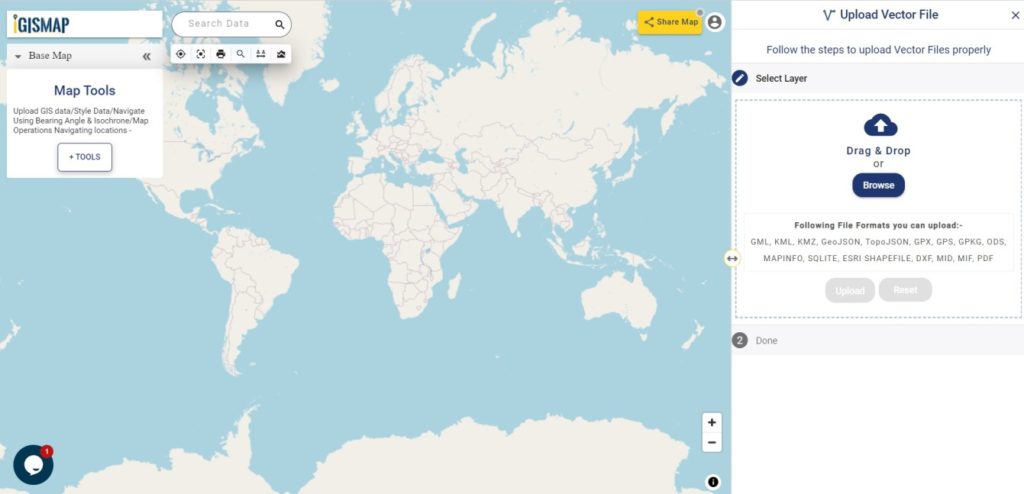
Click https://map.igismap.com/upload-vector-files to open Upload Vector File tool.
After opening the Upload Vector File tool, here we can upload required the vector data in any of the following vector formats.
GML, KML, KMZ, GeoJSON, TopoJSON, GPX, GPS, GPKG, ODS, MAPINFO, SOLITE, ESRI SHAPEFILE DXF MID. MIF, PDF
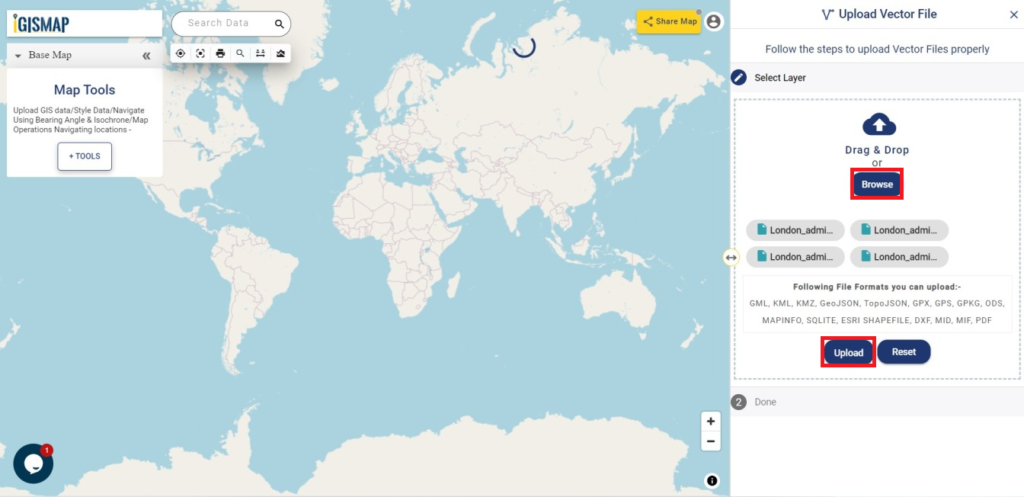
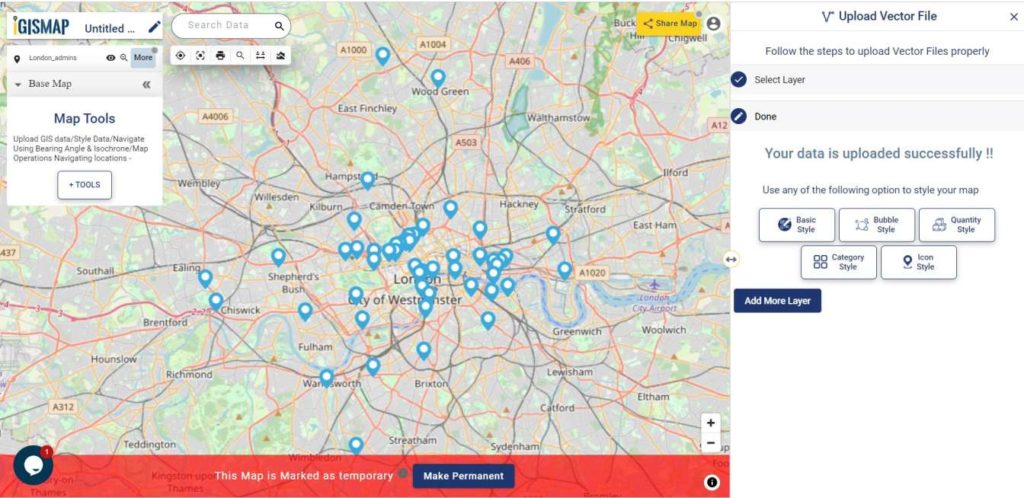
In the Select Layer section we have to click on Browse and select the input file from the system, which is the GIS data of administrative building locations in Lonndon named as London_admins. After opening the file, click Upload.
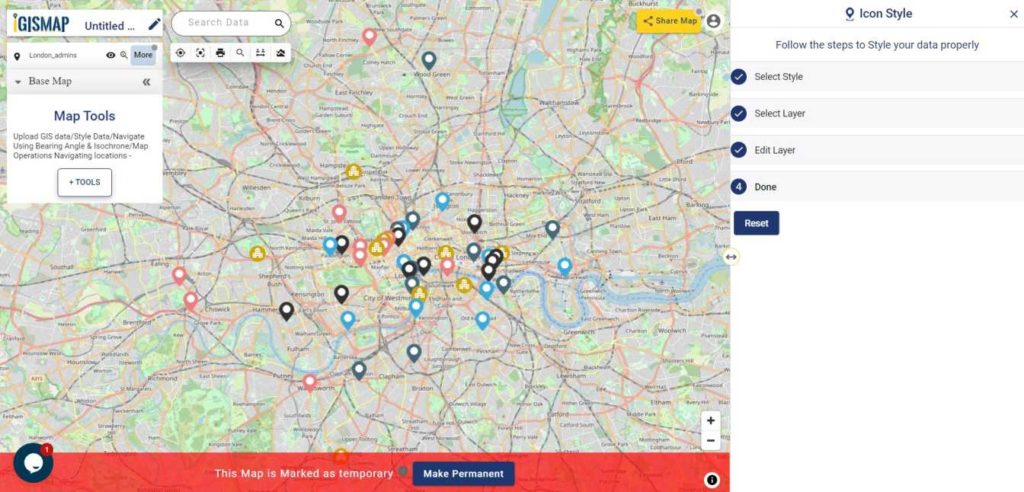
After uploading, input GIS data will be visible on the IGISMap screen, represented by default icon style as shown below.
Open IGISMap Icon Style tool
After adding the input GIS data, we can style the points categorically using Icon Style tool. For accessing the tool, click Tools button at the upper left side of screen to open the map tools popup. Then select Icon Style tool listed under Style Your Data section.
We can also open the Icon Style tool by going to the More option of input point data and choose the Icon Style from the Edit Style option.
Styling point GIS data categorically
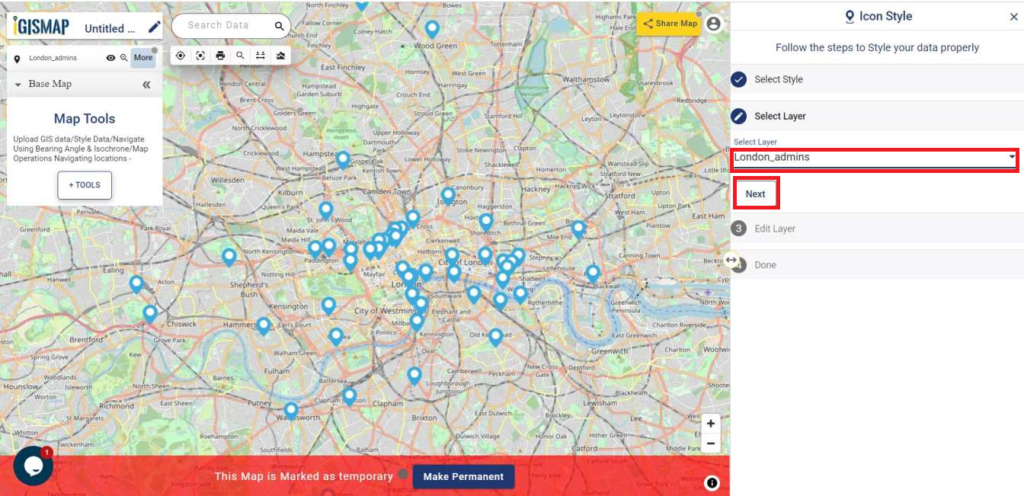
After the tool appears, we have to select the layer from Select Layer section which is the London_admins data that is published in this map and then we have to click Next option.
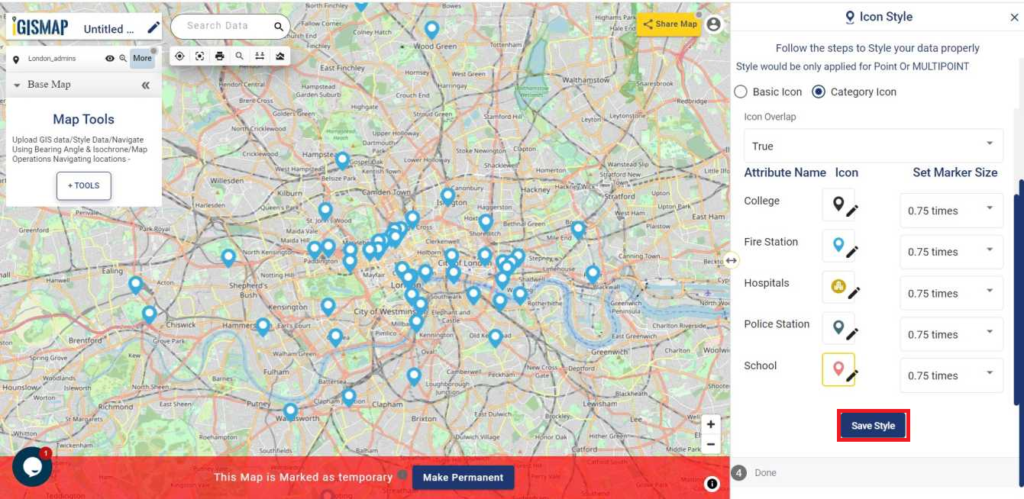
Then the Edit Layer section is appeared. Here we have to choose Category Icon. Now in the Attribute field, select admin field to categorize the point data based on its individual attributes values. You can also assign a default icons size to applied for every icon style in the Set Market Size box.
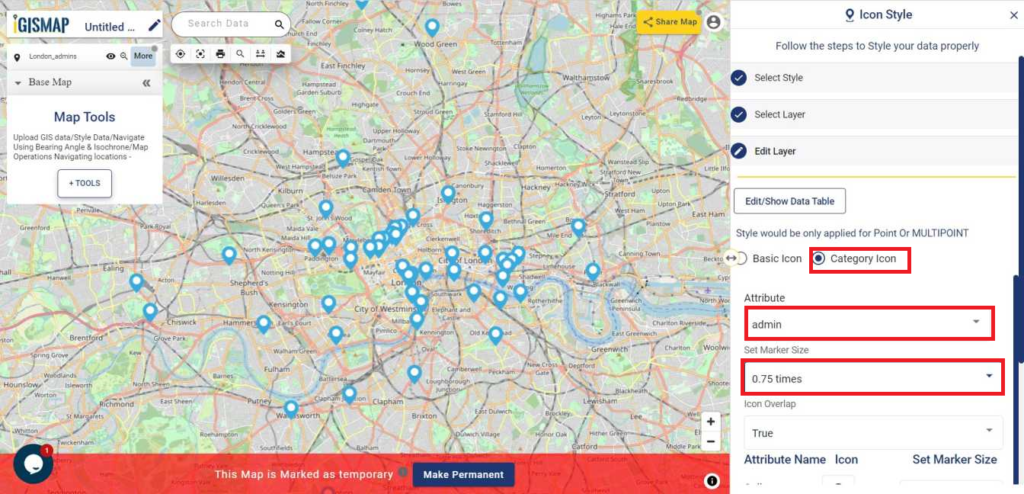
In the Icon Overlap, you can change the option between True or False. Choose True if you want the icons to be overlapping when the map is zoomed out. Select False if you want to see every point icons any zoom extend of the map.
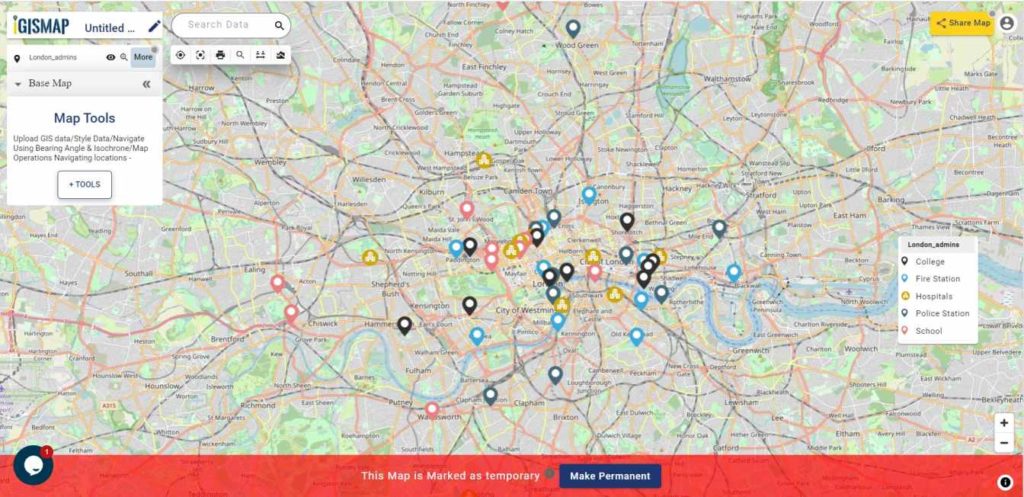
After selecting the required attribute field, all individual values will be listed with different icons assigned for each category, with default marker size. We can change the icons for each category by selecting the edit option and choosing the right icon from the list provided. We can also assign appropriate marker size for each category at Set Marker Size section.
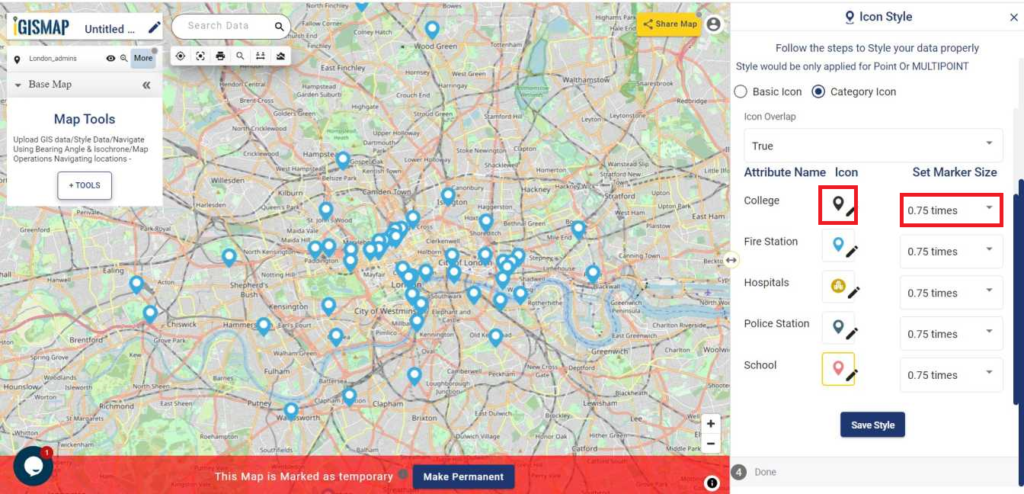
After editing we have to click on Save Style for styling the point data.
Following all the process we get the desired output on the screen of IGISMap.