
Need accurate coastal and marine boundary information? Now you can Download Maritime Boundary Data with ease using GIS Data by MAPOG. This intuitive platform supports over 15 GIS formats, including Shapefile, KML, GeoJSON, and MID, making it suitable for a wide range of geospatial tools. Whether you’re involved in marine conservation, coastal planning, or international boundary studies, MAPOG provides structured, ready-to-use datasets for seamless visualization and spatial analysis.
How to Download Maritime Boundary Data with MAPOG
The process is efficient and user-focused, offering access to maritime datasets across global water bodies. With over 900+ GIS layers and 200+ data themes, MAPOG ensures accessibility in formats like SHP, KML, MIF, DXF, CSV, GeoJSON, SQL, TOPOJSON, and GPX. This flexibility empowers professionals, researchers, and students alike.
Download Maritime Boundary Data of any countries
Note:
- All data is provided in GCS datum EPSG:4326 WGS84 CRS (Coordinate Reference System).
- Users need to log in to access and download their preferred data formats.
Step-by-Step Guide to Download Maritime Boundary Data
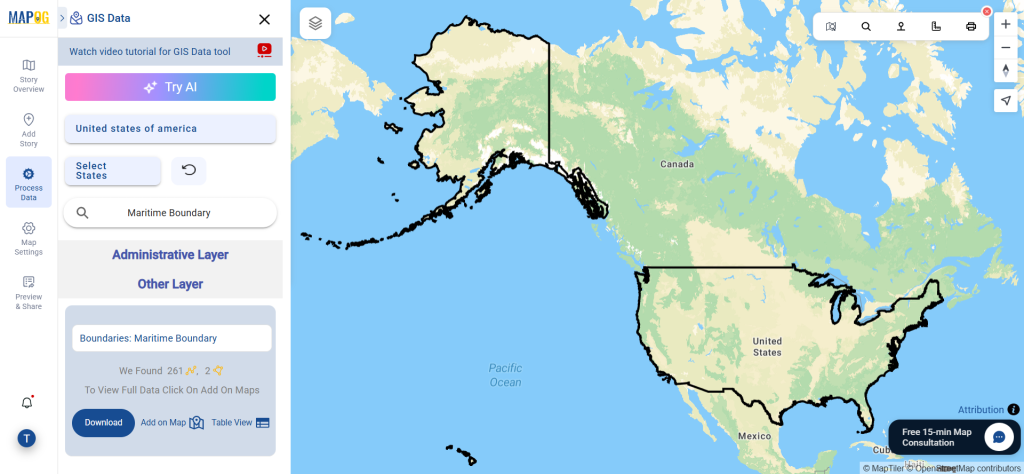
Step 1: Search Maritime Boundary Layer
Begin by navigating through the MAPOG interface and using the search function to find “Maritime Boundary Data.” Each layer includes detailed metadata and geometry type—whether it’s a line representing maritime zones or a polygon for exclusive zones.
Step 2: Try AI-Powered Search
Speed up your search using MAPOG’s “Try AI” feature. Just type queries like “Exclusive zones” or “Maritime boundaries near coastlines,” and the system instantly fetches relevant datasets. This feature is particularly helpful for new users or those exploring specific marine areas.
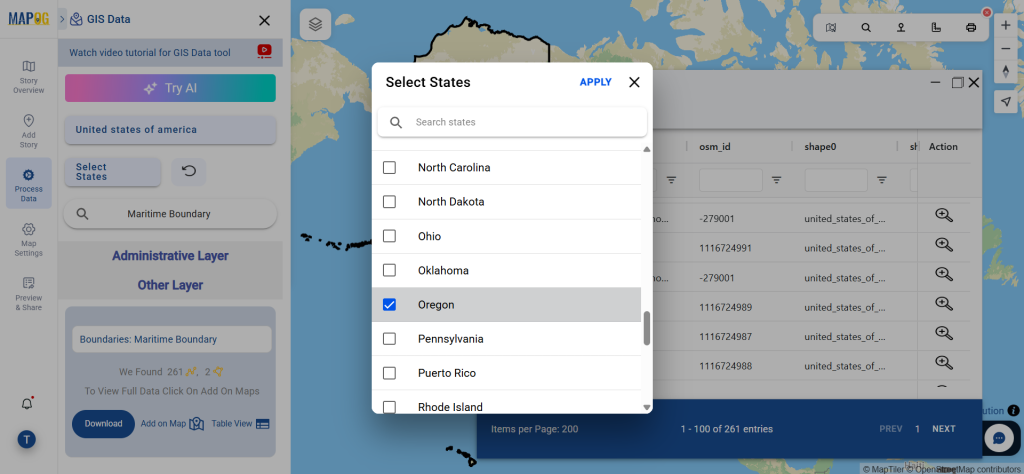
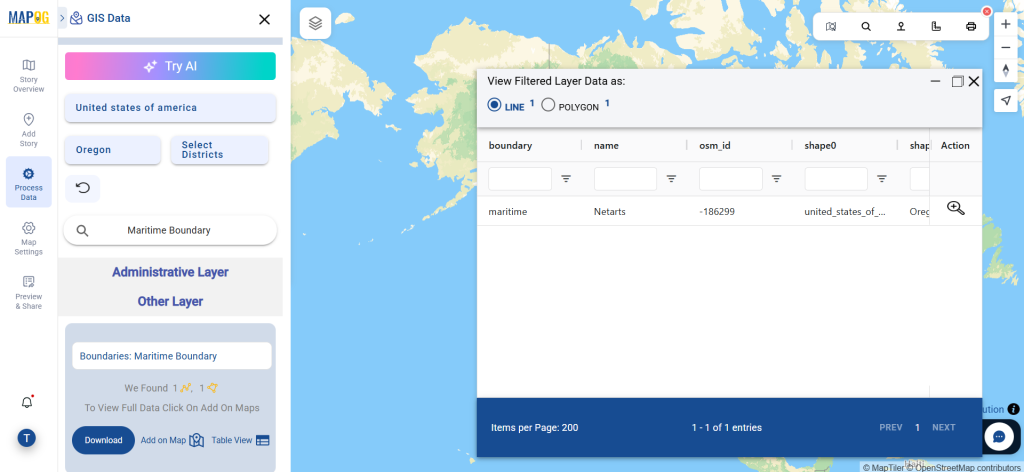
Step 3: Filter by Region
Use the Filter Data option to narrow your dataset by region, state, or district-level boundaries when applicable. This makes it easier to retrieve precise data, especially for local marine management, coastal development, or spatial policy-making.
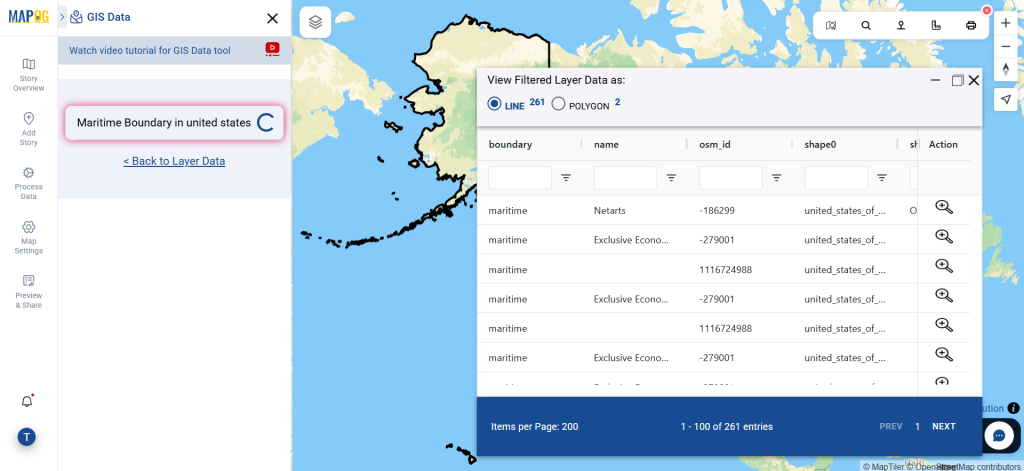
Step 4: Add Layers to Map for Visualization
Click on the “Add on Map” option to view your selected maritime boundary layers in the analysis interface. This helps in examining overlaps, nearby zones, and distances—crucial for maritime planning and dispute resolution.
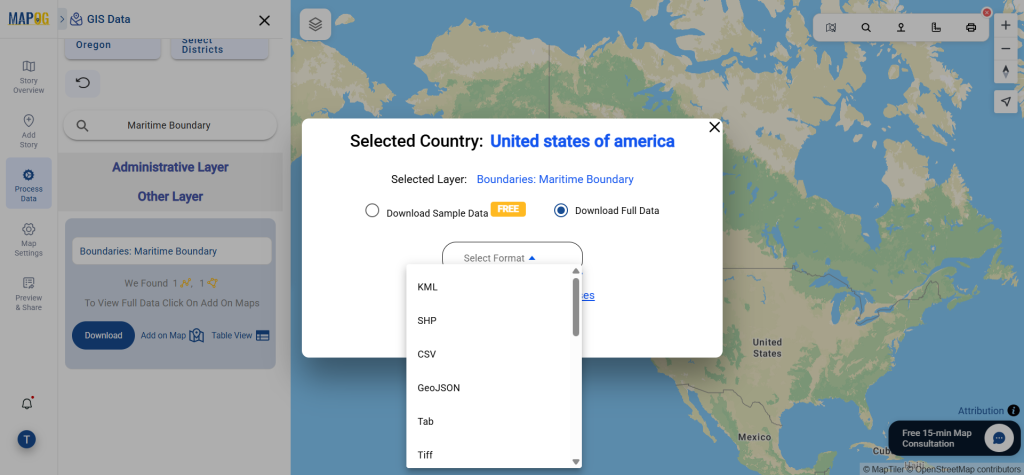
Step 5: Download Maritime Boundary Data
Once the layer is finalized, select the “Download” button. Choose from a sample or full dataset, select the preferred format (such as Shapefile, KML, MID, GeoJSON, etc.), agree to the terms, and complete the download process. The data can then be imported into platforms like QGIS, ArcGIS, or AutoCAD for further use.
Final Thoughts
With a few clicks, you can now Download Maritime Boundary Data in the format that best suits your GIS workflow. MAPOG’s rich repository, AI-powered search, and map-based tools make it a powerful resource for accessing high-quality geographic data. Whether you’re analyzing coastal zones or mapping maritime jurisdiction, this platform offers everything you need to make informed, data-driven decisions.
With MAPOG’s versatile toolkit, you can effortlessly upload vector and upload Excel or CSV data, incorporate existing layers, perform Split polygon by line, use the converter for various formats, calculate isochrones, and utilize the Export Tool.
For any questions or further assistance, feel free to reach out to us at support@mapog.com. We’re here to help you make the most of your GIS data.
Download Shapefile for the following:
- World Countries Shapefile
- Australia
- Argentina
- Austria
- Belgium
- Brazil
- Canada
- Denmark
- Fiji
- Finland
- Germany
- Greece
- India
- Indonesia
- Ireland
- Italy
- Japan
- Kenya
- Lebanon
- Madagascar
- Malaysia
- Mexico
- Mongolia
- Netherlands
- New Zealand
- Nigeria
- Papua New Guinea
- Philippines
- Poland
- Russia
- Singapore
- South Africa
- South Korea
- Spain
- Switzerland
- Tunisia
- United Kingdom Shapefile
- United States of America
- Vietnam
- Croatia
- Chile
- Norway
- Maldives
- Bhutan
- Colombia
- Libya
- Comoros
- Hungary
- Laos
- Estonia
- Iraq
- Portugal
- Azerbaijan
- Macedonia
- Romania
- Peru
- Marshall Islands
- Slovenia
- Nauru
- Guatemala
- El Salvador
- Afghanistan
- Cyprus
- Syria
- Slovakia
- Luxembourg
- Jordan
- Armenia
- Haiti And Dominican Republic
- Malta
- Djibouti
- East Timor
- Micronesia
- Morocco
- Liberia
- Kosovo
- Isle Of Man
- Paraguay
- Tokelau
- Palau
- Ile De Clipperton
- Mauritius
- Equatorial Guinea
- Tonga
- Myanmar
- Thailand
- New Caledonia
- Niger
- Nicaragua
- Pakistan
- Nepal
- Seychelles
- Democratic Republic of the Congo
- China
- Kenya
- Kyrgyzstan
- Bosnia Herzegovina
- Burkina Faso
- Canary Island
- Togo
- Israel And Palestine
- Algeria
- Suriname
- Angola
- Cape Verde
- Liechtenstein
- Taiwan
- Turkmenistan
- Tuvalu
- Ivory Coast
- Moldova
- Somalia
- Belize
- Swaziland
- Solomon Islands
- North Korea
- Sao Tome And Principe
- Guyana
- Serbia
- Senegal And Gambia
- Faroe Islands
- Guernsey Jersey
- Monaco
- Tajikistan
- Pitcairn
Disclaimer : The GIS data provided for download in this article was initially sourced from OpenStreetMap (OSM) and further modified to enhance its usability. Please note that the original data is licensed under the Open Database License (ODbL) by the OpenStreetMap contributors. While modifications have been made to improve the data, any use, redistribution, or modification of this data must comply with the ODbL license terms. For more information on the ODbL, please visit OpenStreetMap’s License Page.
Here are some blogs you might be interested in:
- Download Airport data in Shapefile, KML , MIf +15 GIS format – Filter and download
- Download Bank Data in Shapefile, KML, GeoJSON, and More – Filter and Download
- Download Railway data in Shapefile, KML, GeojSON +15 GIS format
- Download Farmland Data in Shapefile, KML, GeoJSON, and More – Filter and Download
- Download Pharmacy Data in Shapefile, KML, GeoJSON, and More – Filter and Download
- Download ATM Data in Shapefile, KML, MID +15 GIS Formats Using GIS Data by MAPOG
- Download Road Data in Shapefile, KML, GeoJSON, and 15+ GIS Form