Aquaculture plays a vital role in food production, environmental monitoring, and sustainable resource management. Whether you are studying fish farming zones, coastal aquaculture boundaries, inland ponds, or hatchery locations, having access to structured geospatial datasets makes your analysis far more precise. With GIS Data by MAPOG, you can now Download Aquaculture Data effortlessly across multiple GIS formats such as Shapefile, KML, GeoJSON, and MID. The platform ensures compatibility with major mapping tools, giving professionals and learners a smooth path to visualizing, analyzing, and managing aquaculture-related information.
How to Download Aquaculture Data
MAPOG has been designed to simplify your work. It provides access to more than 900+ thematic layers and supports a wide range of GIS formats, including SHP, KML, CSV, GeoJSON, DXF, MIF, SQL, GPX, and many others. This ensures that both technical users and beginners can work with reliable, structured datasets without worrying about format restrictions.
Download Aquaculture Data of any countries
Notes:
- All datasets are provided in GCS datum EPSG:4326 WGS84 CRS for universal GIS compatibility.
- Users must be logged in to download their preferred aquaculture datasets.
Step-by-Step Guide to Download Aquaculture Data
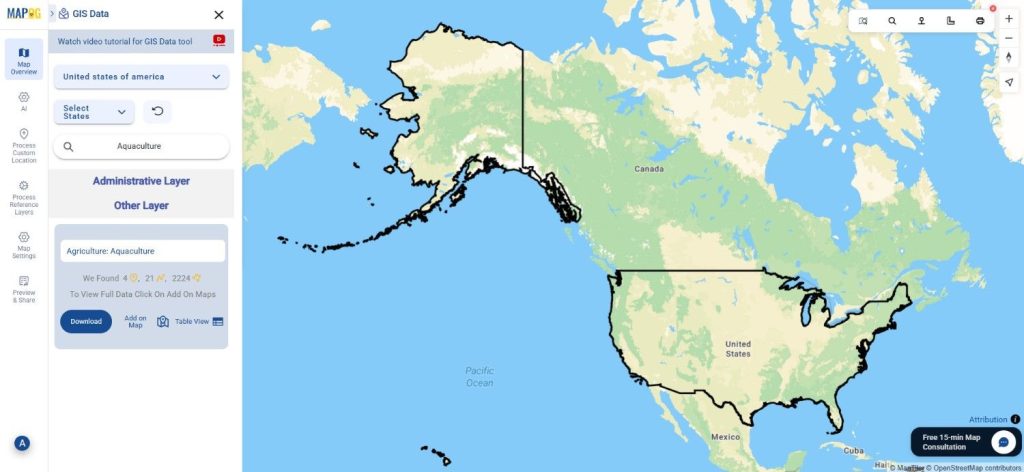
Step 1: Search for Aquaculture Layer
Start by navigating to the GIS Data by MAPOG interface. Use the search bar to look for “Aquaculture Data.” Check the feature attributes to understand whether the dataset contains polygon boundaries, point locations, or mixed geometry types.
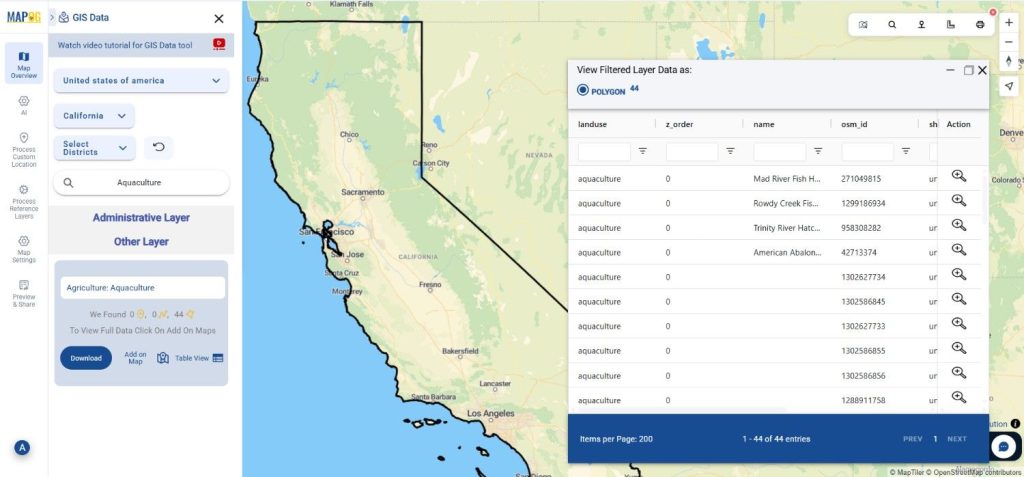
Step 2: Apply Filters for Relevant Output
If you want more refined results, select the Filter Data option. You can filter aquaculture datasets based on regions, administrative levels, or specific aquatic farming categories. This targeted approach helps ensure the dataset you download is relevant to your project.

Step 3: Visualize with “Add on Map”
Once you identify the correct aquaculture layer, use the “Add on Map” option. This step lets you preview the spatial distribution directly on an interactive GIS map, enabling you to evaluate coverage, patterns, and suitability before downloading the file.
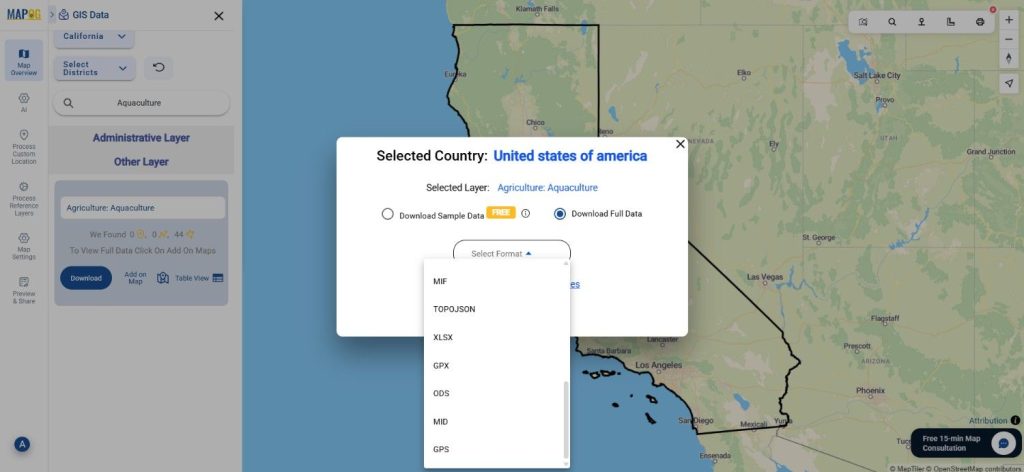
Step 4: Download Aquaculture Data
After reviewing the map visualization, click the “Download Data” button. You can choose between sample data or the full dataset. Select your preferred format — such as Shapefile, KML, MID, GeoJSON, or others — accept the terms, and proceed with the download. This ensures you receive clean, ready-to-use aquaculture layers that integrate seamlessly into any GIS workflow.
Final Thoughts
Accessing aquaculture datasets no longer has to be complicated. With MAPOG, you can Download Aquaculture Data in over a dozen formats, making the workflow smooth for environmental researchers, marine planners, GIS analysts, and students. The platform brings flexibility, precision, and ease to every mapping project—helping you build powerful insights from trusted geospatial data.
With MAPOG’s versatile toolkit, you can effortlessly upload vector and upload Excel or CSV data, incorporate existing layers, perform Split polygon by line, use the converter for various formats, calculate isochrones, and utilize the Export Tool.
For any questions or further assistance, feel free to reach out to us at support@mapog.com. We’re here to help you make the most of your GIS data.
Download Shapefile for the following:
- World Countries Shapefile
- Australia
- Argentina
- Austria
- Belgium
- Brazil
- Canada
- Denmark
- Fiji
- Finland
- Germany
- Greece
- India
- Indonesia
- Ireland
- Italy
- Japan
- Kenya
- Lebanon
- Madagascar
- Malaysia
- Mexico
- Mongolia
- Netherlands
- New Zealand
- Nigeria
- Papua New Guinea
- Philippines
- Poland
- Russia
- Singapore
- South Africa
- South Korea
- Spain
- Switzerland
- Tunisia
- United Kingdom Shapefile
- United States of America
- Vietnam
- Croatia
- Chile
- Norway
- Maldives
- Bhutan
- Colombia
- Libya
- Comoros
- Hungary
- Laos
- Estonia
- Iraq
- Portugal
- Azerbaijan
- Macedonia
- Romania
- Peru
- Marshall Islands
- Slovenia
- Nauru
- Guatemala
- El Salvador
- Afghanistan
- Cyprus
- Syria
- Slovakia
- Luxembourg
- Jordan
- Armenia
- Haiti And Dominican Republic
- Malta
- Djibouti
- East Timor
- Micronesia
- Morocco
- Liberia
- Kosovo
- Isle Of Man
- Paraguay
- Tokelau
- Palau
- Ile De Clipperton
- Mauritius
- Equatorial Guinea
- Tonga
- Myanmar
- Thailand
- New Caledonia
- Niger
- Nicaragua
- Pakistan
- Nepal
- Seychelles
- Democratic Republic of the Congo
- China
- Kenya
- Kyrgyzstan
- Bosnia Herzegovina
- Burkina Faso
- Canary Island
- Togo
- Israel And Palestine
- Algeria
- Suriname
- Angola
- Cape Verde
- Liechtenstein
- Taiwan
- Turkmenistan
- Tuvalu
- Ivory Coast
- Moldova
- Somalia
- Belize
- Swaziland
- Solomon Islands
- North Korea
- Sao Tome And Principe
- Guyana
- Serbia
- Senegal And Gambia
- Faroe Islands
- Guernsey Jersey
- Monaco
- Tajikistan
- Pitcairn
Disclaimer : The GIS data provided for download in this article was initially sourced from OpenStreetMap (OSM) and further modified to enhance its usability. Please note that the original data is licensed under the Open Database License (ODbL) by the OpenStreetMap contributors. While modifications have been made to improve the data, any use, redistribution, or modification of this data must comply with the ODbL license terms. For more information on the ODbL, please visit OpenStreetMap’s License Page.
Here are some blogs you might be interested in:
- Download Airport data in Shapefile, KML , MIf +15 GIS format – Filter and download
- Download Bank Data in Shapefile, KML, GeoJSON, and More – Filter and Download
- Download Railway data in Shapefile, KML, GeojSON +15 GIS format
- Download Farmland Data in Shapefile, KML, GeoJSON, and More – Filter and Download
- Download Pharmacy Data in Shapefile, KML, GeoJSON, and More – Filter and Download
- Download ATM Data in Shapefile, KML, MID +15 GIS Formats Using GIS Data by MAPOG
- Download Road Data in Shapefile, KML, GeoJSON, and 15+ GIS Form