Using Heat map is very effective way of visualizing points data. To create Heat map, first of all you must know what is heat map. When map visual of a location data is so dense and tightly packed that it does not make much sense a heat map is used. Heat maps are ordinarily used when mapping “points”. In this article we are providing pictorial tutorial of Create Heat Map using IGIS Map Tool
To create Heat map with IGIS Map Tool, you also need to look over the GIS MapOG HeatMAP Tool.
Create Heat Map – GIS MapOG Tool
Heat Map allows user to display the density of the geographic points in a map. Heat map uses geographic points as a gradient color layer to style the map.
To create Heat Map with IGIS Map Tool you need to follow some steps as follows:
- Go To GIS MapOG Heat MAP Tool and login to your account or register if you are new user with name, email id, Organization name and role in examination.
- Click on Create New Map and fill the tittle of map with its description.
- Next screen will be redirected to the canvas where you can create, upload or use sample data for your heat map creation.
- Upload a layer from data set.

- Once the map is uploaded click on publish layer.
- Select style layer by right click on the layer in side bar.

- Now click on the Heat map section to create Heat map.

- The distance between points for clustering is the merge radius here. The greater the number of points that fall within the radius, the greater the intensity of the heat map. While a radius set too small will generate isolated spots; a radius set to large will show no detail.
- Now fill the opacity in the fill section to set the transparency of the heat map layer between 100% and 0%.

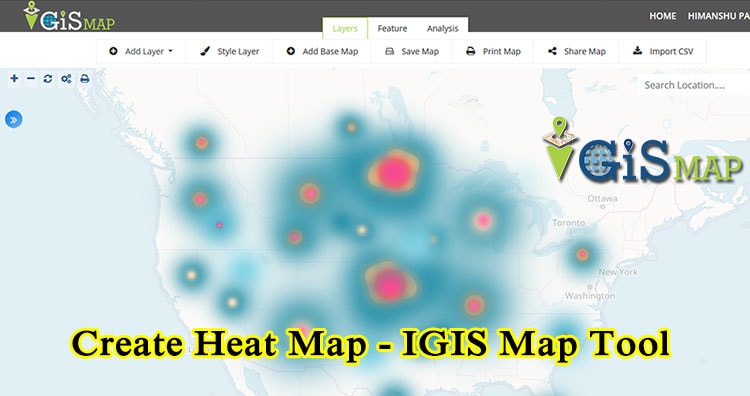
Heat map use red color to show high density of points and blue color for the low density of point area.
Below is the heat map of disaster management using sample data.

Use of Heat Map
This type of identification and visualization is useful for visualizing density of the geographic points and also used for business analysis and demographics mapping.
Heat Map serves in following industries:
- Insurance
- Healthcare
- Disaster management
- Real Estate
- Surveying
- Banking etc.
For example, Heat Map can be used by Disaster Management Firm. As when a DM needs to calculate the flood disaster data it uses the heat map.
While data and business analysis is the main reason to Create Heat Map, but it can also helps in understanding and comparing the data easily. It is also very common practice to use the Heat Map in Disaster and Risk management.
I hope this may help you in develop and Create Heat map with IGIS Map Tool. So if you find any problem in creating one such example do let us know by commenting below.