QGIS Tutorial: Unsupervised classification using KMeansClassification

Unsupervised classification is based on software analysis. It uses computer techniques for determining the pixels which are related and sort them into classes. In this post we doing unsupervised classification using KMeansClassification in QGIS. For supervised classification check earlier articles.

For Beginners check – QGIS Tutorial

Unsupervised classification using  KMeansClassification in QGIS

  • Add a raster layer in a project Layer >> Add Layer >> Add Raster Layer.
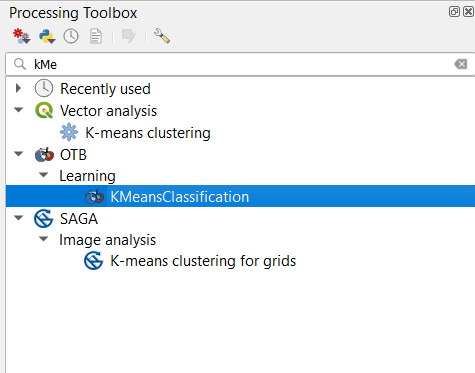
  • Go to the search box of Processing Toolbox , search KMeans and select the KMeansClassification.

  • Select the input image. Type the Number of classes to 20 (default classes are 5) . Fill training size to 10000.

Unsupervised classification using KMeansClassification

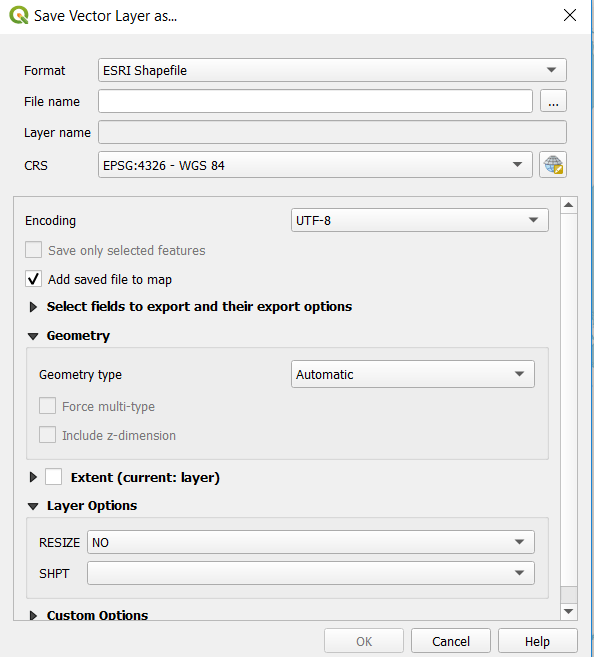
  • Type the name of output image save to file.

Unsupervised classification using KMeansClassification

  • And in the last tap on Run 

Unsupervised classification using KMeansClassification

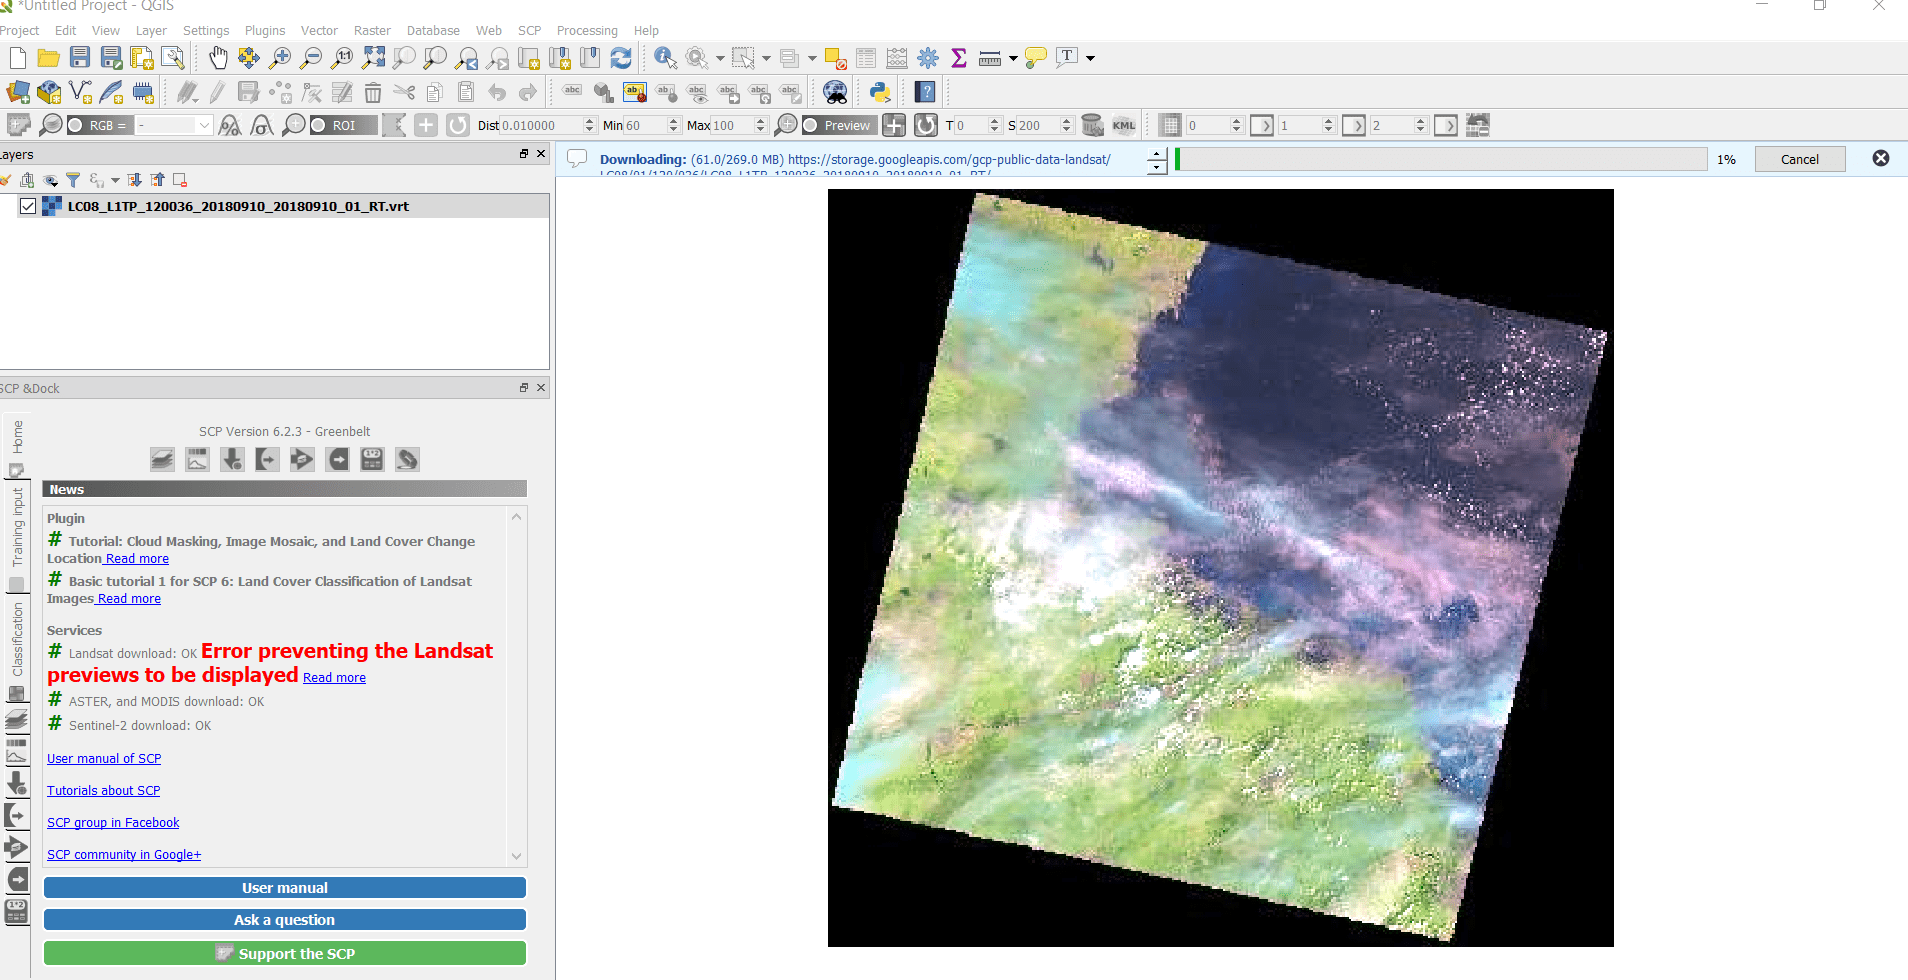
  • Output image directly display on canvas. Image is shown below.

Unsupervised classification using KMeansClassification

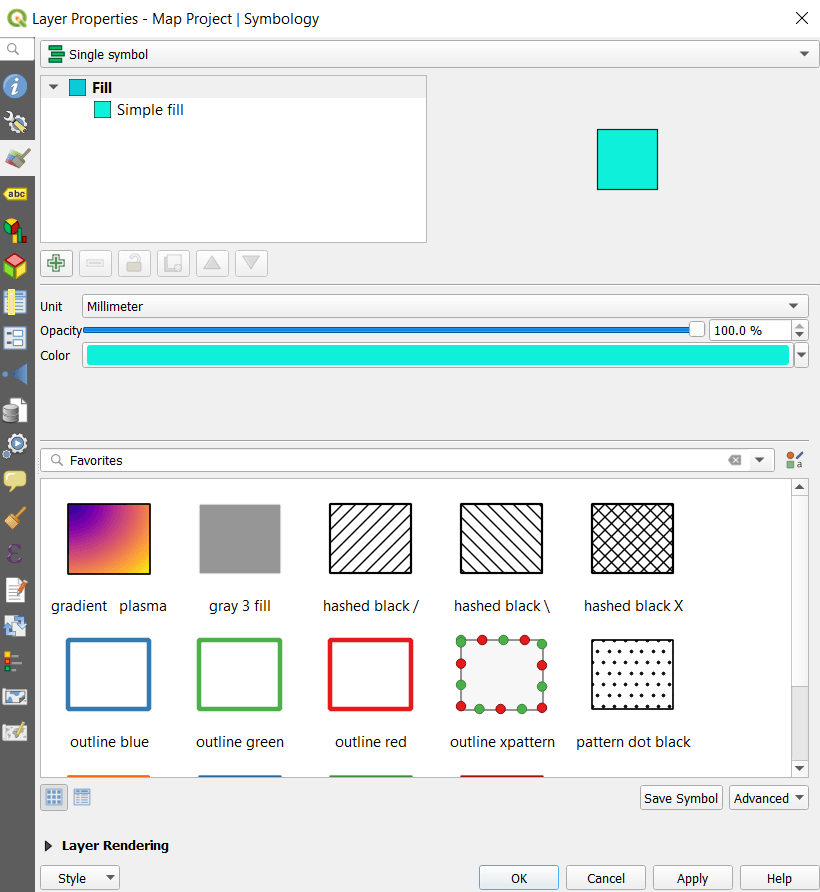
In the layer panel, right click on the output layer and select Properties >> Symbology.  Change Render Type Singleband Psuedocolor.

  • Select the Color Ramp ( we selected spectral)
  • Choose Mode Equal Interval (default selection is continous)
  • Change the number of classes from 5 to 20.

Unsupervised classification using KMeansClassification

  • In the last click on OK. Output image is provided below. You can also classify according to discrete interpolation if desired.

Unsupervised classification using KMeansClassification

This is all about unsupervised classification using KMeansClassification. If you face any problem in implementing then please do comment.

More on QGIS –


QGIS Tutorial – Vector Analysis – Create New Projection

Projection is a method to represent 3D data into 2D. It plays a important role in GIS. A map projection is termed as Coordinate Reference System (CRS) and QGIS allows users to define custom CRS. So in this article QGIS Tutorial – Vector Analysis – Create New Projection we will get familiar with creating your own CRS as per need.

Create 3D map in QGIS

Change projection of a georeference file in other projection – Reprojection in QGIS

QGIS Tutorial – Vector Analysis – Create New Projection

  • Start a new map >> upload a vector file using add layer in layer in menu bar.
  • Go to Setting menu bar >> select Custom Projections

QGIS Tutorial - Vector Analysis - Create New Projection

  • Tap on Add new CRS button for new projection creation shown in below image.

QGIS Tutorial - Vector Analysis - Create New Projection

In the Name field fill Van der Grinten I  and in the Parameters fill this string

+proj=vandg +lon_0=0 +x_0=0 +y_0=0 +R_A +a=6371000 +b=6371000 +units=m +no_defs

And in the last click on OK

QGIS Tutorial - Vector Analysis - Create New Projection

  • Now click on CRS button in the status bar at the bottom right of QGIS button.

QGIS Tutorial - Vector Analysis - Create New Projection

  • Filter the user defined projection, Select and click on OK button.

QGIS Tutorial - Vector Analysis - Create New Projection

Here is the map with new projection. It looks interesting then earlier one.

QGIS Tutorial - Vector Analysis - Create New Projection

This is about creating or changing projection of vector data in QGIS. If you are newbie learn OGIS from Free QGIS Tutorials

Use GIS MapOG Tool for GIS Mapping.

Download Shapefile free and practice in IGIS Map Tool.

QGIS Tutorial – Quantum GIS Guide

QGIS is one of the most common open source application used by GIS analyst, Geographers, Civil Engineers and many other professionals. If you are new in the field of Geographic Information System (GIS)  you should consider learning this application, as it will help you to solve many complex problems, analyze area, create reports etc. with just few clicks. Let me introduce you what is QGIS and why you should consider using it before providing all the QGIS tutorial links.

What is QGIS and its Advantages:

QGIS is a Desktop based Geographic Information System (GIS) Application for creating maps, editing, viewing and analyzing Geospatial data. Quantum GIS is a cross platform, free and open source application. It can be run on multiple operating system like Mac OS X, Windows, Ubuntu, Linux and Unix.

QGIS has many advantages over other application like:

  • Simple, easy and User friendly Interface(UI).
  • Is of small size and consumes less RAM memory compared to other GIS application.
  • Supports all kinds of GIS file formats – Either vector or Raster.
  • Tons of plugin are already developed for additional functionality which can be used and added directly. If you don’t the plugin you need, then you can
  • Code in Python or c+++ for integrating the one.
  • A free software application under GNU GPL License
  • And many more.

Download QGIS from Official Website

QGIS 3.4.4 tutorial:

Download, Uploading and Converting geo files in QGIS

Digitizing, Processing, Analyzing, Georeferencing in QGIS

Visit IGIS MAP Youtube Channel for free QGIS Tutorial

QGIS Database Linking

This list will continuously updated as the number of articles for tutorial would be published. If you are an expert in QGIS please consider contributing a tutorial article for same here.

Free Trial of MapOG Tool

QGIS 3.4.4 tutorial : Creating, Editing and Mapping in GIS

Hello Folks if you are looking for QGIS 3.4.4 tutorial then you are at right place. Here in this article QGIS 3.4.4 tutorial : Creating, Editing and Mapping in GIS you will grasp to create new shapefile.

QGIS 3.4.4 tutorial : Creating, Editing and Mapping in GIS

Before creating new map layer go to browser panal. Choose XYZ tiles and select OpenStreetMap. OpenStreetMap is added to the canvas. Zoom in and pan the map if require.

QGIS 3.4.4 tutorial : Creating, Editing and Mapping in GISFor creating new layer go to layer in the menu toolbar. Select New temporary scratch layer. Fill the layer name and select the geometry of the layer you want.

QGIS 3.4.4 tutorial : Creating, Editing and Mapping in GIS

Select Add polygon feature from digitizing toolbar.

QGIS 3.4.4 tutorial : Creating, Editing and Mapping in GIS

Now Create your Layer using Add Polygon Feature.

QGIS 3.4.4 tutorial : Creating, Editing and Mapping in GIS

You can edit the Map using Vertex Tool shown in below image.

QGIS 3.4.4 tutorial : Creating, Editing and Mapping in GIS

You can toggle editing by clicking toggle icon from digitizing tool bar. Now Save your new layer by right click on the layer. Tap on Export and click Save Features As..

QGIS 3.4.4 tutorial : Creating, Editing and Mapping in GIS

Choose the format of your Layer. Give the file name and browse the location of file. Final step tap on OK button.  Here is your new shapefile.

If you want to create your Map more interactive then go to Symbology by right click on the layer and select Properties. Tap on Ok after editing.

This all about creating new layer and GIS Mapping in QGIS. You can also export it as a PDF/SVG. If you trouble in doing this then do comment.

If you are QGIS beginners then checkout following Tutorials –

QGIS Tutorial – 3D Map view in QGIS 3.4.6

Hi GIS learners here in this series of QGIS Tutorial we learn 3D Map view in QGIS 3.4.6. For 3D view you need DEM – Digital Elevation Model. If DEM alien to you then first understand what is DEM.

What is DEM?

Digital Elevation Model abbreviated as DEM is a 3D view or raster representation of terrain and its is in grid form. Each cell represents a value and each cell or pixel have their single attribute. We can define it as an ordered array of numbers that represent the spatial distribution of terrain attributes. The quality of DEM is a measure of how accurate elevation is at each pixel level and how accurately is the morphology presented.

QGIS Tutorial – 3D Map view in QGIS 3.4.6

For Creating 3D Map you need to Download DEM. After downloading DEM file you need to unzip it. (Extract hgt file) Then in the menu select go to layer >>  add layer >> add raster 

  • Upload the raster file.

QGIS Tutorial - 3D Map view in QGIS 3.4.6

  • Uploaded DEM is displayed on the canvas.

QGIS Tutorial - 3D Map view in QGIS 3.4.6

  • Now go to the layer panel, right click on the published layer  and select properties. 

QGIS Tutorial - 3D Map view in QGIS 3.4.6

  • In the menu bar click on View and tap on New 3D Map View. Then following screen will appear.

QGIS Tutorial - 3D Map view in QGIS 3.4.6

  • If you receive error message then change the CRS to WGS 84/ World Mercator – EPSG 3395. Message image is displayed below.

QGIS Tutorial - 3D Map view in QGIS 3.4.6


  • In the 3D view screen tap on setting.

QGIS Tutorial - 3D Map view in QGIS 3.4.6

  • In the 3D configuration select the elevation, change the vertical scale and tile resolution.

QGIS Tutorial - 3D Map view in QGIS 3.4.6

  • Move your image by pressing shift + left button of mouse or track pad of laptop.

QGIS Tutorial - 3D Map view in QGIS 3.4.6

Above image is the 3d view of map. This all about 3D Map view in QGIS 3.4.6. We tried our best using pictorial presentation of QGIS tutorial if you still face any problem please do comment.

More on QGIS Tutorial :

Download Denmark Administrative Boundary Shapefiles – Regions, Municipalities, Postal Areas and More

Hello GIS enthusiasts, IGISMAP has now published the latest GIS vector data of Denmark administrative levels. Links for downloading the shapefiles of the important administrative divisions of Denmark are provided in the following. You can also download these data in KML, GeoJSON or CSV formats. 

Note:

  • All data available are in GCS datum EPSG:4326 WGS84 CRS (Coordinate Reference System).
  • You need to login for downloading the shapefile.

Download Free Shapefile Data of Denmark

Denmark is a Nordic country in Northern Europe. It is the most populous and politically central constituent of the Kingdom of Denmark, a constitutionally unitary state that includes the autonomous territories of the Faroe Islands and Greenland in the North Atlantic Ocean. European Denmark is the southernmost of the Scandinavian countries, lying southwest of Sweden, south of Norway, and north of Germany. Spanning a total area of 42,943 km2 (16,580 sq mi), it consists of the peninsula of Jutland and an archipelago of 443 named islands, of which the largest are Zealand, Funen and the North Jutlandic Island. Denmark’s geography is characterized by flat, arable land, sandy coasts, low elevation, and a temperate climate. As of 2022, it had a population of 5.88 million (1 March 2022), of which 800,000 live in the capital and largest city, Copenhagen.

Denmark National Boundary

Download Denmark National Outline Boundary Shapefile

Download Denmark Regions Shapefile Data

Denmark is divided into 5 regions. The governing bodies of the regions are the regional councils, each with forty-one councillors elected for four-year terms.

Following are the list of regions:

  1. Hovedstaden – Capital Region of Denmark
  2. Midtjylland – Central Denmark Region
  3. Nordjylland – North Denmark Region
  4. Sjælland – Region Zealand
  5. Syddanmark – Region of Southern Denmark
Denmark Region Boundaries

Download Denmark Region Boundaries Shapefile

Download Denmark Municipalities Shapefile Data

Denmark Municipality Boundaries

Download Denmark Municipality Boundaries Shapefile

Download Denmark Postal Areas Shapefile Data

Denmark Postal Area Boundaries

Download Denmark Postal Area Boundaries Shapefile

Other Administrative Boundary Data:

Other GIS Data:

Please note that the Papua New Guinea data provided here is license under Open Data Commons Open Database License (ODbL). Please review the same before using it. If you want data under different license you can also look over to the post : Download Free Shapefile Maps – Country Boundary Polygon, Rail-Road, Water polyline etc

Download Free Shapefile for the following:

  1. World Countries Shapefile
  2. Australia
  3. Argentina
  4. Austria
  5. Belgium
  6. Brazil
  7. Canada
  8. Denmark
  9. Fiji
  10. Finland
  11. Germany
  12. Greece
  13. India
  14. Indonesia
  15. Ireland
  16. Italy
  17. Japan
  18. Kenya
  19. Lebanon
  20. Madagascar
  21. Malaysia
  22. Mexico
  23. Mongolia
  24. Netherlands
  25. New Zealand
  26. Nigeria
  27. Papua New Guinea
  28. Philippines
  29. Poland
  30. Russia
  31. Singapore
  32. South Africa
  33. South Korea
  34. Spain
  35. Switzerland
  36. Tunisia
  37. United Kingdom Shapefile
  38. United States of America
  39. Vietnam
  40. Croatia
  41. Chile
  42. Norway

Disclaimer : If you find any shapefile data of country provided is in correct do contact us or comment below, so that we will correct the same in our system as well we will try to correct the same in openstreetmap.

Download Landsat 8 Images in QGIS 3.4.4

Landsat 8 provide satellite images for remote sensing.  For extracting information from satellite images land cover classification plays a important role. In this post you get pictorial tutorial for how to download Landsat 8 images in QGIS 3.4.4 for research and processing.  Newbees also can check QGIS 3.4.4 for beginners.

Try 3D view map in QGIS

Install Semi- Automatic Classification Plugin in QGIS 3.4.4

For landsat 8 images in QGIS 3.2.1 you need to download plugin. Go to plugin >> search for Semi- Automatic Classification Plugin and  install it.

download Landsat 8 images in QGIS 3.2.1

Once the Semi-Automatic Classification plugin installed then SCP input and Dock appeared on the screen.

Download Landsat Images

Go to SCP & Dock, tap on download product. Symbol of download shown below.download Landsat 8 images in QGIS 3.2.1

After clicking Semi-automatic classification plugin window will appear. Search for parameter by writing the coordinates of the area (longitude and latitude) download Landsat 8 images in QGIS 3.2.1

You can download images from Sentinel – 2 , Sentinel -3 , L 4-5, L7 or L8. Here we download image from L8 OLI/TIRS. So select L8 OLI/TIRS from download product. Select date and click on find.

download Landsat 8 images in QGIS 3.2.1

Few seconds later a list of images appeared in the product list. Check the products in the preview for the appropriate image.

Click the load buttonfor preview map provided in the right side of the window. download Landsat 8 images in QGIS 3.2.1

We can also set the bands according to our purpose by selecting download images tab.

download Landsat 8 images in QGIS 3.2.1

Now, tap on Run button for downloading the image. Select the folder where you want to save file. Downloading process take lots of time be patient.

You can see the map shown below.

This all about downloading images from Landsat 8 for research and processing.

More on QGIS:


Use Sentinel hub in QGIS 3.2.1 – Remote Sensing

Sentinel Hub is perfect source for  satellite data. Here in this post we are providing pictorial tutorial on how to use sentinel hub in QGIS 3.2.1. You can also download Sentinel without using plugin check download free satellite images from satellite.

You can view your image in our tool MAPOG Tool  (supports geotiff)

Use Sentinel hub in QGIS 3.2.1 – Procedure

Sentinel hub plugin helps you to confiqure directly the sentinel hub images in qgis. It makes your study more easy.

  1. Go to Plugins in QGIS window and tap on manage and install plugins.

use sentinel hub in QGIS 3.2.1

2.  Search and select Sentinel Hub and install it

use sentinel hub in QGIS 3.2.1

3.  After installing Sentinel Hub, Sentinel hub plugin icon will be visible on toolbar.

use sentinel hub in QGIS 3.2.1

4. Click on Sentinel Hub Plugin icon. Following will window open. Now fill your instance ID .

use sentinel hub in QGIS 3.2.1

5. You can find your instance id at Sentinel Hub Configuration Utility. If you don’t have account on Sentinel Hub, you can apply for trial account of sentinel hub . And take benefit of its service for some days.use sentinel hub in QGIS 3.2.1

6. You can add new configuration according to your requirement. Also able to create configuration from existing one like simple WMS instance. You can use template instances like sentinel-1 template, digital elevation model, full landsat- 8 instance etc.

use sentinel hub in QGIS 3.2.1

7. After instance id you can fill other parameters for rendering. Select the layer for required instance. Also select the CRS (Coordinate Reference System). Select the the time range or exact date.

use sentinel hub in QGIS 3.2.1

8. It will take time but image will be turn up on QGIS canvas.

use sentinel hub in QGIS 3.2.1

9. After rendering you can also download the image in different formats i.e. PNG, JPEG, 8-bit TIFF etc. You can set resolution and also can save current visible window or custom window.

This all about how to use sentinel hub in QGIS 3.2.1. If you face any problem in this do comment. Any suggestions and feedback are welcomed.

More from us:

QGIS 3.2.1- Download/export map in PDF, SVG, Image

In the previous session we learn about creating basic map. Today we throw light on QGIS 3.2.1- Download/export map in PDF, SVG, Image.

Try our tool for creating interactive maps without writing a single code. MapOG Tool

QGIS 3.2.1- Download/export map

First add a vector layer  from exercise data (we are using). If want to use data from other sources like Google Map or bing.

Or else download sample data for study-

QGIS allows you to create multiple map from single layer. For creating map layout. Go to project >>>New print layout

QGIS 3.2.1- Download/export map in PDF, SVG, Image

Once you choose New Print Layout a dialog box will appear for a tittle.QGIS 3.2.1- Download/export map in PDF, SVG, Image

A new screen will be open for map layout. Add a new map to the layout from left side icon from tool box.

QGIS 3.2.1- Download/export map in PDF, SVG, Image

Or, Add item>> Add Map and hold the left mouse button and drag the rectangle. Map will be rendered on the layout.

QGIS 3.2.1- Download/export map in PDF, SVG, Image

QGIS 3.2.1 – Adding a tittle

Your map is looking good but without tittle it seems like food without salt. So, lets add some elements in map.

  • Click on this icon for adding tittle.QGIS 3.2.1- Download/export map in PDF, SVG, Image
  • Click on the page, move near the map where you want to place tittle. A dummy text will be shown “lorem ipsum” as a default. You can change text by first selecting item and then expand the label tab in layer properties. You can enter text as html also.

QGIS 3.2.1- Download/export map in PDF, SVG, Image

You can Resize the label according to your choice.

QGIS – Adding Legend

For making the map more understandable to the readers you can add legend. Go to Add item and tap add legend or by selecting the icon. QGIS 3.2.1- Download/export map in PDF, SVG, Image

And click on the page, where you want to place it.

QGIS – Add a scalebar

Go to Add item and select add scale bar.

QGIS 3.2.1- Download/export map in PDF, SVG, Image

Click on the layout where you want to put scale.  You can customize it in item properties. (make sure to select the item first)

QGIS – Export Map as SVG, Image and PDF

Try MapOG Tool for creating beautiful map and export map into PDF and Image

When you finally done with all the requirements of map, you can easily export map by buttons provided in the layout toolbar. If you want to print then it also can done with print button.

You can exports as following formats:

  • Export as Image
  • Export as SVG
  • Export as PDF

You can export map as image in PNG, BMP, CUR, TIFF, JPEG etc.

SVG format is best for cartographer because editing of map require for publication. SVG stands for “Scalable Vector Graphic”.

PDF format is easy going for clients so that they get print the pdf if they require.

So, today we learn about the print layout map option in QGIS 3.2.1. If you encounter any problem in doing then comment.

Also Check: Pin/unpin, move label and diagram in QGISSelect, save feature as new layer in QGIS

Pin/unpin labels, move labels and diagrams, resize labels of layer using QGIS 3.2.1

In the previous article Layer labeling in QGIS we learn about the basic labeling of layer. Today in this session we touch Pin/unpin labels, move labels and diagrams, resize labels of layer using QGIS 3.2.1

Resize labels of layer

In the map you find find that the labels are not appropriately formatted and either overlap or are too far away from their point markers. You can change label font size in points/mm/pixels.

Pin/unpin labels, move labels and diagrams, resize labels of layer using QGIS 3.2.1

  • Go to the Layer styling

You can reach layer styling dialog box by three ways:

Choosing layer icon on label toolbar or by choosing labeling from layer menu and third by right click on layer.

  • Increase and decrease font size.

Pin/unpin labels, move labels and diagrams, resize labels of layer using QGIS 3.2.1
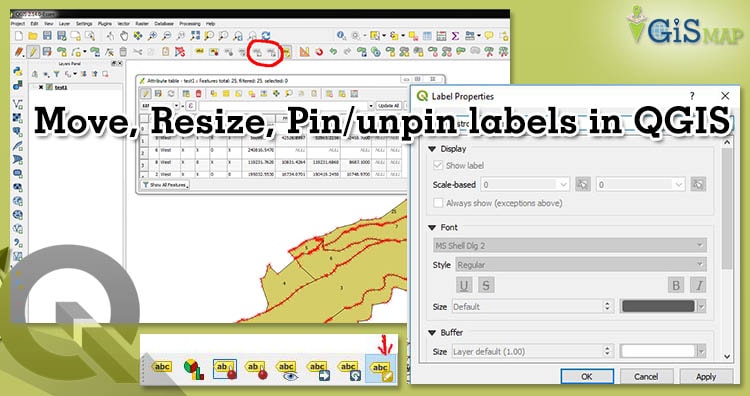
Move labels and Diagrams

Choose Move label icon from layer styling panel. Before this make sure toggle editing is activated. Pin/unpin labels, move labels and diagrams, resize labels of layer using QGIS 3.2.1

After choosing, you are able to move label or diagram on canvas of QGIS. By this method you can move labels individually. Its quite time consuming if we want to shift or move labels.

For all the labels go to Labels > Placement

Pin/unpin labels, move labels and diagrams, resize labels of layer using QGIS 3.2.1

You can change the value of distance and click apply.

Change Labels or Rename

  • Select change label icon from label toolbar

Pin/unpin labels, move labels and diagrams, resize labels of layer using QGIS 3.2.1

  • After activating go to the label and drag

Pin/unpin labels, move labels and diagrams, resize labels of layer using QGIS 3.2.1

  • Change the label and click on apply.

Print your labelled Map 

Pin/unpin Label in Qgis

Pinning means label at its current position.  You can choose pin and unpin from icon from label tool bar. You can highlight the pinned label.Pin/unpin labels, move labels and diagrams, resize labels of layer using QGIS 3.2.1

View attribute table

QGIS 3.2.1 for beginners

This all on Pin/unpin labels, move labels and diagrams, resize labels of layer using QGIS 3.2.1. Let me know if you have any questions or comments.

Furthermore on QGIS: