Marker Cluster With Leaflet

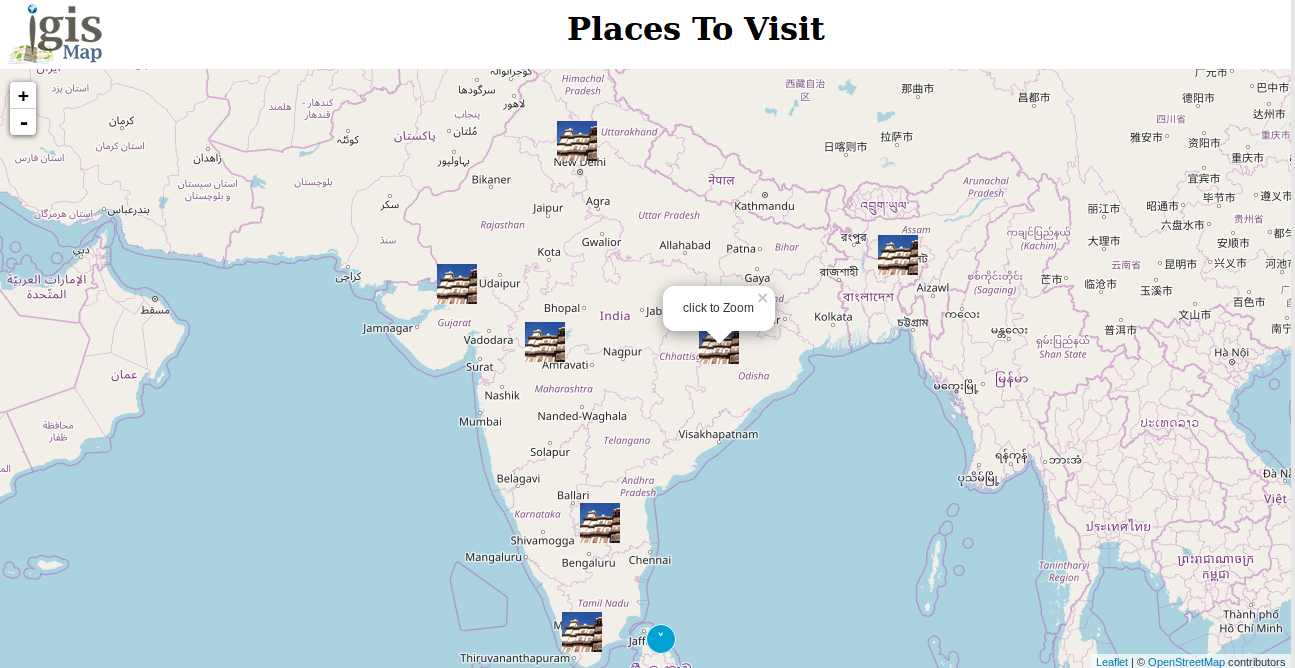
Places to visit in India:

In India there are many beautiful places to visit. Some of them are used here as information on map. In this demo we have shown only famous place in states but we have also show banks, hotels, companies or hospitals etc. and can have their information. This demo gives information of availability of sources around us.

Data Preparation:

Very first task to prepare any map is the data preparation. This demo shows various places in various state in India. For that we downloaded the data from various sites, arranged the images in folders with states name. Prepared one table with column names as States name, Place Name, Latitude, Longitude and Description. The folder name is same as first column of the table. All image names are same as second column of table. This is done so that data can be used in effective way.

Also can check Leaflet Js Plugin Basics Tutorial

Map Preparation:

Map has been shown using Leaflet java Script library. For using MarkerCluster in article added the leaflet Marker cluster plugin, which can be downloaded from https://github.com/Leaflet/Leaflet.markercluster website. getAllChildMarkers returns the array of total markers contained within that cluster.

<script src="leaflet.markercluster-src.js"></script>
<link rel="stylesheet" href="MarkerCluster.css" />
var map = L.map('map').setView([23.259933,77.412615],3);
	var searchLayer ;
	L.tileLayer('http://{s}.tile.osm.org/{z}/{x}/{y}.png', {
	attribution: '&copy; <a href=”http://osm.org/copyright”>OpenStreetMap</a> contributors'
	}).addTo(map);
var markers = L.markerClusterGroup({
			maxClusterRadius: 120,
			iconCreateFunction: function (cluster) {
				var markers = cluster.getAllChildMarkers();
				var n = 0;
				for (var i = 0; i < markers.length; i++) {
					n += markers[i].number;	
				}
				//console.log("done");
				return L.divIcon({ html: n, className: 'mycluster', iconSize: L.point(40, 40) });
				}
			});
			
			
		for (var i = 0; i < addressPoints.length; i++) {
			
			var a = addressPoints[i];
			var s=a[0];
			//console.log(a);
			var n=a[1];
			var gcon =  L.icon({iconUrl: 'image/'+s+'/'+n+'.JPG', iconSize: [40,40]});
		var title = a[4];
			var marker = L.marker(new L.LatLng(a[2], a[3]),{ icon: gcon });
		marker.bindPopup('<h2>'+n+'</h2><strong>'+s+'</strong><br><img src="image/'+s+'/'+n+'.JPG" height="150" width="300"><br>'+title);
			markers.addLayer(marker);
		}
	map.addLayer(markers);	
		
		
		markers.on('clustermouseover', function(c) {
              var popup = L.popup()
                  .setLatLng(c.layer.getLatLng())
                  .setContent('click to Zoom')
                  .openOn(map);
              })

If you need to add any images or style in cluster icon so you should not add the default CSS. Add the MarkerCluster.css file in your document. Here in popup we have shown place name, image with description.

Marker Cluster map

So its all about Markercluster with Leaflet if you face any problem in implementing this then comment below.

Furthermore, you can check :

Leaflet Js Plugin Basics Tutorial

In this blog post we are going to provide you the Leaflet Js Plugin Basics Tutorial. Leaflet Js has stated the main aim of its use is to provide JavaScript libraries for drawing maps, with good performance and usability. Leaflet has many features yet to be included for getting excel in performance and usability but the idea being that not everyone is going to use those features, therefore there is no benefit to increasing the size of leaflet and impacting performance. Instead the awesomeness of Leaflet is increased by encouraging third party contributors to craft their own plugins that can leverage the core library capabilities to expand functionality on a feature by feature basis. So, here is the article Leaflet Js Plugin Basics Tutorial.

Leaflet Js Plugin Basics Tutorial

This Leaflet Js Plugin Basics Tutorial contains the basics of using the leaflet plugin and advantages we can have with all of its functionalities. Leaflet Js plugins are the third party plugins which are used to extend the functionality of leaflet map. Now lets just talk about leaflet map and plugins.

Leaflet Js Plugin

There are hundreds of plugins available for Leaflet Js maps. The Leaflet Js plugins provides functionalities in various area of mapping like Tile and image layer, Basemap provider and brass map, Vector file and overlay map extends.

Leaflet Js Plugin Basics Tutorial is all about to show you that anyone can maintain and create Leaflet plugin with deep knowledge and understanding of leaflet and javascript.

You can attach the Leaflet plugin to your map with the help of Github or any other repository via adding the additional .js and .css file into the leaflet html file in the header section. The leaflet plugins really improves the performance and usability of Leaflet Js.

The most amazing thing about leaflet is Its powerful plugin ecosystem. Anyone with some coding skills can create the plugin for leaflet but there are some standards you need to follow before writing the code to create the plugin.

Some of the following standards are as follows:

  • Leaflet follows pretty much the same conventions except for using smart tabs (hard tabs for indentation, spaces for alignment) and putting a space after the function keyword.
  • Never expose global variables in your plugin.
  • If you have a new class, put it directly in the L namespace (L.MyPlugin).
  • And if you inherit one of the existing classes, make it a sub-property (L.TileLayer.Banana).
  • Even if you want to add new methods to existing Leaflet classes, you can do it like this: L.Marker.include({myPlugin: …}).
  • Function, method and property names should be in camelCase.
  • Class names should be in CapitalizedCamelCase.

Leaflet.draw

Leaflet Js has this amazing plugin which helps in adding the drawing and editing support for markers and vectors overlaid onto leaflet maps. It is one of the main heading under the topic of Leaflet Js Plugin Basics Tutorial. It is a comprehensive plugin that can add polylines, polygons, rectangle, circle, and markers to a map and then edit or delete those objects as desired without using the GeoJSON code.
Leaflet Js has a variety of options for configuring the look and feel of the drawing objects. Leaflet.draw is more used for its ability to enable additional functionality, than an endpoint. It also provides the framework to take those drawn objects and push them to a database.

Leaflet.draw code description

Leaflet.draw is designed to not only be easy for end users to use, but also for developers to integrate. The following is really only suitable for demonstrating that you have it running correctly. Leaflet.draw is very simple to drop into you Leaflet application. The following example will add both the draw and edit tool bars to a map:

<html> 
<head>
<title>new map</title>
<meta charset="utf-8" />
<link rel="stylesheet" href="http://cdn.leafletjs.com/leaflet-0.7/leaflet.css"/>
<link rel="stylesheet" href="https://cdnjs.cloudflare.com/ajax/libs/leaflet.draw/0.2.3/leaflet.draw.css"/>
</head>
<body>

< div id="map" style="width: 600px; height: 400px;">
< /div >

< script src="http://cdn.leafletjs.com/leaflet-0.7/leaflet.js" >
 < / script > 
< script src="https://cdnjs.cloudflare.com/ajax/libs/leaflet.draw/0.2.3/leaflet.draw.js" > < / script >
< script >
//Creating map and setting zoom
var map = L.map('map').setView([45.8650, -75.2094], 3);

// Set up the OSM layer
mapLink = '<a href="http://openstreetmap.org">OpenStreetMap</a>';
L.tileLayer( 'http://{s}.tile.openstreetmap.org/{z}/{x}/{y}.png', {
attribution: '&copy; ' + mapLink + ' Contributors',
maxZoom: 18,
}).addTo(map);

// Initialise the FeatureGroup to store editable layers
var drawnItems = new L.FeatureGroup();
map.addLayer(drawnItems);

// Initialise the draw control and pass it the FeatureGroup of editable layers
var drawControl = new L.Control.Draw({
edit: {
featureGroup: drawnItems
}
});
map.addControl(drawControl);
map.on('draw:created', function (e) {
var type = e.layerType,
layer = e.layer;
if (type === 'marker') {
layer.bindPopup('A popup!');
}
drawnItems.addLayer(layer);
});

< / script >
</body>
</html>
Result:
This code visualize both the draw and edit tool bars to a map:
Leaflet Js Plugin Basics Tutorial
Now let’s understand the above code in parts, The first part is an additional link to load more CSS code;
<link rel="stylesheet" href="https://cdnjs.cloudflare.com/ajax/libs/leaflet.draw/0.2.3/leaflet.draw.css"/>

This loads the file directly from the Leaflet.draw repository. And if you are loading from a local file you will need to adjust the path appropriately.

The second is the block that loads the leaflet.draw.js script.

< script src="https://cdnjs.cloudflare.com/ajax/libs/leaflet.draw/0.2.3/leaflet.draw.js" > < / script > 

Leaflet.draw exists as a separate block of JavaScript code and again, here we are loading the file directly from the Leaflet.draw repository.

The last change to the file is the block of code that runs and configures Leaflet.draw.

      // Initialise the FeatureGroup to store editable layers
        var drawnItems = new L.FeatureGroup();
        map.addLayer(drawnItems);
      // Initialise the draw control and pass it the FeatureGroup of editable layers
         
        map.addControl(drawControl);
        map.on('draw:created', function (e) {
            var type = e.layerType,
                layer = e.layer;

       // Shows popup on marker when user’s action triggers

                  if (type === 'marker') {
                    layer.bindPopup('A popup!');
                  }
            drawnItems.addLayer(layer);
        });

layer group to the map called drawnItems. We store elements in this layer.

Then the map.addLayer(drawnItems); line adds the layer with our drawn items to the map.
Next we get to the first of the true Leaflet.draw commands when we initialize the draw control and pass it the feature group of editable layers;

var drawControl = new L.Control.Draw({
edit: {
featureGroup: drawnItems
}
});
map.addControl(drawControl);

For adding the edit toolbar and confirming which (drawnItems) should be editable. These controls are added to the map i.e. map.addControl(drawControl); .

Finally when we add a new vector or marker we need prompt a trigger that captures the type of item we have created (polyline, rectangle etc).

And adds it to the drawn items layer on the map.

map.on('draw:created', function (e) {
var type = e.layerType,
layer = e.layer;
// Show popup on marker when user’s action triggers
if (type === 'marker') {
layer.bindPopup('A popup!');
}
drawnItems.addLayer(layer);
});

In this code part you can store the information that described the element in a database or similar.

If you  are novice then check Leaflet js – Getting Started – Create Map Application

Furthermore, Try your hands on:

If you have any queries please comment in the comment box below.

Leaflet.js – Point, Polyline, Polygon, Rectangle, Circle – Basic Shapes

In this tutorial we are focusing on the Leafletjs basic shapes used for mapping. Leaflet.js can add various shapes such as circles, polygons, rectangles, polylines, points or markers etc. here, we will discuss how to use the shapes provided by Google Maps. If you are not familiar with Leaflet.js, you can visit our another blog Leaflet js – Getting Started – create Map Application. Also if you already have geojson files, you can load the geojson files with leafletjs as a map.

Marker or Point

To draw point overlay on a map using leaflet javascript library, follow the steps below-

      • Create a Map object by passing a <div> element (String or object) and map options (optional).
      • Create a Layer object by passing the URL of the desired tile.
      • Add the layer object to the map using the addLayer() method of the Map class.
      • Create a latlangs variable for the point to draw point or marker, as shown below.
Var point = [38.9188702,-77.0708398];
      • Create a point or marker using the L.marker(). To draw the marker, pass the location as variable.

        L.marker([38.9188702,-77.0708398]).addTo(newMap);
        

        Polyline

To draw polyline overlay on a map using Leaflet JavaScript library, follow the steps given below −

      • Create a Map object by passing a <div> element (String or object) and map options (optional).
      • Create a Layer object by passing the URL of the desired tile.
      • Add the layer object to the map using the addLayer() method of the Map class.
      • Create a latlangs variable to hold the points to draw polyline, as shown below.

        var latlngs = [ [38.91,-77.07], [37.77, -79.43], [39.04, -85.2]];
      • Create a polyline using the L.polyline(). To draw the polyline, pass the locations as variable and an option to specify the color of the lines.

        var polyline = L.polyline(latlngs, {color: 'red'});
      • Add the polyline to the map using the addTo() method of the Polyline class.

        Polygon

To draw a polygon overlay on a map using Leaflet JavaScript library, follow the steps given below −

      • Create a Map object by passing a <div> element (String or object) and map options (optional).
      • Create a Layer object by passing the URL of the desired tile.
        Add the layer object to the map using the addLayer() method of the Map class.
      • Create a latlangs variable to hold the points to draw the polygon.

        var latlngs = [
           [17.385044, 78.486671],
           [16.506174, 80.648015],
           [17.686816, 83.218482]
        ];
      • Create a polygon using the L.polygon(). Pass the locations/points as variable to draw the polygon, and an option to specify the color of the polygon.

        var polygon = L.polygon(latlngs, {color: 'red'});
      • Add the polygon to the map using the addTo() method of the Polygon class.

shape-polygon

Rectangle

To draw a Rectangle overlay on a map using Leaflet JavaScript library, follow the steps given below –

      • Create a Map object by passing a <div> element (String or object) and map options (optional).
      • Create a Layer object by passing the URL of the desired tile.
        Add the layer object to the map using the addLayer() method of the Map class.
      • Create a latlangs variable to hold the points to draw a rectangle on the map.

        var latlngs = [[18.739046, 80.505755], [15.892787, 77.236081]];
      • Create a rectangle using the L.rectangle() function. Pass the locations/points as a variable to draw a rectangle and rectangle Options to specify the color and weight of the rectangle.
var rectOptions = {color: 'Red', weight: 1}
var rectangle = L.rectangle(latlngs, rectOptions);
      • Add the rectangle to the map using the addTo() method of the rectangle class.

        rectangle.addTo(map);

shape-rect

Circle

To draw a circle overlay on a map using Leaflet JavaScript library follow the steps given below.

      • Create a Map object by passing a <div> element (String or object) and map options (optional).
      • Create a Layer object by passing the URL of the desired tile.
        Add the layer object to the map using the addLayer() method of the Map class.
      • Create a latlangs variable to hold the center of the circle as shown below.

        var circleCenter = [40.72, -74.00];
      • Create a variable circleOptions to specify values to the options color, fillColor and, fillOpacity as shown below.

        var circleOptions = {
           color: 'red',
           fillColor: '#f03',
           fillOpacity: 0
        }
      • Create a circle using L.circle(). Pass the center of the circle, radius, and the circle options to this function.

        var circle = L.circle(circleCenter, 50000, circleOptions);
        
        
      • Add the above-created circle to the map using the addTo() method of the Polyline class.

        circle.addTo(map);

shape-circle

This article contains the basic shapes created and used in the leaflet js scripting library. If you have any questions related to leaflet.js, please let us know in the comment section.

Get Band Information from WMS Geoserver Leafletjs

Get Band Information from WMS Geoserver Leafletjs. Band Information from Layer: In its simplest form, a raster consists of a matrix of cells (or pixels) organized into rows and columns (grid), where each cell contains a value representing information, such as temperature, precipitation or elevation etc. Rasters are digital aerial photographs, imagery from satellites, digital pictures, or even scanned maps.

Get Band Information from WMS Geoserver Leafletjs

Data stored in a raster format represents real-world phenomena – Get Band Information from WMS Geoserver Leafletjs:
  • Thematic data (also known as discrete) represents features such as land-use or soils data.

  • Continuous data represents phenomena such as temperature, elevation, or spectral data such as satellite images and aerial photographs.

  • Pictures include scanned maps or drawings and building photographs.

You may check different multidimensional multiband files like Grib files, NetCDF files and Hdf5 files.

There are three main ways to display (render) single-band raster datasets:
  • Using two colors—In a binary image, each cell has a value of 0 or 1 and is often displayed using black and white. This type of display is often used for displaying scanned maps with simple line work, such as parcel maps.

  • Grayscale—In a gray scale image, each cell has a value from 0 to another number, such as 255 or 65535. These are often used for black-and-white aerial photographs.

  • Color map—One way to represent colors on an image is with a color map. A set of values is coded to match a defined set of red, green, and blue (RGB) values.

When there are multiple bands, every cell location has more than one value associated with it. With multiple bands, each band usually represents a segment of the electromagnetic spectrum collected by a sensor. Bands can represent any portion of the electromagnetic spectrum, including ranges not visible to the eye, such as the infrared or ultraviolet sections. The term band originated from the reference to the color band on the electromagnetic spectrum.

Get Band Information from WMS Geoserver Leafletjs

This demo shows the raster overlay on map with the help of Leaflet javascript library. The raster contains three bands as Red, Blue and green. Here raster data is in GeoTiff format and is published on Geoserver. This demo is about how one can extract the Bands information from layer. In similar way we can also extract values such as elevation, any natural hazards distortion or changes in data from layers.

Get Band Information from WMS Geoserver Leafletjs

For this demo we have downloaded data from  from one of the free data download website. It is a raster data containing three bands as blue, red and green. In this demo we render raster data on map and shown the value of bands using popup.

Raster data on GeoServer and styling:

GeoServer is an open source server for sharing geospatial data in both vector format and raster format. It is designed to host major datasets, which can easily render on maps.

To Download and install GeoServer please follow the last article. Then login to the GeoServer and publish data on the Geoserver and get the link from layer preview section. You can visit the articles to know how to publish and style the GeoTiff file on Geoserver and also how to make geotiff work with geowebcache for tiling.

For rendering layer on map, you need to create division for map.

var map = L.map('map').setView([34.84859848,-111.788002],5);
  L.tileLayer('http://{s}.tile.osm.org/{z}/{x}/{y}.png', {
  attribution: '&copy; <a href=”http://osm.org/copyright”>OpenStreetMap</a> contributors'
  }).addTo(map);
Render Raster on Map:

To render this data on map, we need to get the data from GeoServer, which can be done by using leaflet javascript library. In the Leaflet library, we have Leaflet-WMS plugin.

<script src="leaflet.wms.js"></script>
What is WMS service:

WMS (web map service), is a way of publishing maps. This format is similar to map tiles, but more generic. A WMS image is defined by the coordinates.

L.tileLayer.wms: It provides a simple interface for loading tiles from a WMS service. Here we also need to provide layer name, format of layer and make transparent as true.

var raster = L.tileLayer.wms('http://139.59.42.235:8080/geoserver/portfolio/wms?',{
    layers: 'HYP_HR',
    format: 'image/png',
    transparent: true
}).addTo(map);

In this way we can render raster data and have layer information. This information further can be used for analysis purpose. For example we can have vegetation index (NDVI) from values of bands. We can actually calculate the loss information if having two time series band information.

function showGetFeatureInfo(latlng,layer){
 var prop = layer.features[0].properties;
 var mark=L.marker([latlng.lat,latlng.lng]).addTo(map);
 var blue=prop['BLUE_BAND'];
 var green=prop['GREEN_BAND'];
 var red=prop['RED_BAND'];
 mark.bindPopup("Blue Band: "+blue.toString()+"
 <br>Green Band:"+green.toString()+"
 <br>Red Band:"+red.toString());
 document.querySelector('#demoR').innerHTML=red; document.querySelector('#demoB').innerHTML=blue; document.querySelector('#demoG').innerHTML = green; }
Get Band Information from WMS Geoserver Leafletjs

Check more:

Large GIS Data file on Web

Speed up the rendering of data

Comment below if you found any issue in getting band information in the box provided. Thanks.

Create and Measure Map Polygon Area – Quick Help

Creating Polygons shapes on digitized lands is easy as we already have some tutorial created for creating polygon with leafletjs. But ever wondered what should one do when they need to Create and measure Map Polygon area? The solutions for small challenges like this, which appears to be big for developers who didn’t worked on GIS earlier, is what we are providing here at Engineer Philosophy Web Services.

This case happened when one of the United States based ERP company, which operates in multiple countries, wants to provide a small GIS solution to be intergrated in their existing ERP system to their fertilization and agricultural sector client. As their client need a quick POC (Proof of concept) to digitize their land and calculate area in acres, they need a quick solution to be created. As their team is not expert in GIS and doesnot know which technology to opt for, they approached us around mid-night through our website chat box, as we provide 24/7 assistance with chat at our website. Quickly after talking to us and checked our ability, they turned to our GIS Consultancy Services, which helps them in getting solutions and consultant related to leaflet, geoserver or any other GIS related issues.

The Challenge – Create and Measure Map Polygon Area

Sometimes Mapping and Drawing Shapes can be challenging

Being a large ERP organization which operates with fertilization and agriculture clients to deliver and support its services to end user. Given the immediate nature of on-demand services, they expect instant support and exceptional services from us. This created a colossal consumer service challenge.

  • They needed assistance on setting up basic mapping within their .Net application which will then can be incorporated into the ERP system.
  • They needed tool for measure the polygon shape area that their clients will map on digitized lands from the ERP.
  • The Company also required an add-on, i.e. Geocoding along with maps, which can provide geographical coordinates corresponding to a particular location or address which their client might type in to search their address.

The Solution- Create and Measure Map Polygon Area

There is nothing Like Leaflet.js when it comes to mapping

To address these challenges, we analyzed and documented different solution which we can provide in an next hour. We suggested two best options with all the calculation of pros and cons for them –

The company decided to go with Leaflet.js, as it is open-source which saves them a reasonable amount of capital.

Then we worked on the solutions as follows –

  • Initially we used the Leaflet.js Draw plugin to create and digitized polygon which can be digitized, deleted and edited easily.
  • We also used Turf.js for evaluating the polygon area drawn on the digitized map because it gives more approximate results then the Leaflet.js Draw plugin.
  • When the company decided to go with the open source software, we again provided them with two options in their best interest i.e. MapQuest API and MapBox API for Geocoding purpose.
Final Result : Create and Measure Map Polygon Area
Geocoding : Create and Measure Map Polygon Area

Once we are done with coding part in next 3 hours, we showed the solution to the organisation. Get the feedback corrected some User Interface stuff and provided code to their developers. In an 1 hour we helped them to understand the code and integrate the same with their system.

The Result – Create and Measure Map Polygon Area

We are best in Overcoming challenges and providing the Best GIS Consultancy

We provided solutions for every concern related to map and gis challenges to the ERP company developers.

Final Result : Create and Measure Map Polygon Area
  • Provided hands-on assistance in setting up basic mapping within their .Net application which will then can be incorporated into the ERP system.
  • Consultancy and hands-on assistance with evaluating polygon area on digitized lands with Leaflet.js and the same saved polygon should be reopened and edited from the system.
  • Provided wonderful tool for Geocoding along with the maps and assistance on implementing it.

We here at Engineering Philosophy Web Services provides Services and Consultancy related to Leaflet.js, Geoserver, Geocoding, Web/App development and Other GIS tech factors.

PostGIS, Geoserver and Leaflet | GIS Web Development

In this article we will see how data can query in Postgres and store and view at Geoserver and Leaflet i.e GIS Web Development with PostGIS, Geoserver and Leaflet. For this you will require setup of all three. You can visit our tutorial to install Geoserver For Linux or geoserver install in windows, Postgres and Postgis installation for Ubuntu 16.04. and a basic of Leaflet Js Javascript Library. If you are done with intial setup, then we can first start with to adding Shapefile in postgres by creating  database in database.

PostGIS, Geoserver and Leaflet | GIS Web Development – Steps

Step 1: After installing Geoserver and Postgress postgis in your system you need to download dataset. The data we are using is shapefile for this tutorial, which you can download from the sources given in this post. The shapefile can be administrative boundary or road network etc. For any region. This website will help you to download zip file as well, which will have all supporting file for shapefile.

Step 2: Now you need to open Postgres, add database, table and add shape file using shp2pgsql. This all has been explained in our tutorial.

Step 3: Start Geoserver by running shell file provided in bin folder of geoserver. That can be run by executing the given command on terminal.

cd <path to Geoserver/bin>
sh startup.sh

Then Open browser and type

http://localhost:8080/geoserver 

and login by using your credentials. Generally its admin as username and password as geoserver.

Step 4: Now create a new workspace on Geoserver. Now Move to workspace option in data section by providing required information. Create new store as PostGIS and provide information required.  Here you need to give workspace name and data source name you created. If you want you can write the description about your data.

PostGIS, Geoserver and Leaflet | GIS Web Development

Now you need to provide connection parameter.

PostGIS, Geoserver and Leaflet | GIS Web Development

Dbype is the type of database, you can leave it as default or can specify your database type. Host and port: these are the parameter, which help geoserver to connect with postgres. The Host is space where database exist. The port to connect with postgres host, you can provide if you have set any otherwise make it as 5432.

Database: this is the database, which you have created using postgis. You are not sure about the name you can check it on pgAdmin or in terminal.

\l : this will provide you the list of available database. For this you must work with proper user-name.

Schema: to know your table, which you have created in database you can execute \d as this will provide you list of table associated database with their schema.

User and Password: this the USER with whom you have created database. In postgres you can create a new user with proper password.

Namespace: Namespace to be associated with the database. This field is altered by changing the workspace name. Remaining option you can leave as it is. And save the information.

Stpe 5: Now open the Layer option in data section, searched for your workspace and publish the layer.

Stpe 6: Here you will see tabs as data and publishing. In data tab you need to provide the reference coordinate system (CRS) by clicking on compute from data or compute from native bounds. After this you can save this layer with default styling. If you want to style your layer, which includes color, symbols etc. You can visit our tutorial styling vector data.

Step 7: Now moving to layer preview option in same data section. Here you can see your shape file.

Step 8: The shape file now can be render on map using leaflet javascript library.

For that you need to create HTML file, add leaflet library. After this create a div, which will contain map. Using L.map() and initialize the map and set view using setView() this takes center latitude longitude and zoom as arguments. You can check how to load a layer of polygon, point or polyline in leafletjs.

After that the shape file using L.TileLayer.WMS() , provide the base WMS URL, and specify whatever WMS options you need. The option can be layer, transparent and format etc. After this  use addTo() function to add layer to initialized map. Open that HTML file on browser to see the map with rendered shapefile.

Hope this PostGIS, Geoserver and Leaflet | GIS Web Development helped you in creating a map layer of shapefile which is loaded in postgis, and added the wms layer from geoserver which is then served as map in browser with leafletjs. If you find any problem in understanding the same, do let us know by commenting below.