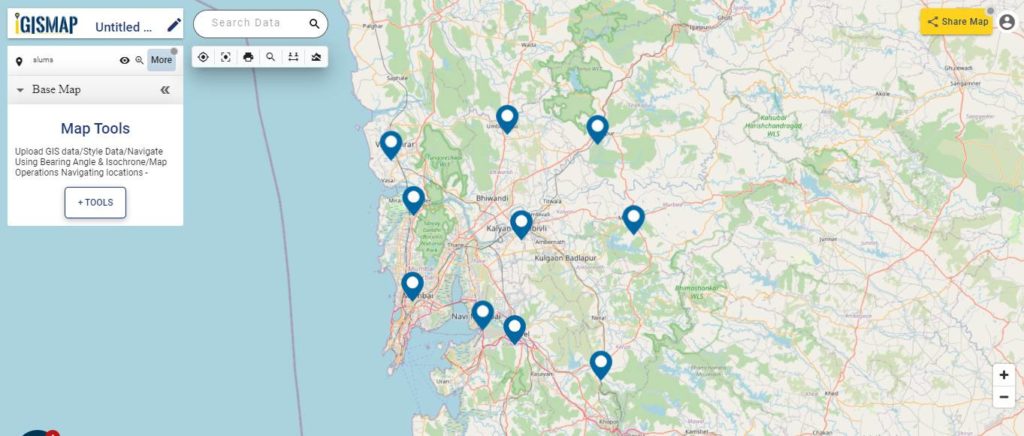
Structure of telecommunication networks are complex and create large quantities of geographically dispersed data. Consider you are a data engineer working in the telecommunication sector who wants to plot telephone pole locations with its attribute data to keep the track for its operations and maintenance. The attribute data added with the plotted locations can help you to observe information associated with each telephone pole and maybe embed this map on the department website.
GIS technology is advancing in various field including the telecommunications sector to build maps and perform GIS analysis. Limited GIS software are available that provides services in both creating maps and hosting them on websites. GIS mapping enables people working in telecommunication sectors to enhance network planning, deployment, maintenance, operations, and even sales and marketing.
MAPOG gives powerful tool sets to create interactive maps of locations and geospatial features associated with any applications based on social services, business analysis, scientific research etc. Using the tools in the IGISMap application, we can track, maintain and analyze the telephone poles. IGISMap is a web platform providing multiple GIS applications that are most important in the field of geospatial analytics. GIS tools of IGISMap application allows users to Add Data, Create Data, Map Data, Style Data, Process Data, Analyze Data and also help users to Share Data privately or publicly.
How to plot Telephone pole locations online with Attributes?
Create Point Data tool of IGISMap is a powerful GIS tool to plot point vector data to represent locations and point objects with latitude and longitude value. Using this online tool, we can plot the locations of telephone poles and can add the attribute data to each location of the data created.
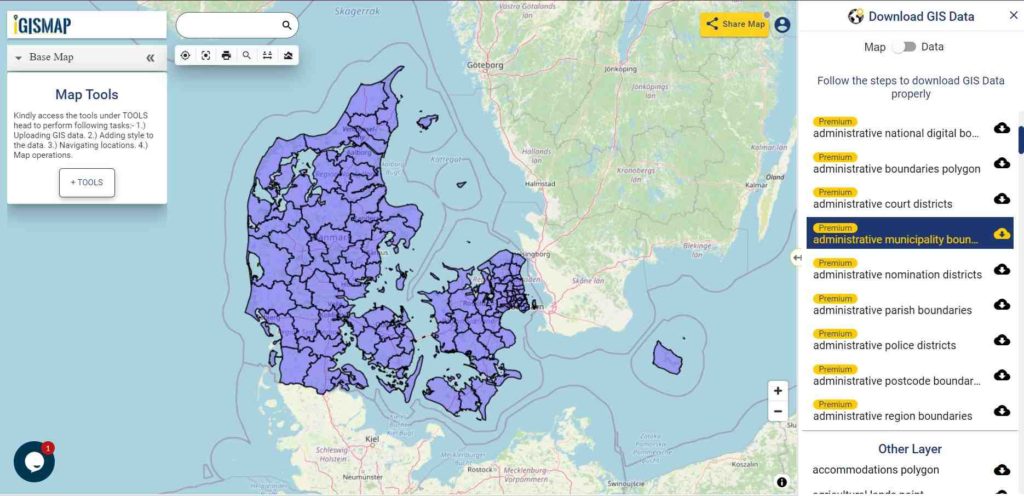
Click https://story.mapog.com/ to open Create Point Data tool

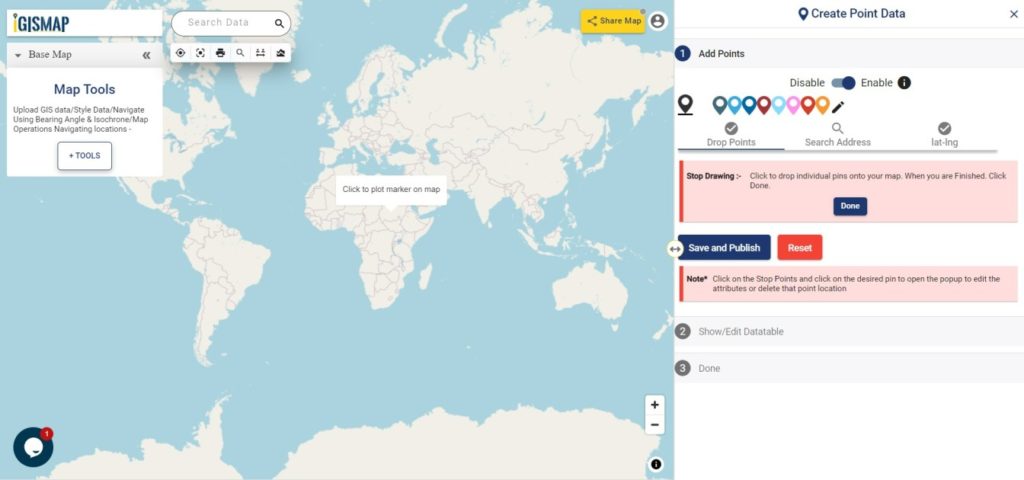
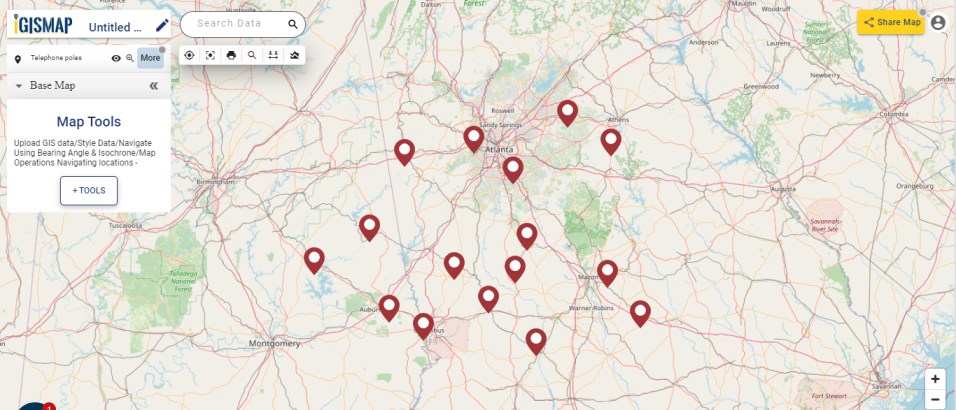
Start Plotting Points for Telephone Pole Locations
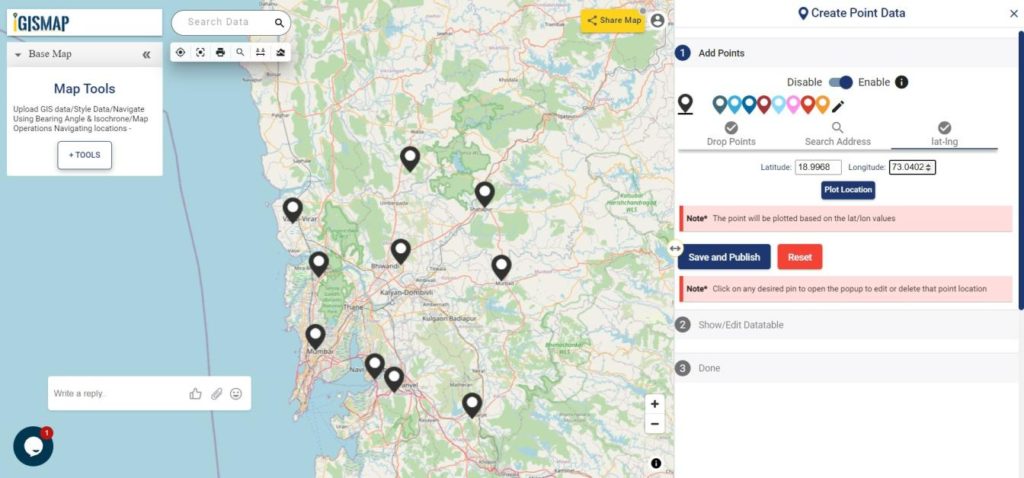
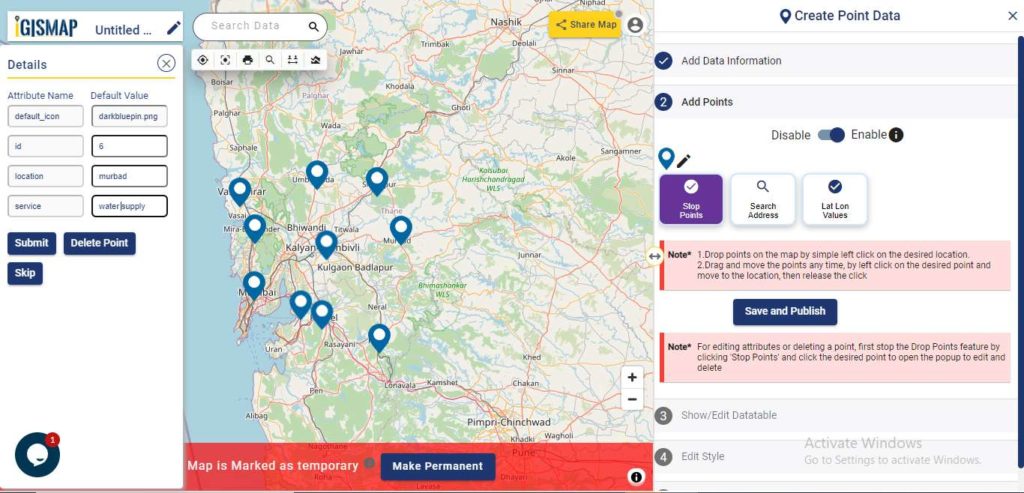
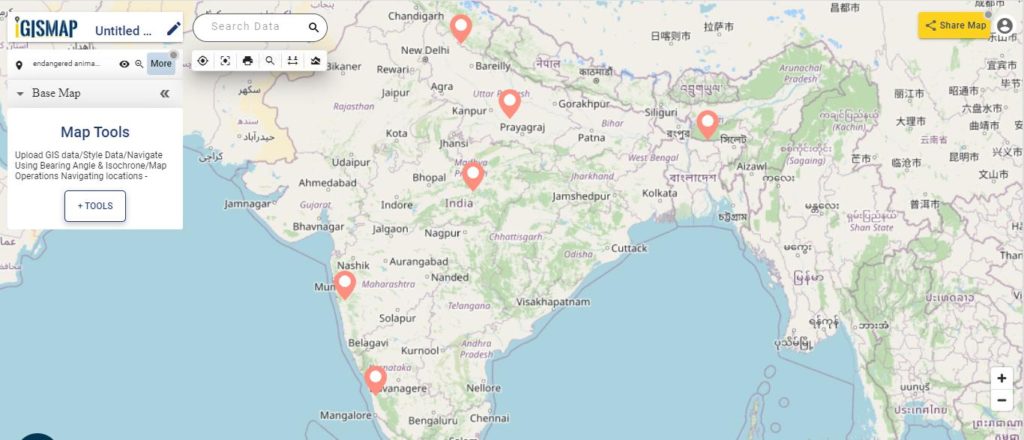
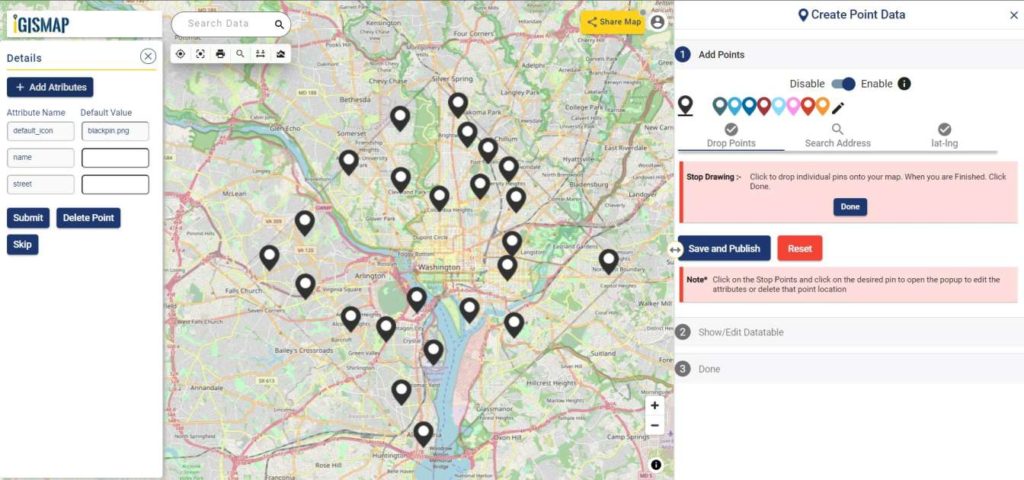
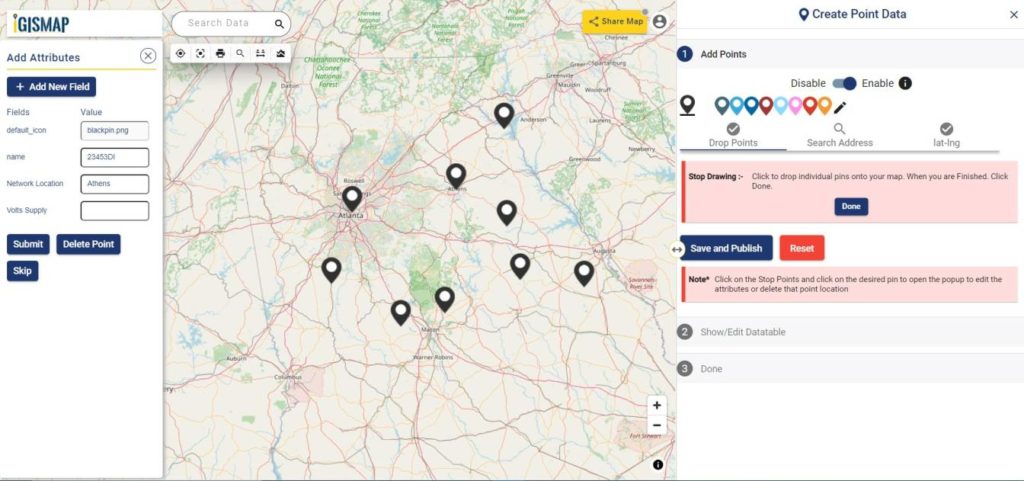
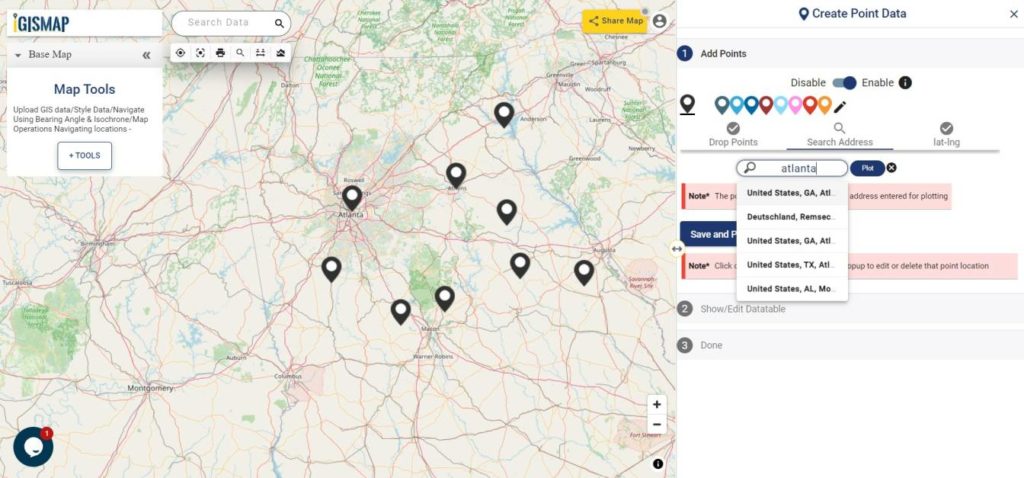
First step is Add Points, where we can start plotting the telephone pole locations as pins. IGISMap provides you with three features for plotting points: Drop Points, Search Address, and Lat Lon Values.
Drop points let us drop a pin at the desired location on the map. Zoom to the location of the telephone pole and click to add the pin.
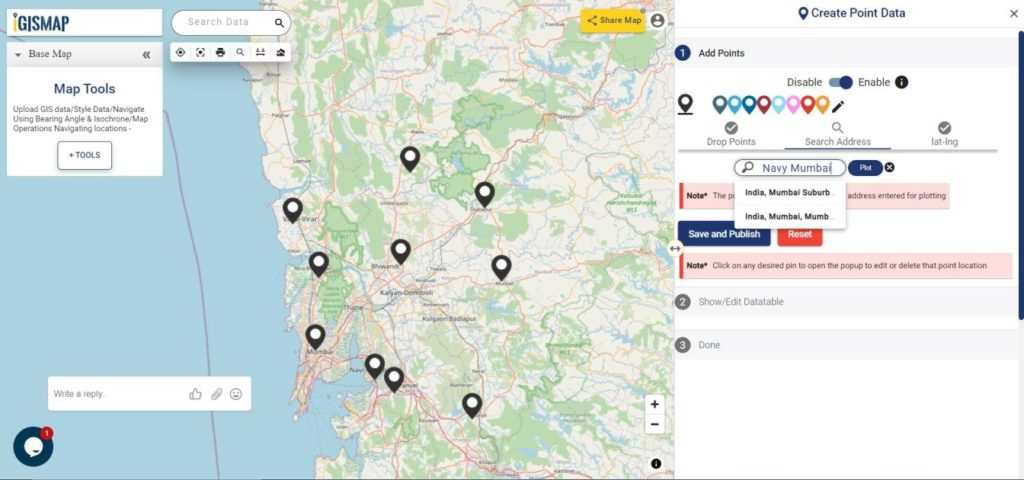
Search Address option opens a search address box, where you can enter an address and choose the right location address from the dropdown and click the Plot button to plot a point on that location.
Lat Lon Values will open two boxes to enter latitude and longitude values of the location you want to plot, Plot Location button in this option will plot a pin at the location you have entered.
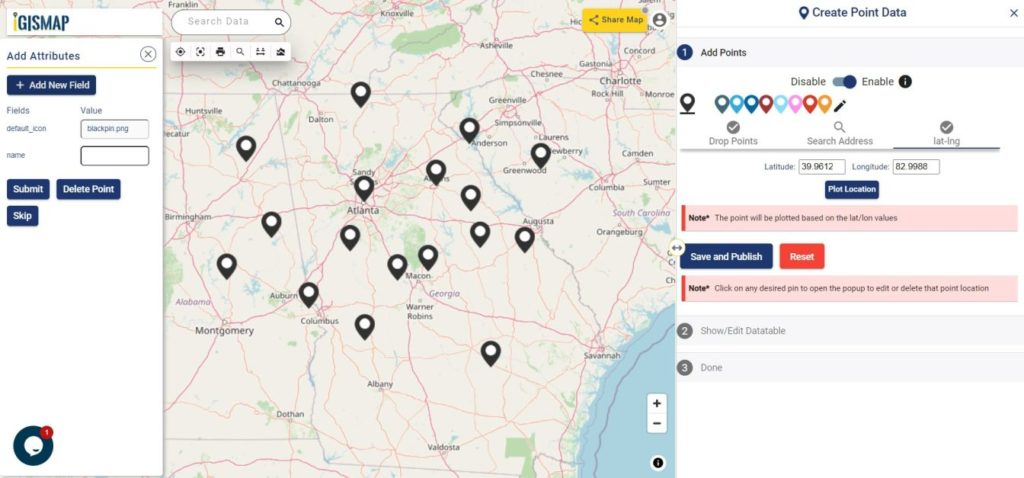
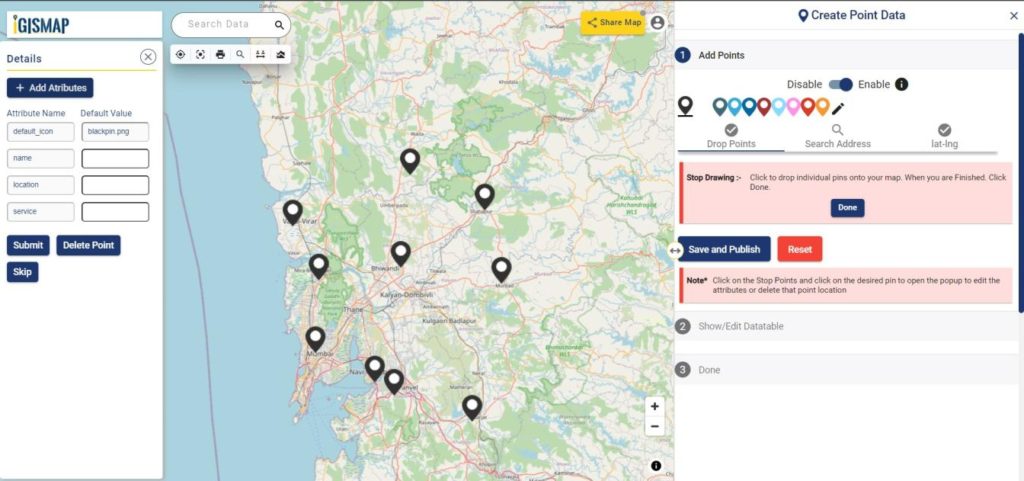
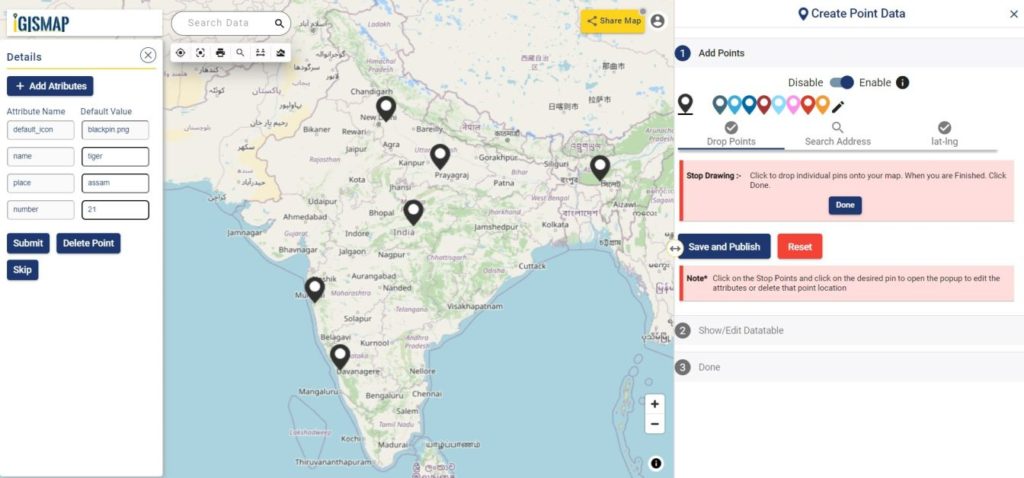
Also, a popup will open for entering attribute values in each attribute field for that telephone pole locations when a point is plotting. Click the Submit button to submit the save the attribute entries. You can choose to delete the point you plotted by clicking the Delete Point button. You can disable the default opening of this popup using the toggle button.

But we can open this popup anytime while plotting, by simply clicking on an existing pin.
Note: If the Drop Points option is active for dropping pins, it should be unselected for selecting the plotted pins to open the attribute popup.
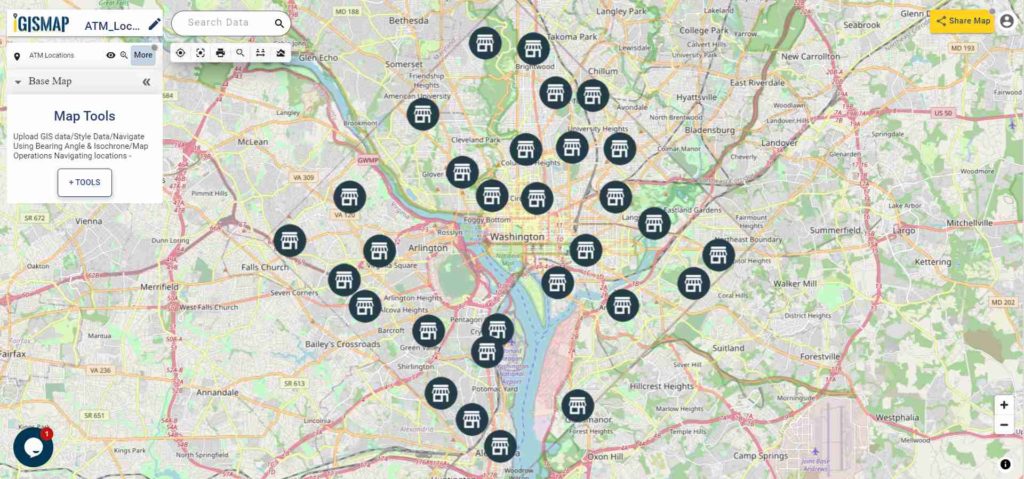
After plotting every desired slum locations for our data, click the Save and Publish button to publish your data in the map.
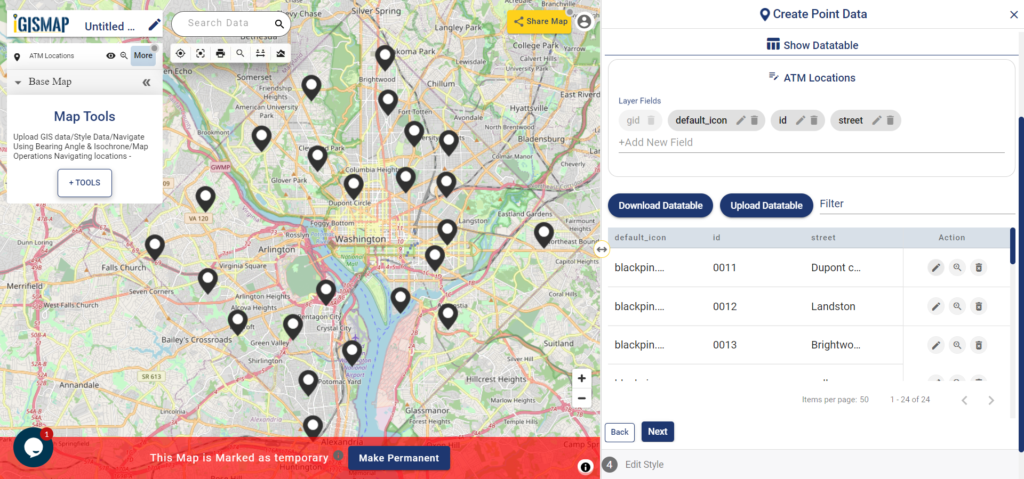
Review and edit the datatable
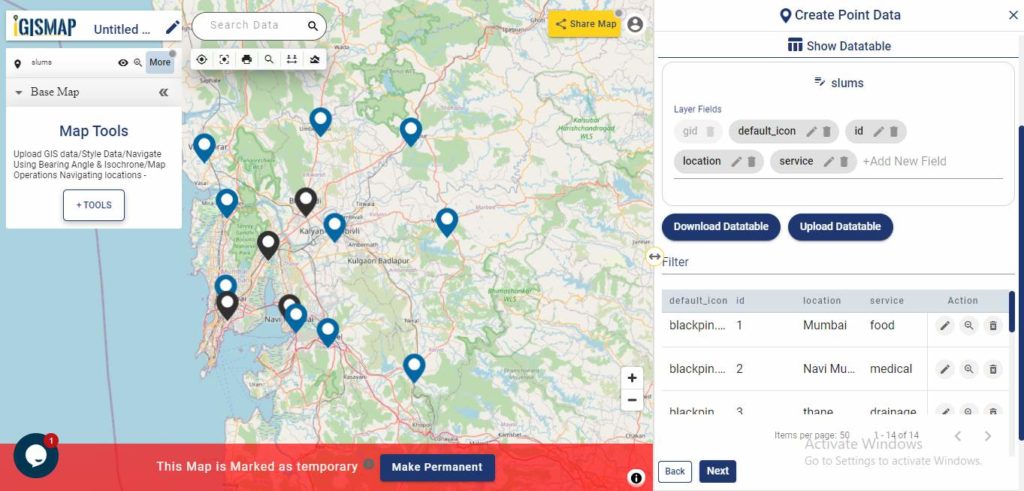
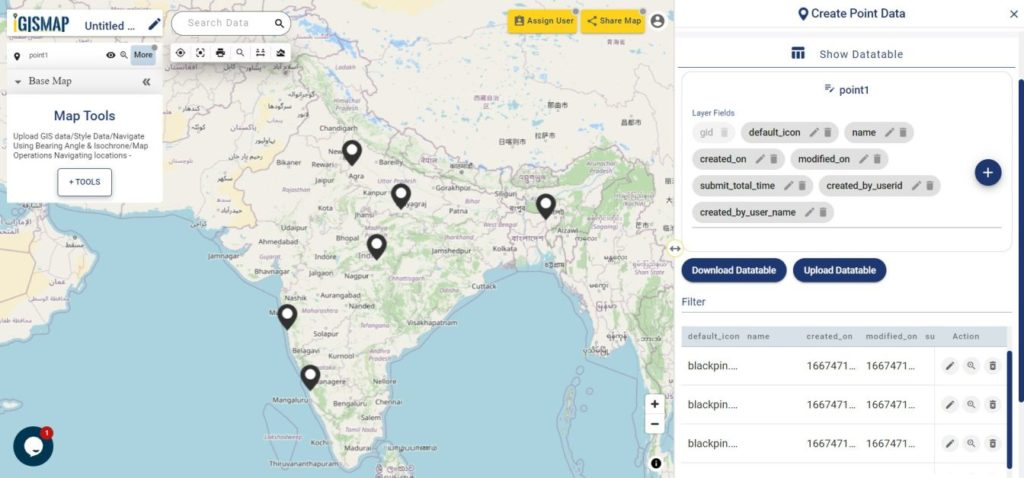
After publishing Telephone poles, Show/Edit Datatable section will be opened. Here you can edit the attribute values entered for each point location after clicking ![]() button in the datatable along each row in the datatable. You can also choose to delete a point by clicking
button in the datatable along each row in the datatable. You can also choose to delete a point by clicking ![]() button.
button.
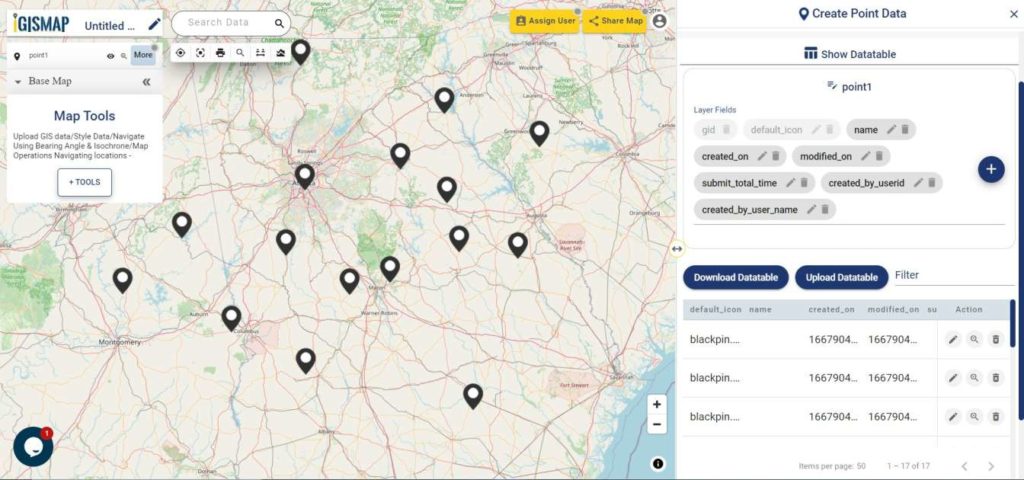
Options to edit or delete the attribute fields are also available in this step along with the option to add new attribute fields to this data. If you thought of adding more points to the data of ATM Locations, select the Back button to go to the Add Points section, where you can add more points and make changes to the already published data.
Option to update the data table as bulk is available in this section. Where the whole data table can be downloaded in Excel format using Download Datatable button. And to make the changes outside IGISMap, then upload the edited/updated spreadsheet file using Upload Datatable button and integrate with the same point data of ATM locations.
After making all the changes in the datatable, let’s move to the styling section by clicking the Next button to finish plotting.
Style Your Telephone Pole Points
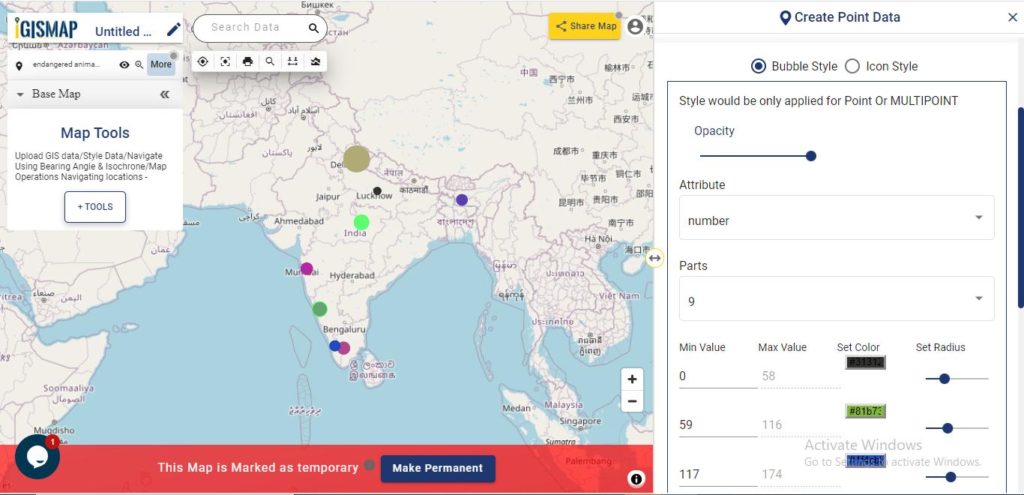
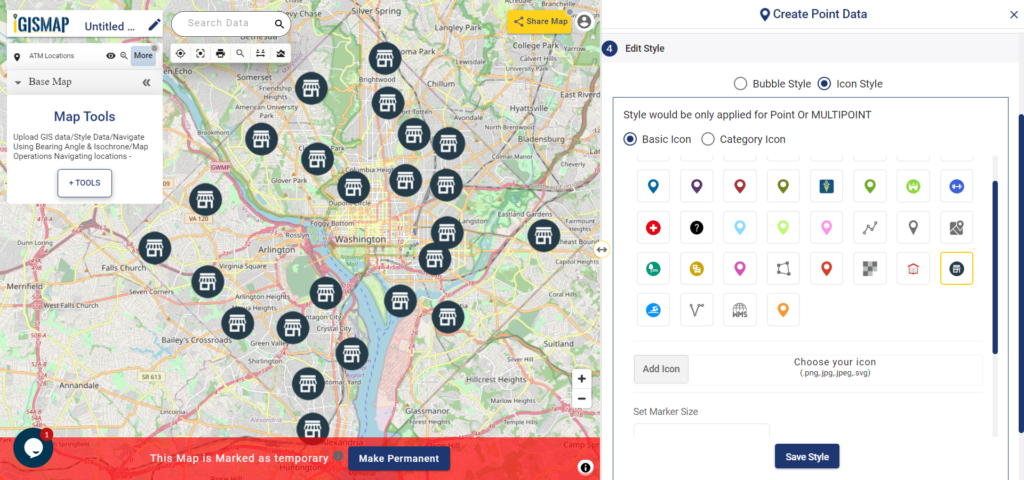
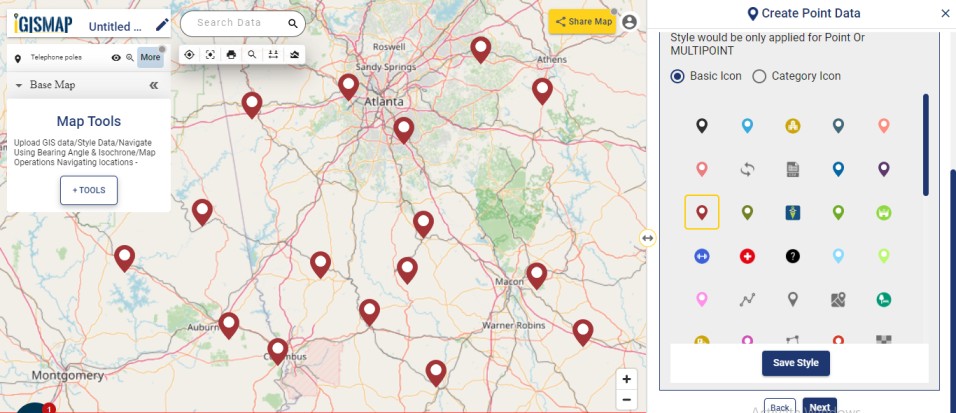
A map will become more meaningful if appropriate icons and colors are used to visualize the features of the map. In IGISMap styling options, Bubble Style and Icon Style are provided for point GIS data.
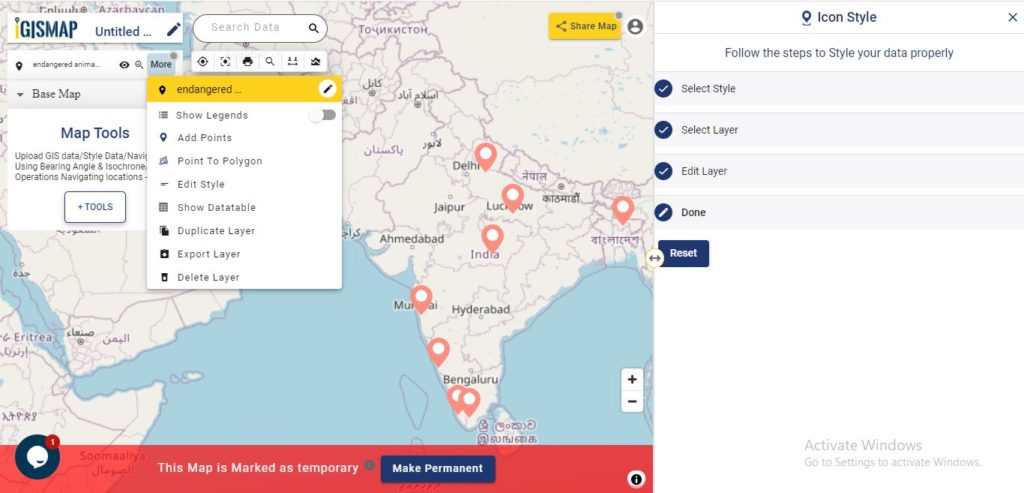
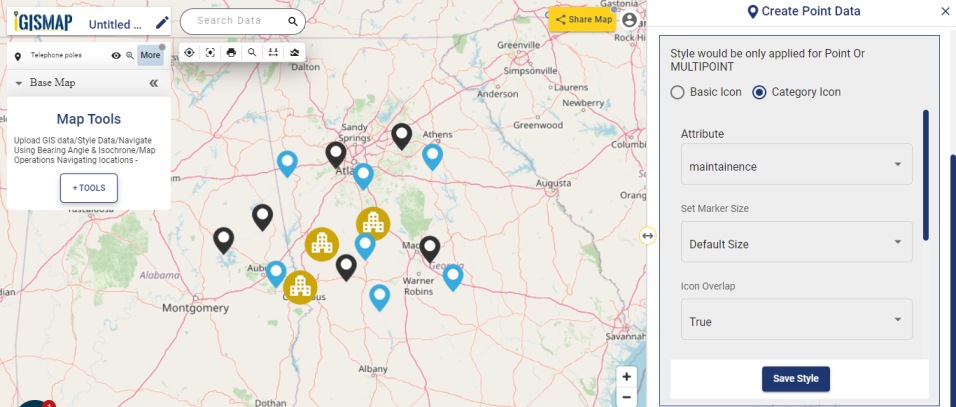
In Icon Styling, IGISMap provides two more options – Basic and Category styling. Basic Style will provide an appropriate pin icon for styling the telephone pole points and apply it on the telephone poles data as follows.
Another style is the Category Icon styling, where users can select the category on the basis of which styling is added to the point data. For example, if the user selects maintenance attribute as a categorical option, style is changed to symbol using those items.
Check this article to understand How to style point GIS data categorically using Icon Style tool
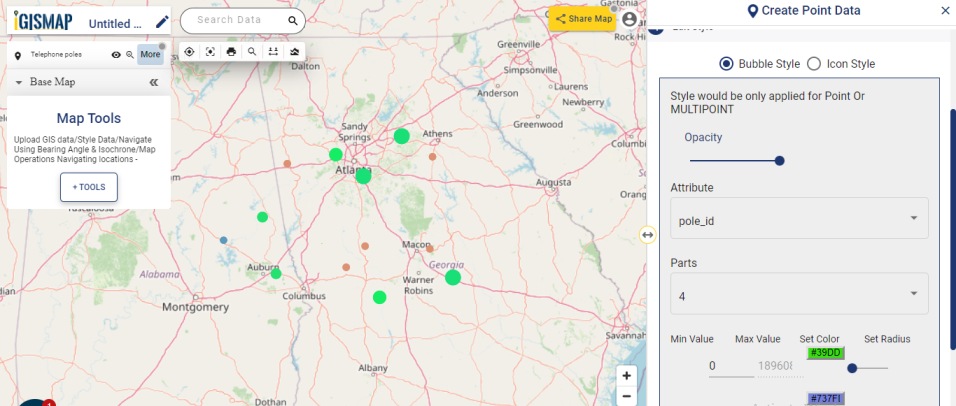
Bubble style is used to visualize the data quantitatively based on the numerical fields in the datatable. We can assign the size and color of the bubble for each class of values.
Check this article understand How to create Bubble Map for point GIS data
Click on Save Style option to save the Bubble style option for the added points.
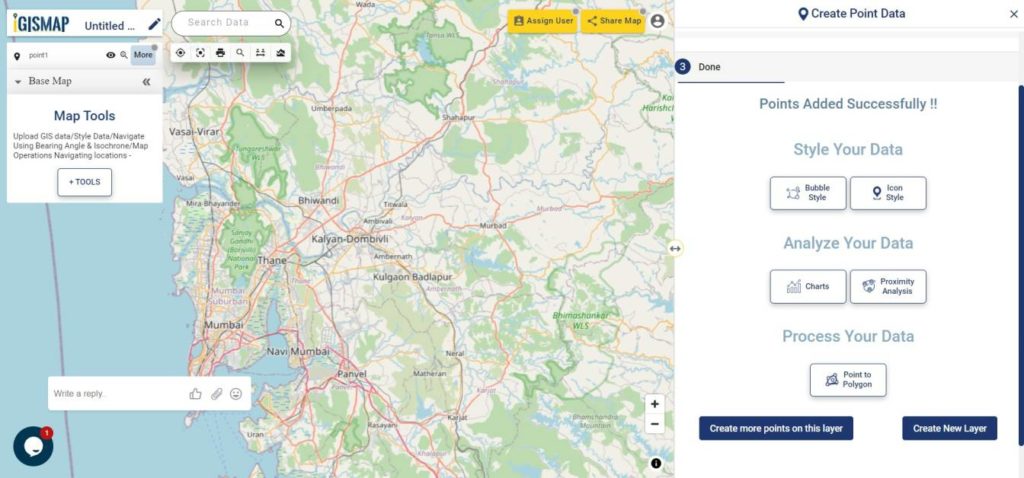
It’s done! Now if the user wants to add more points, click on Create more points on the layer option. If the user wants to create a new layer, select Create New Layer option.
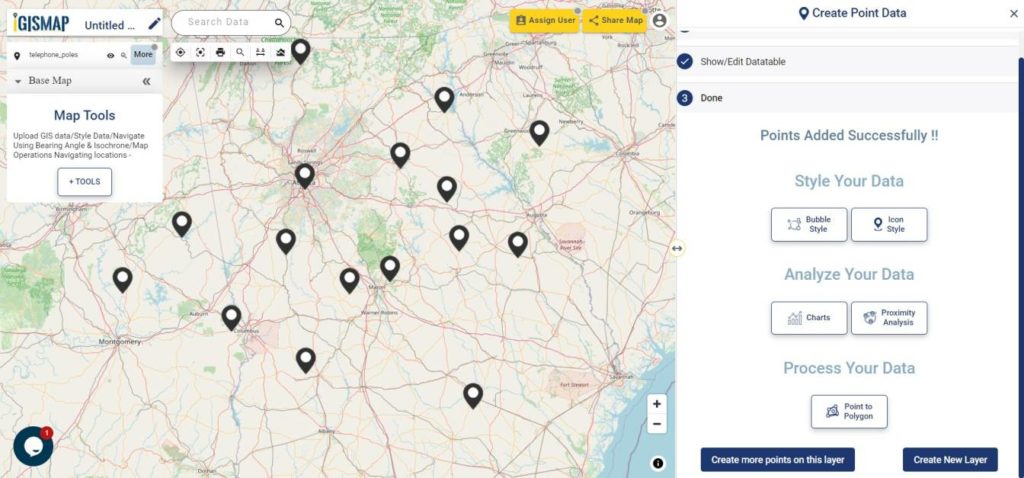
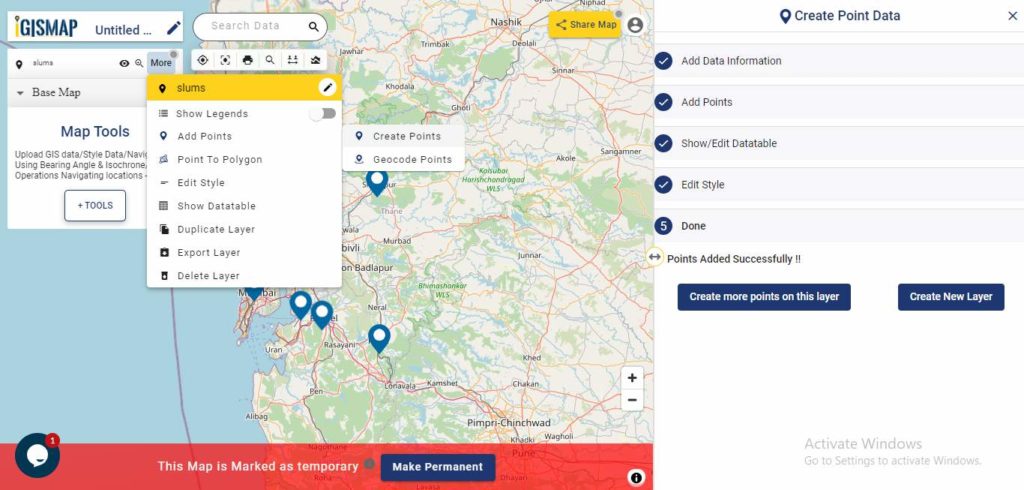
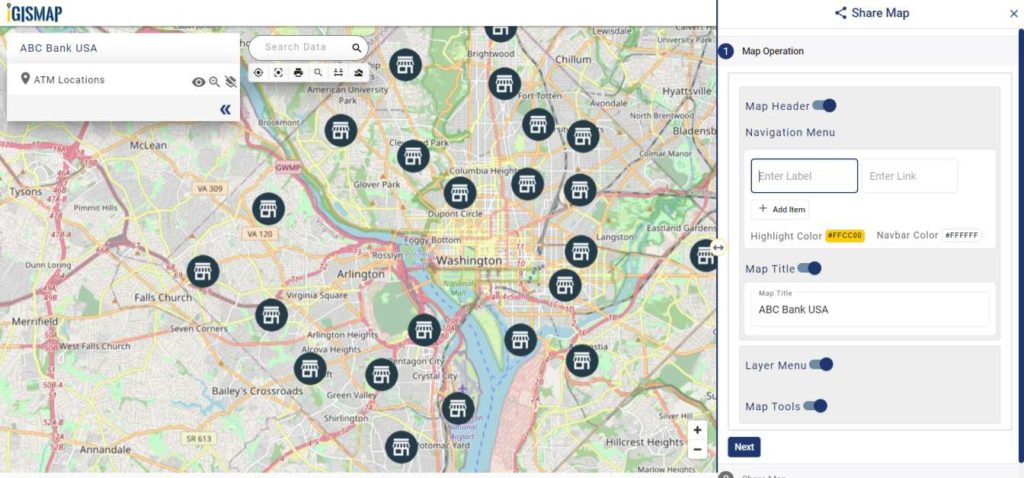
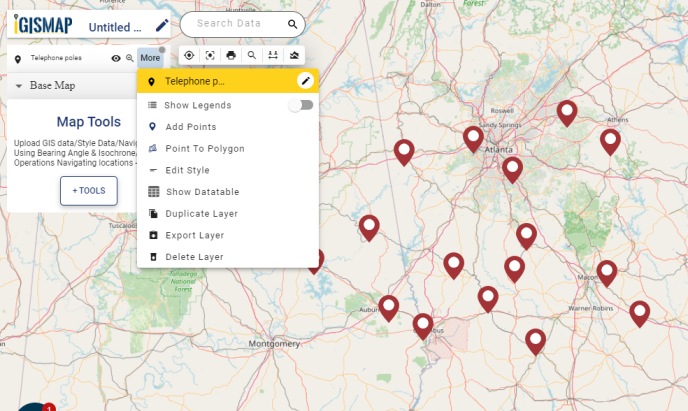
After the point GIS data of telephone pole locations is published in the name Telephone poles, More option beside the data provides list of other features. They can be used for adding more points, showing the legend in the map, editing the style and more.
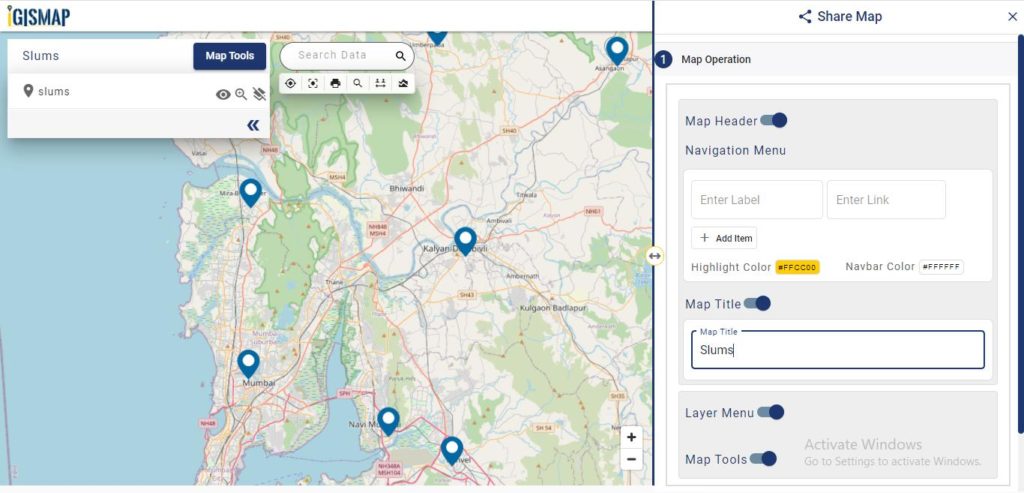
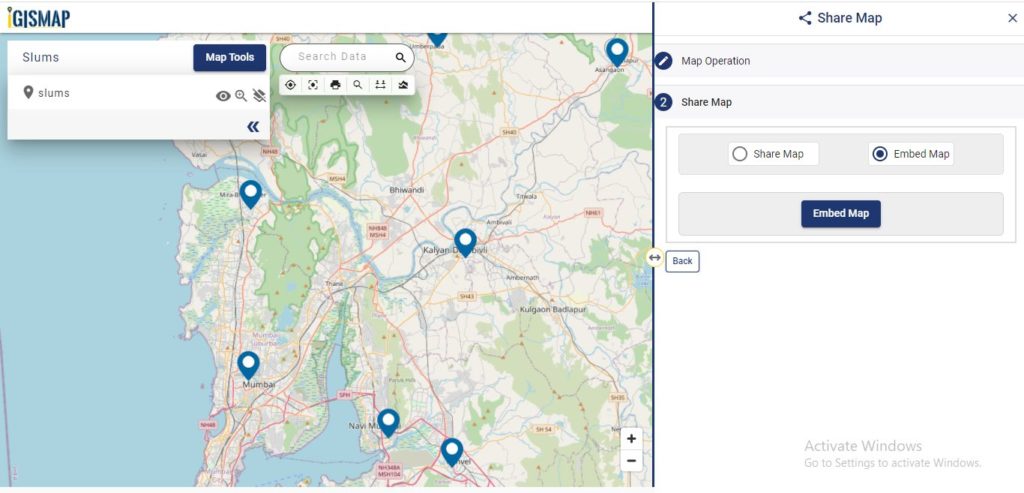
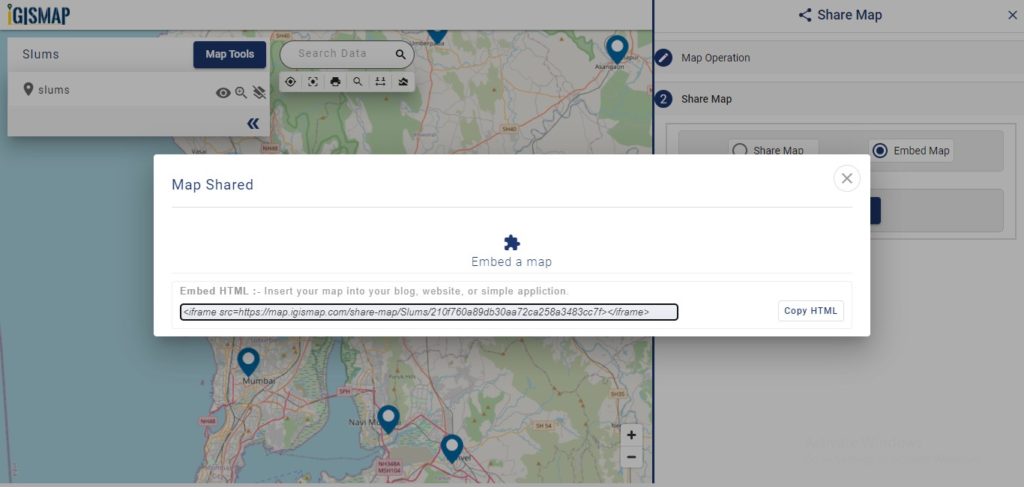
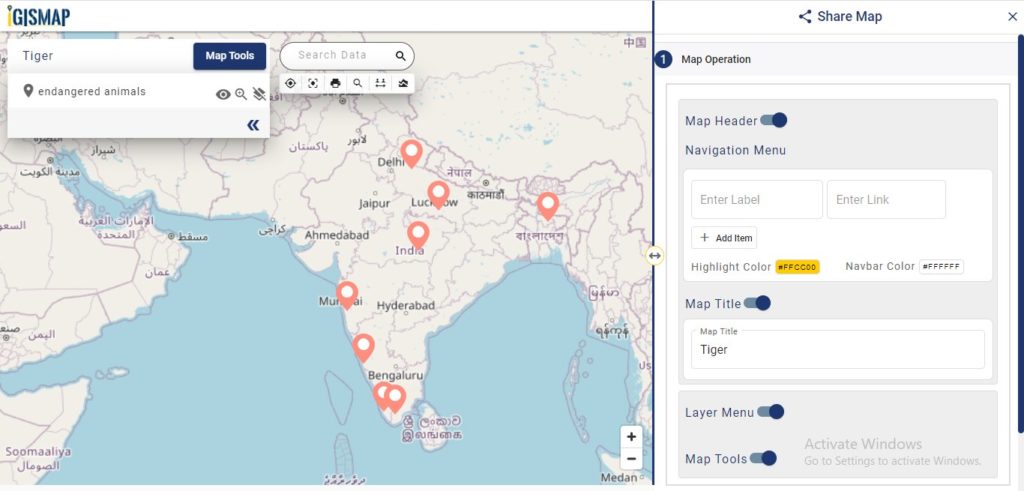
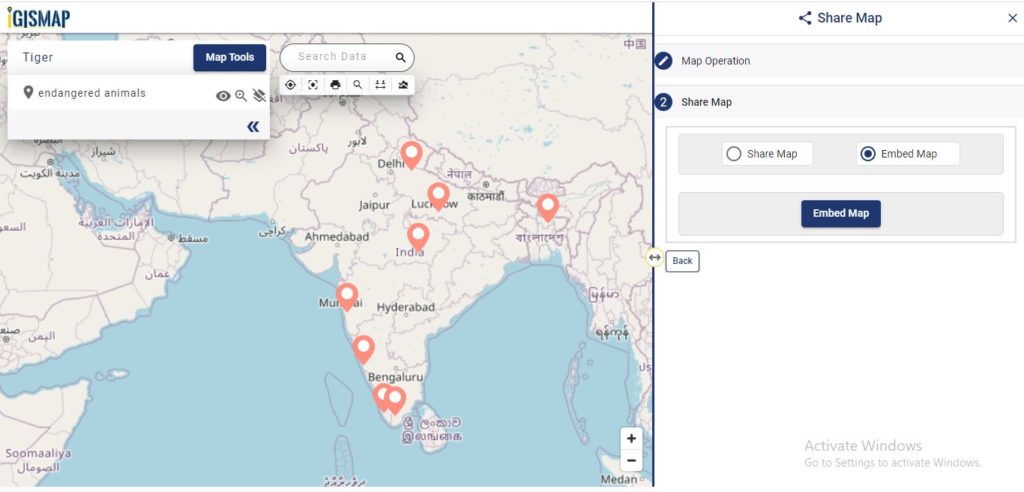
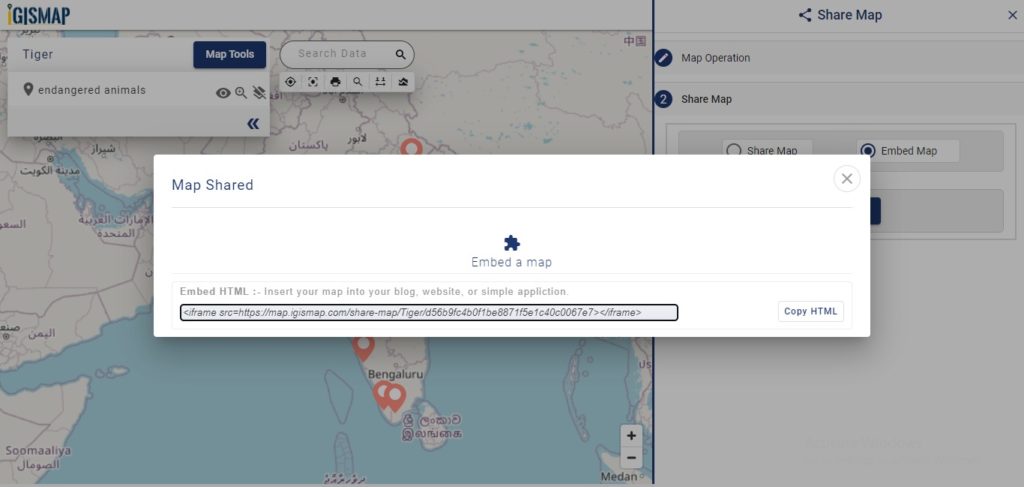
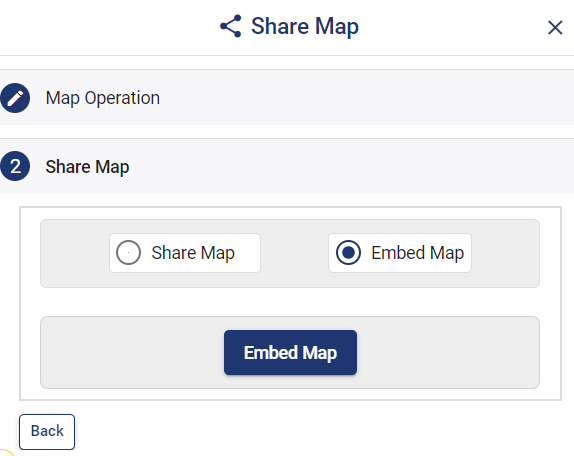
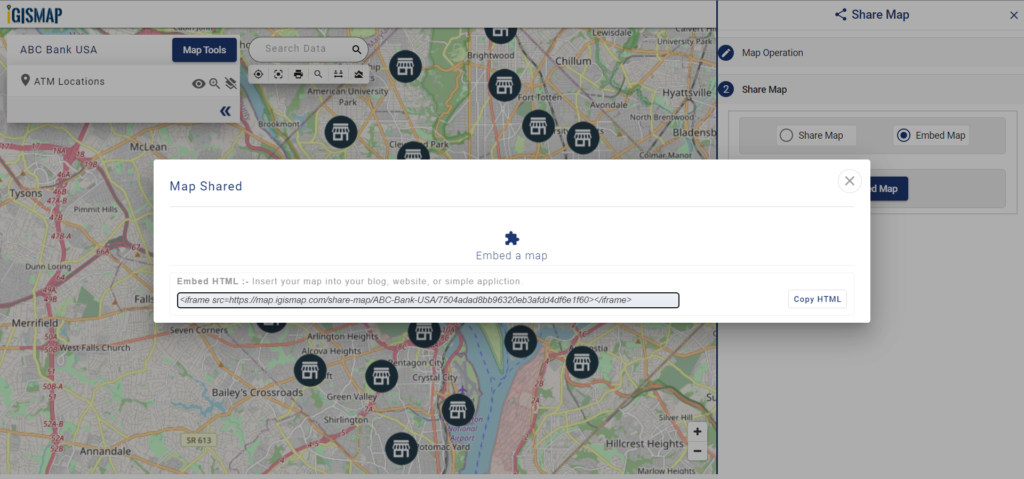
Check the article Share your Map to understand about Share Map feature of IGISMap.