Nowadays people are switching towards buying electric vehicles, suppose you are a person who wants to set up charging points in each area. The person has some questions like how many charging points are present in that area. Which area has least charging points in that area? What is the distance between two charging points? GIS technology can easily answer your questions by performing Proximity analysis.
The use of GIS technology is advancing in the field of information and computer science as demand for maps and geospatial analysis has become important in both the public and private sectors. Limited GIS software and online tools are available where you can do this job.
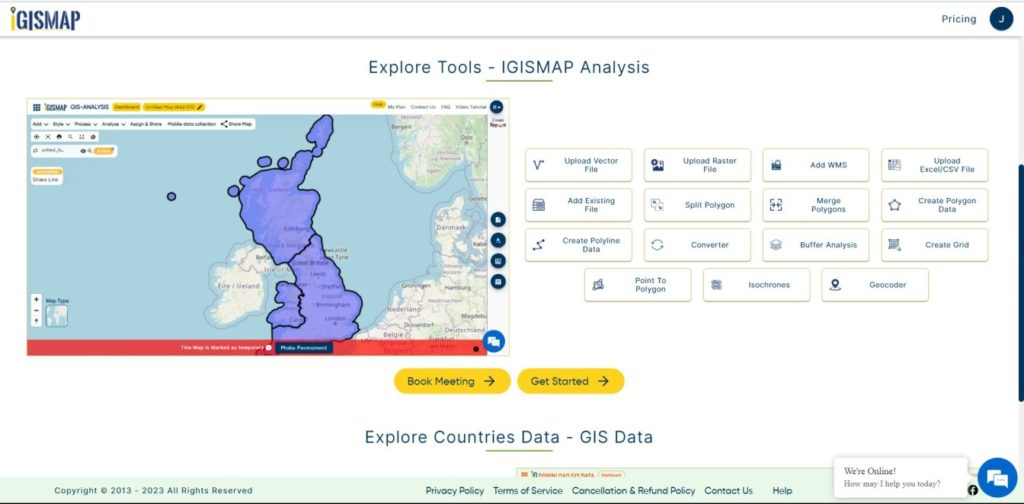
MAPOG is a GIS-based web platform providing multiple GIS applications that are most important in the field of geospatial analytics. The peculiarity of IGISMAP in the GIS Industry is its UI/UX which helps the user to perform effortless geospatial operations. GIS tools of IGISMap allow you to Add Your Data, Create Your Data, Map Your Data, Style Your Data, Process Your Data, Analyze Your Data and also help you to Share Your Data privately or publicly.
How can we perform Proximity Analysis over Data by adding GIS data from the IGISMap?
MAPOG application provides GIS data based on countries, US states, and Global levels. IGISMap provides you with the GIS DATA tool that provides GIS vector layers of administrative boundaries such as country, states, districts, provinces, postcode boundaries, and other geographical features such as roads, farmlands, waterbody, etc. These data present in the IGISMap application is available for more than 30 countries, 51 US states and few spatial data of globally distributed features.
The data present in IGISMap are mostly from Open Street Maps. Administrative level data are collected from various government websites and other authentic online sources such as US Census Bureau, Humanitarian Data Exchange, Census India, etc.
Proximity Analysis is a tool that helps us to measure, understand and relate geographic(location) information with real world objects. Proximity analysis is one way of analyzing locations of features by measuring the distance between them and other features in that area. IGISMap application has the Proximity Analysis tool which helps you to filter the data using the attribute filter and/or custom filter. After adding GIS data to the base map, we can perform Proximity Analysis to filter the feature according to our requirement.
To navigate directly to the Add GIS Data tool, use below link to refer.
https://story.mapog.com/app/gisdata
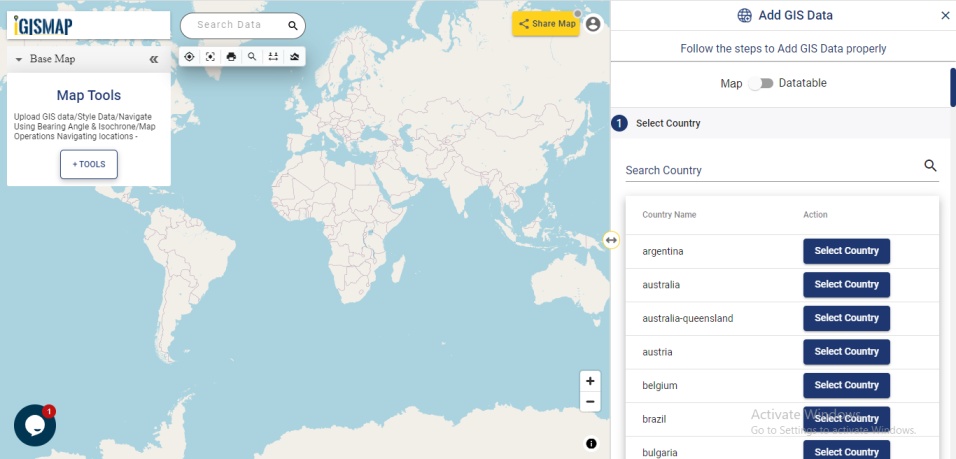
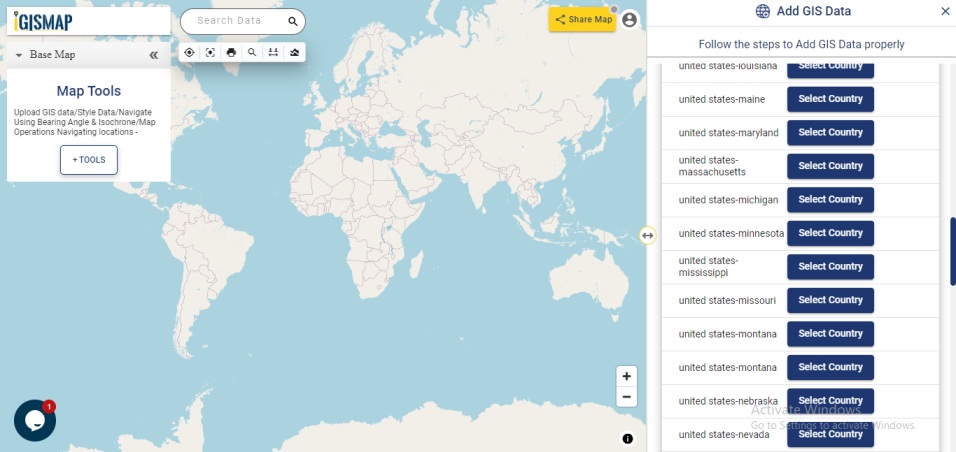
Select Country to Add your Data
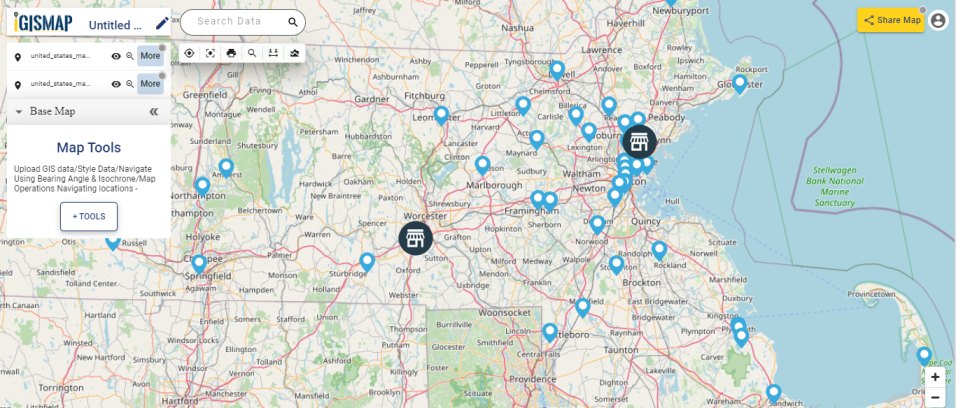
In this section, select the Country Name from the list below provided or you can search the name in the search box. Here we will select the United States of America- Massachusetts, from the list as we want to add data based on Massachusetts state of USA.
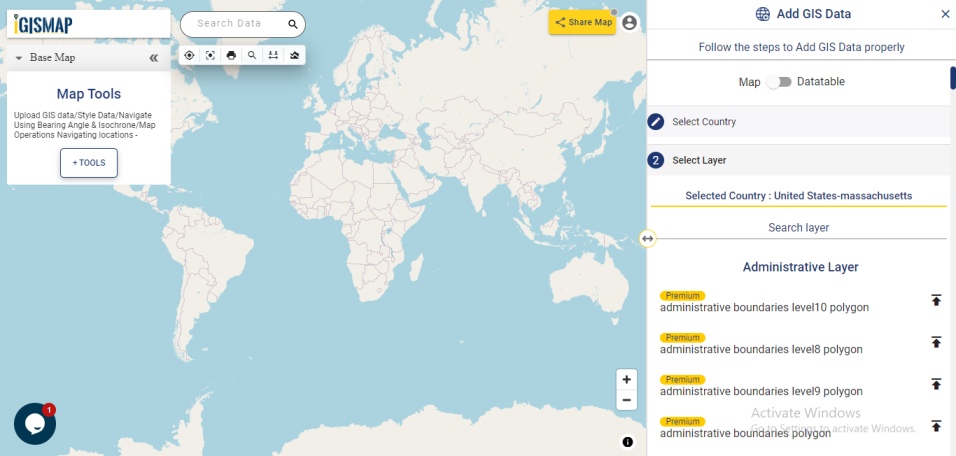
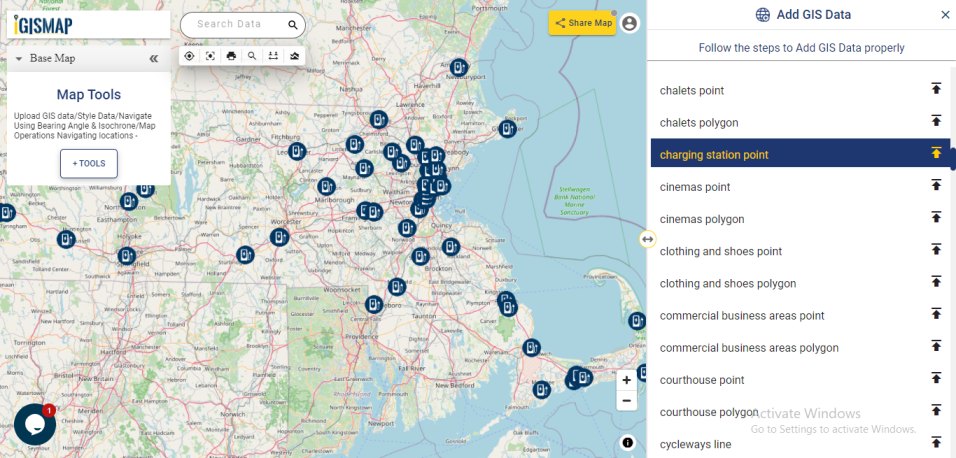
Select data
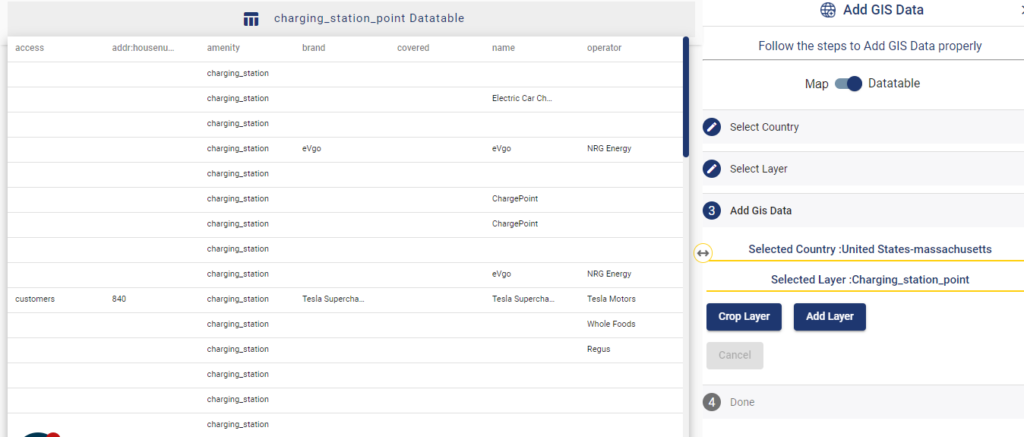
In this article, we will use the GIS data of chargin stations for demonstration. Thus select charging station point from the list of data.
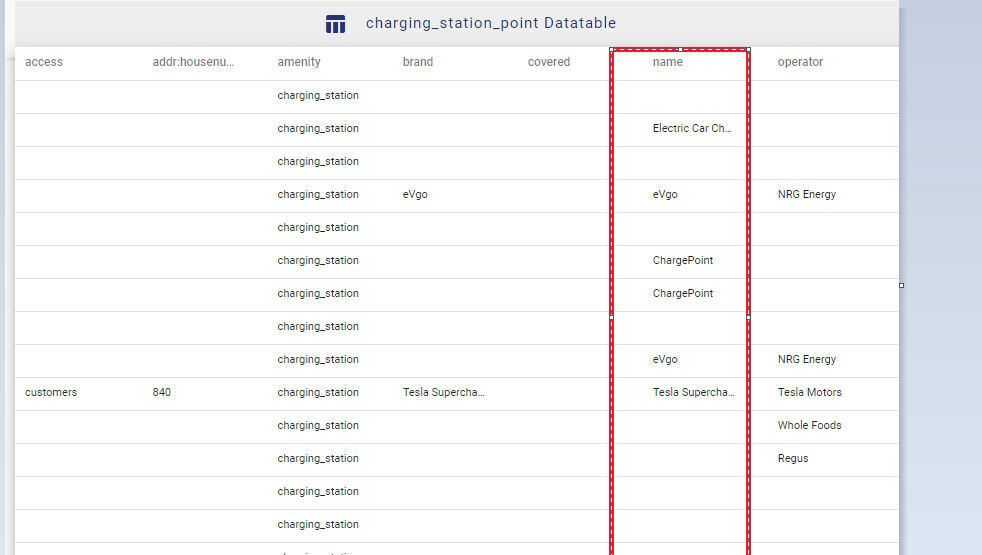
The button to view the datatable or map  can be used to switch the view from Map to Datatable. If the information about the datatable present in the add layer can be viewed by the user by switching the mode towards the datatable option.
Adding data in the map
In the above section, we added the charging point station of USA-Massachusetts to the base map. If we need the desired portion of the added GIS data, you can make use of the crop layer tool in GIS Data to extract the features.
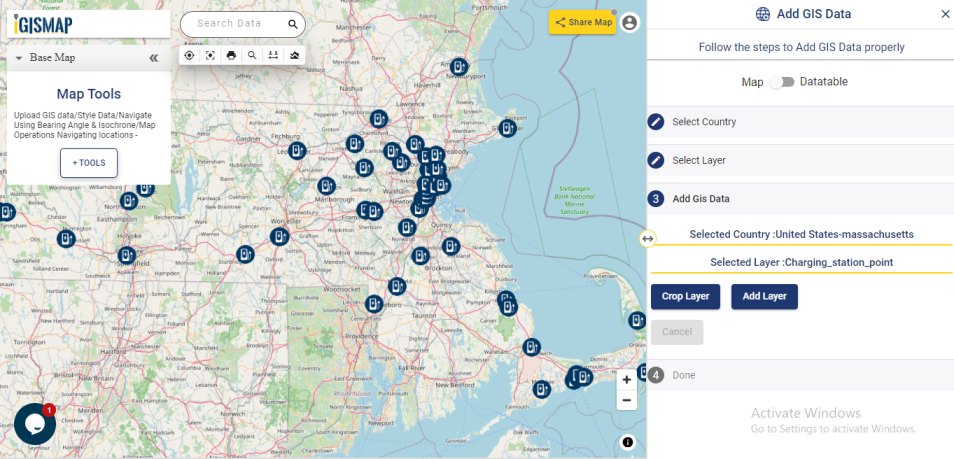
Users can notice that the selected country and selected layer data name in this step to verify the details. Now click on Add Layer, to add the charging station points of USA- Massachusetts to the base map. Click Add Layer.
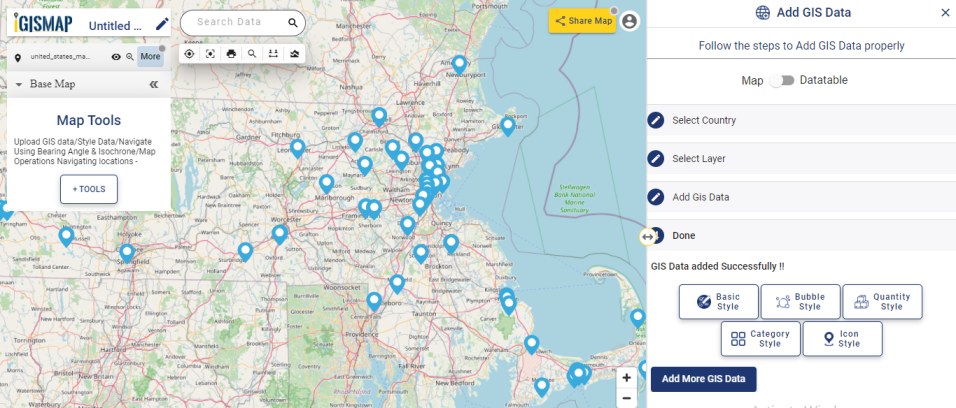
You can observe that GIS data has been successfully added.
Download Shapefile of Massachusetts Charging Points
Proximity Analysis on Added GIS data
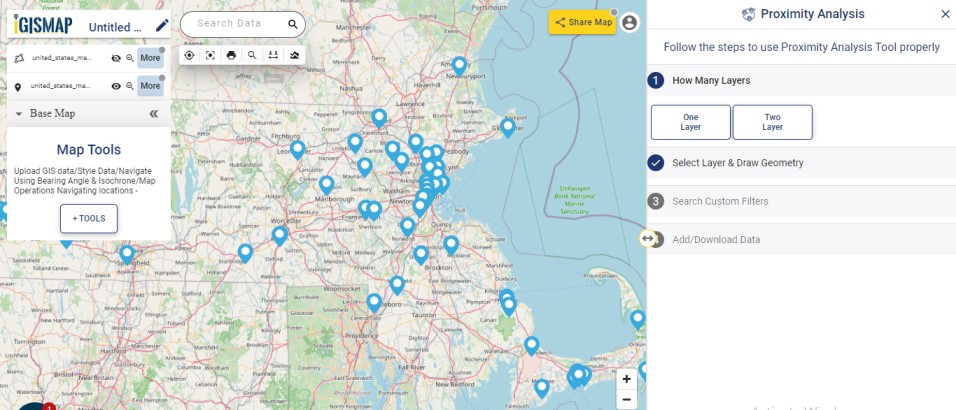
Click on from Map Tools, you can observe a lot of options to map, process, visualize and analyze your GIS data. Under Analyze Your Data title, select Proximity Analysis tool.
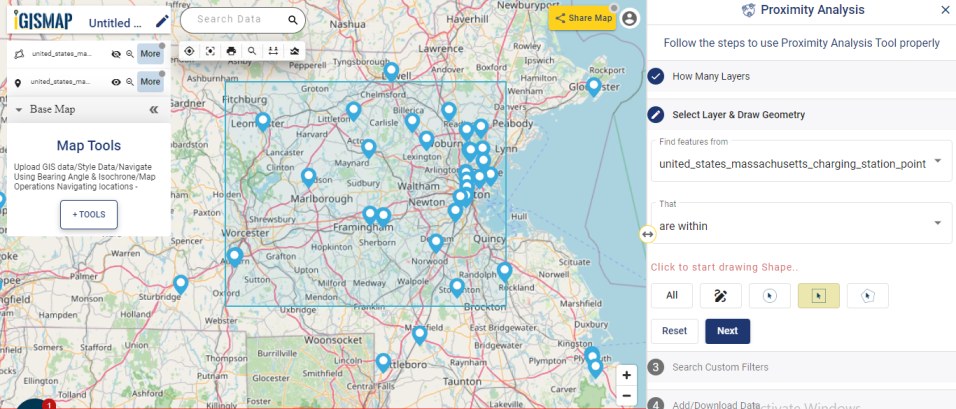
In the first step, the user needs to select layers for performing proximity analysis. Here we can select One Layer/Two Layer from the option. For example, select one layer as we want to perform proximity analysis on charging stations points in USA-Massachusetts.
Attribute and Custom filtering the added data
There are two ways to perform Proximity analysis in a IGISMap application:(1) Selection using layer Attributes and (2) Custom Filters. Select the data, united_states_massachusetts_charging_station_point to find features within the layer. Select the area using the drawing tools to find the features within/close/far/near/outside the selected layer. Click Next.
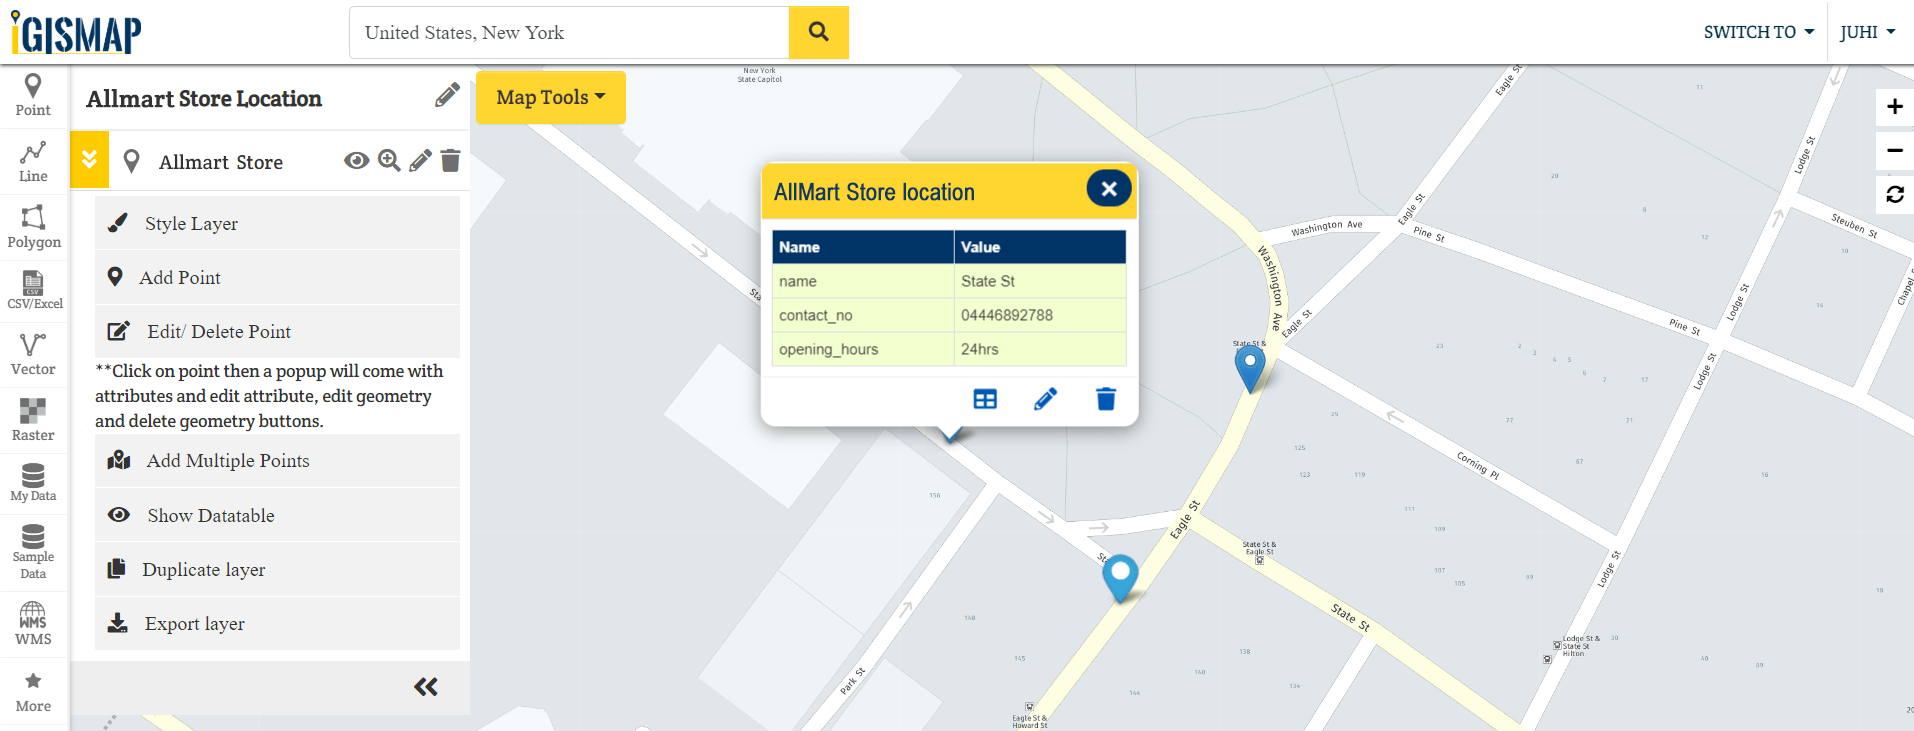
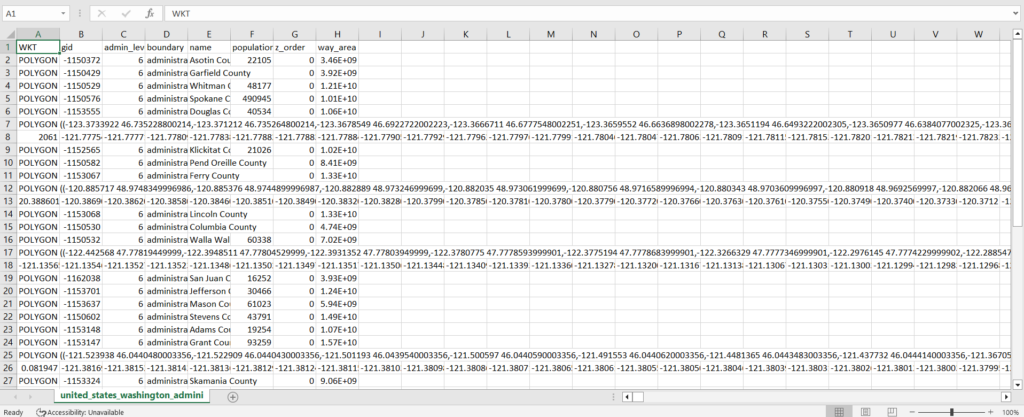
Suppose we only need the details regarding the charging station points in the regions of USA-Massachusetts. In the Datatable of united_states_massachusetts_charging_station_point, you can observe the attribute name as name which signifies the company name of charging station points.
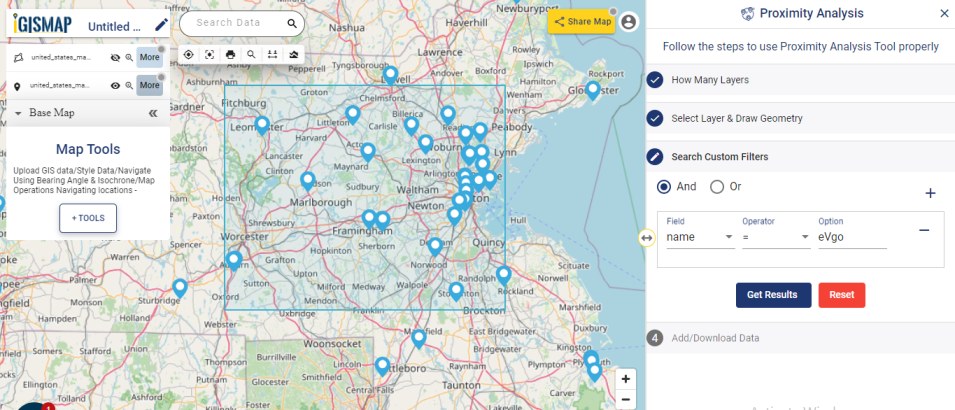
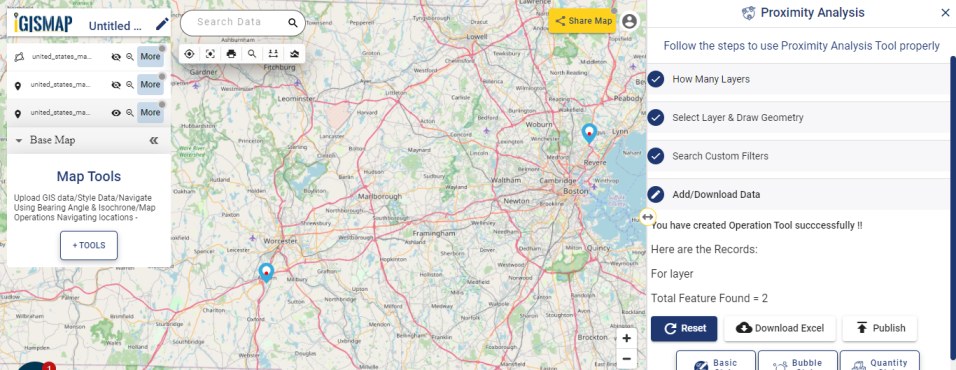
If the user wants to filter the data using the field attributes, then custom filters can be used. For example, if the user wants to filter a specific company name, then one can select AND operator, field: name, Operator: =, Option: eVgo. Click on Get results.
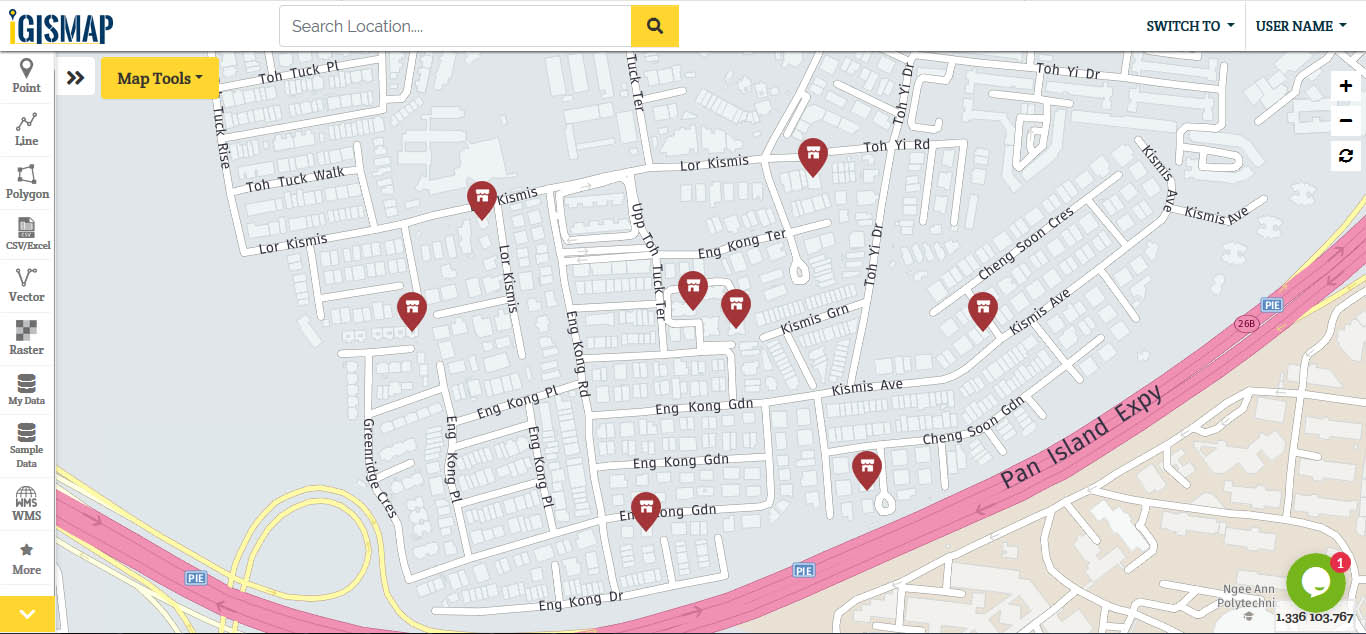
Users can observe the red points, specifying the charging stations points in USA-Massachusetts with company name eVgo.
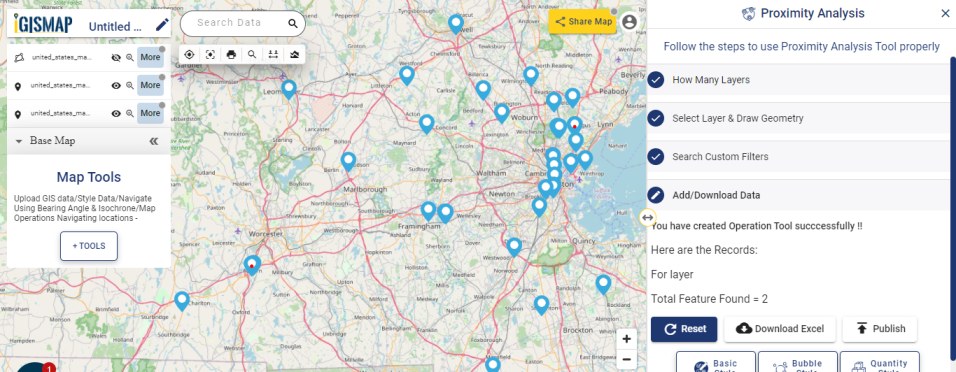
You can also publish the result to the base map by clicking on ![]() . Charging stations points can be embedded on a website or can be shared privately or publicly.
. Charging stations points can be embedded on a website or can be shared privately or publicly.
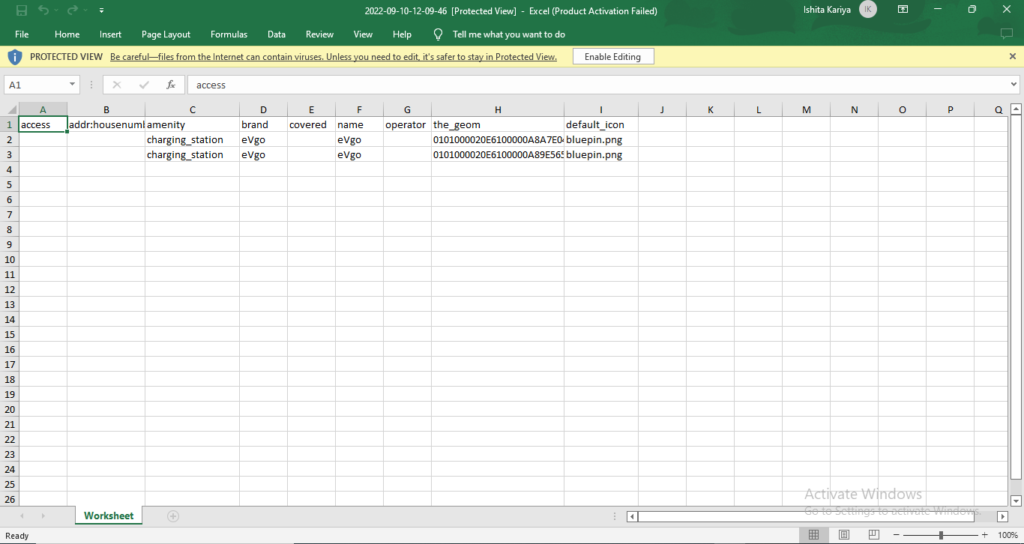
Details of the filtered charging station points can be downloaded in form of excel sheet ![]() . Downloaded excel files consist of details about the layer like icon details, company name, brand name and much more.
. Downloaded excel files consist of details about the layer like icon details, company name, brand name and much more.
Check other articles:
- Create a Map of the Bank Locations in South India
- Map habitat locations of endangered animals & keep track of their living
- Map the locations of slums and embed the map on your website
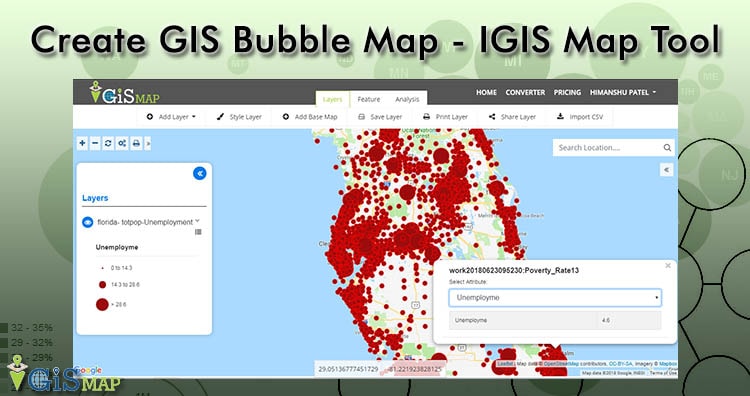
- Create GIS Bubble Map – IGIS Map Tool
- Charts with Map – Create Bar Chart, Histogram, Number Chart, Table
- How to Share Map – Publicly