Create Heat map showing average household income – leaflet js GIS

First of all we must know what heat map is? A Heat Map is a way of representing the density or intensity value of point data by assigning a colour gradient to a raster where the cell colour is based on clustering of points or an intensity value. In this article i.e to Create Heat map showing average household income. If you are not familiar with Leaflet then you may also look over Getting started with Leaflet js and all other leaflet js tutorial article page.

Create Heat map showing average household income – leaflet js GIS

Firstly we will initialise the container and add Open street map. As data is in JSON array format, to extract each value a for loop is applied. Here UsIncome is the data containing name, latitude, longitude and income value of each county of US.

for (var i = 0; i < UsIncome.length; i++) {
var a = UsIncome[i];
var name=a[0];
var income=a[3];
}

As average household income has used as intensity value. A function getMax() gets the maximum value of  property from array.

var maximum;
function getMax(arr, prop) {
for (var i=0 ; i<UsIncome.length ; i++) {
if (!maximum || parseInt(UsIncome[i][prop]) > parseInt(maximum[prop]))
maximum = UsIncome[i];
}
return maximum;
}

Now to use heatLayer or create heat map you need to add plugin either by downloading from https://github.com/pa7/heatmap.js/releases or adding script in your document. The map() method creates a new array with the results of calling a function for every array element addressPoints is an array of latitude and longitude.

L.heatLayer(latlngs, options)

Constructs a heatmap layer given an array of points and an object with the following options:

minOpacity – the minimum opacity the heat will start at
maxZoom – zoom level where the points reach maximum intensity (as intensity scales with zoom), equals maxZoom of the map by default
max – maximum point intensity, 1.0 by default
radius – radius of each “point” of the heatmap, 25 by default
blur – amount of blur, 15 by default
gradient – color gradient config, e.g. {0.4: ‘blue’, 0.65: ‘lime’, 1: ‘red’}

addressPoints = UsIncome.map(function (p) { return [p[1], p[2]]; });
var a=L.heatLayer(addressPoints,{max: getMax(UsIncome,’Median Annual Household Income’), minOpacity: 0.05,
maxZoom: 18,
radius: 25,
blur: 15,
gradient: {
0.2: ‘green’,
0.60: ‘yellow’,
1.0: ‘red’},maxZoom:14}).addTo(map);

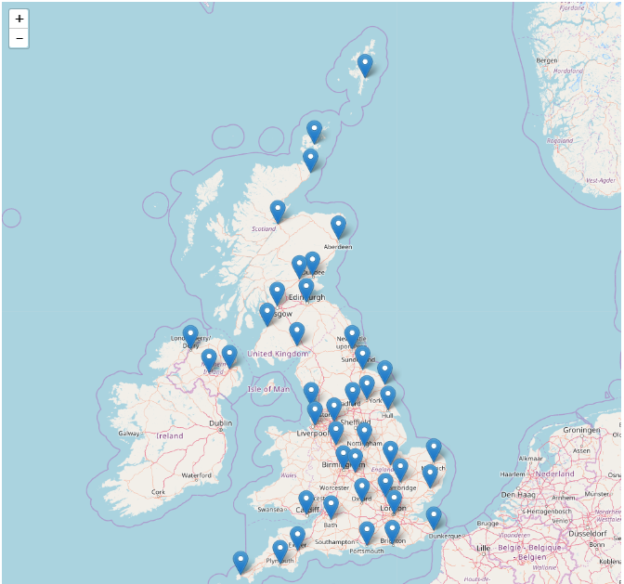
In the last markers are added with opacity 0.01 to make it invisible. BindTooltip has similar use as hover, shows popup when mouse is on marker.

var marker = L.circle(locations, { opacity: 0.01 }).bindTooltip(income+”,”+name , {className: ‘myCSSClass’}).addTo(map);
}

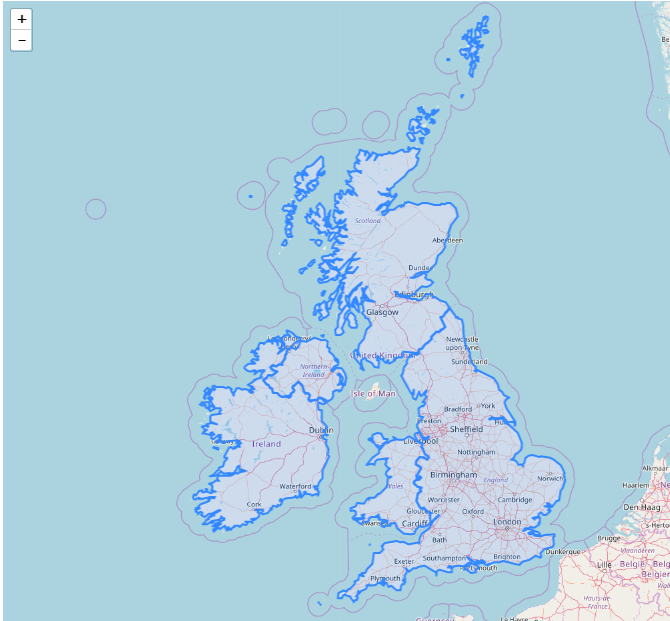
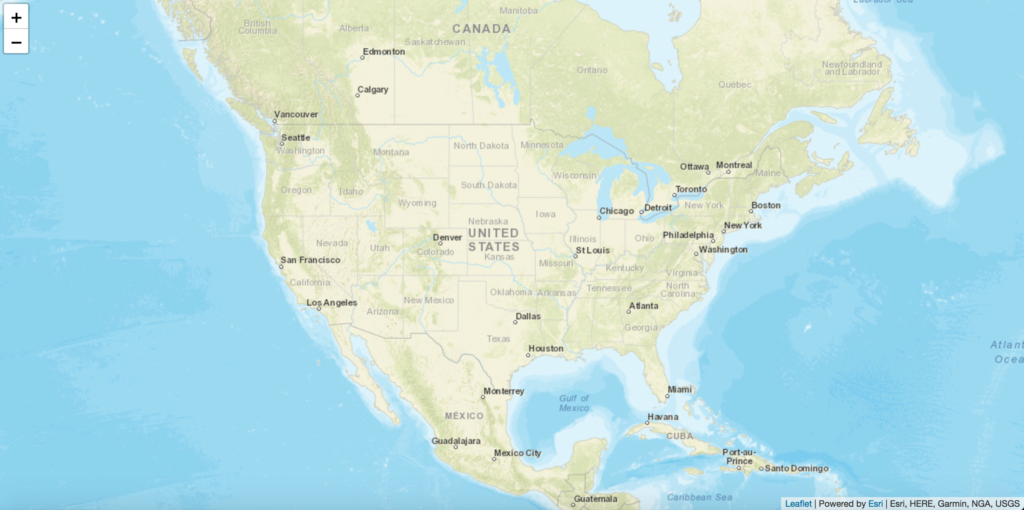
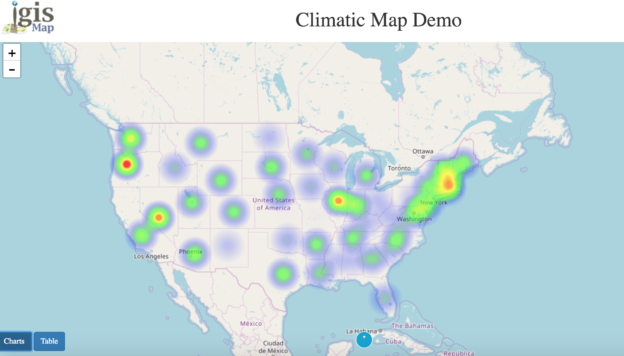
Here’s how the heat map created with leaflet js would look like :

Create Heat map showing average household income

You may also check the working example here:

http://www.igismap.com/portfolio/climate/ : climate US Heat Map

Heat map considered as best when it comes to visualization of information on map. Large amount of data can easily be visualized on map. It has various uses

  • Pollution level in any country
  • Crime rate
  • Population in any area
  • Hottest and coolest city
  • Traffic information
  • Different water level

I hope this may help you in developing and creating a heat map in leaflet js. If you find any problem in creating one such example do let us know by commenting below.

Read Parse Render TopoJSON file – Leaflet js

This article shows how to render topojson file data on OSM map with the help of d3 and Leaflet javascript library in the browser. Leaflet js is an open source small library to create interactive map. You may look over Getting Started with Leaflet js. TopoJSON is one of the GIS data structure which stores geographic data in JSON format. You can easily convert Shapefile to TopoJSON or convert GeoJSON to TopoJSON file. Rather than representing geometries discretely, geometries in TopoJSON files are stitched together from shared line segments called arcs. TopoJSON eliminates redundancy, allowing related geometries to be stored efficiently in the same file. A single TopoJSON file can contain multiple feature collections without duplication. Or, a TopoJSON file can efficiently represent both polygons (for fill) and boundaries (for stroke) as two feature collections that share the same arc mesh. You might be thinking why Topojson. Because TopoJSON files are almost 80% smaller than their GeoJSON equivalents.

Read Parse Render TopoJSON file – Leaflet js

Your html code will start with the DOCTYPE as :

<!DOCTYPE html>
<meta charset=”utf-8″>
<div id=”map” style=”width: 1000px; height: 1000px;”></div>

The <!DOCTYPE> declaration is not an HTML tag; it is an instruction to the web browser about what version of HTML the page is written in. The charset attribute specifies the character encoding for the HTML document. Div tag denotes division or a selection in document. Here it is a container for map with id as map, width and height as 1000px.

To use any library in document you first need to add that library into your document. The script tag contains the scripts which is leaflet and d3 javascrpit library. This library can be downloaded from http://leafletjs.com/download.html or you can add the given links as follows:

<meta name=”viewport” content=”width=device-width, initial-scale=1.0″>
<link rel=”stylesheet” href=”https://unpkg.com/leaflet@1.0.3/dist/leaflet.css” />
<script src=”https://unpkg.com/leaflet@1.0.3/dist/leaflet.js”></script>
<script src=”https://d3js.org/d3.v3.min.js” charset=”utf-8″></script>
<script src=”https://d3js.org/topojson.v1.min.js”></script>

Now to add OSM (Open street map) in division we create a variable named as newMap. Here L.map represents object of map class takes Html element as parameter. Setview is a method that set the center and zoom level according to given parameters.

var newMap = L.map(‘map’).setView([38.9188702,-77.0708398],6);

The tileLayer represents object of tileLayer class that takes URL of data. Here we have given OSM tiles in parameter. In attribution key you need to define the contribution of data source. You are free to copy, distribute, transmit and adapt OSM data, as long as you credit OpenStreetMap and its contributors. For this you need to add http://osm.org/copyright into your document. Method addto() adds the layer to the given map.

L.tileLayer(‘http://{s}.tile.osm.org/{z}/{x}/{y}.png’, {
attribution: ‘&copy; <a href=”http://osm.org/copyright”>OpenStreetMap</a> contributors’
}).addTo(newMap);

Here d3 (data driven document) is a javascript library for manipulating document that visualizes data with HTML, CSS and SVG. Json() is a function that gets Topojson file. Here uk.json is a topojson data. The topojson.feature() function converts the geojson data into topojson data format. L.geoJson creates a GeoJSON layer, accepts an object in GeoJSON format to display on the map.

d3.json(“uk.json”, function(error, uk) {
var places = topojson.feature(uk,uk.objects.places);
var geo=L.geoJSON(places).addTo(newMap);
newMap.fitBounds(geo.getBounds());
});

As data is now added to the map by using addTo() method. Now to get the area covered by topojson file on the map or directly pan to the area where this data has rendered you can use the methods getBounds() and fitBounds(). The getBounds() method returns the geographical bounds visible in the current map view. Here this method is used with geoJSON layer to get its bounds or diagonal corner coordinates. The fitBounds() sets a map view that contains the given geographical bounds with the maximum zoom level possible.

“var places = topojson.feature(uk,uk.objects.places);” command has used which shows the places (geometry primitive as points) on the map.

Read Parse Render TopoJSON file

If var subunits = topojson.feature(uk, uk.objects.subunits); command you use then it will show the subunits (geometry primitive as polygon) on the map.

Read Parse Render TopoJSON file

That is all about read, parse, render Topojson file with Leaflet js. You may also look in to rendering point, polyline and polygon geojson file with leaflet js. If you find any problem in Rendering TopoJSON file then do comment below, I would love to help you in providing solution.

Add different base map layers using leaflet js

Leaflet is  small open source Javascript library to create a customised mapping solution. Leaflet plugin supports many types of map layer. In this article we have map layers as Google map, Open street map, Stamen map, Here map and Bing map layer. What is plugin? Plugin is software that is installed onto a program, enabling it to perform additional features. Similarly here we can download library or access API or can add its link in our document. Lets find how to add different base map layer using leafletjs. If you are new to Leaflet you may look over a simple article explaining details about leaflet along with getting started and describing method to add GeoJSON layer in leaflet as point, polyline or polygon.

Different base map layers using leaflet js:

Google Map Base Layer using LeafletJs:

To add Google map with leaflet in your document you need to add the links:

<link rel=”stylesheet” href=”http://cdn.leafletjs.com/leaflet-0.3.1/leaflet.css” />
<script src=”http://cdn.leafletjs.com/leaflet-0.3.1/leaflet.js”></script>
<script src=”http://maps.google.com/maps/api/js?v=3.2&sensor=false”></script>
<script src=”http://matchingnotes.com/javascripts/leaflet-google.js”></script>

The first two links are for leaflet JavaScript library and last two for Google map. Leaflet plugin that enables the use of Google Map tiles. To download Google API you can visit https://gist.github.com/crofty/2197042 . Then add the <div> HTML tag as a container for map and set the centre and zoom level. After this you are allowed to use Google() function by which you can add map to your document.

      var googleLayer = new L.Google(‘ROADMAP’);
map.addLayer(googleLayer);

Stamen Map Layer using leafletjs:

To show this map on browser you need to use the leaflet and stamen API. The leaflet JavaScript library you can download from http://leafletjs.com/download.html or can add the two links as shown above. To use stamen API add the given link in head tag of your html document.

<script type=”text/javascript” src=”http://maps.stamen.com/js/tile.stamen.js?v1.2.3″></script>

or you can download the zip file from https://github.com/stamen/maps.stamen.com.

To show map on browser a container is required which is given by <div> HTML tag and its styling can be done in CSS.

html  : <div id=”map”></div>

css : #map { position: absolute; top:0; bottom:0; right:0; left:0; }

Now to add division with leaflet and set its latitude longitude of centre, map() and setView() methods have used.

javascript : var map = L.map(‘map’).setView([39, -97.5], 4);

As we have used stamen API in document so now we can use its method StamenTileLayer() to use stamen map.

javascript :

var stamenLayer = new L.StamenTileLayer(“watercolor”);
map.addLayer(stamenLayer);

There are other types of map also available like terrain, toner and watercolor world widely. Some maps like Burning map or mars map etc. can be used with webGL.

stamen design map using leaflet js

Add Here Map Layer using leaflet:

To add Here Map in your document you don’t need to download API or add any link. But you need API id and code which is available https://developer.here.com you can register and get the API id and code to start coding. As we are using this with leaflet, its library has to be link with our document then a container should be present to attach map. After getting API id and code you can run this statement

var layer = L.tileLayer(“http://1.base.maps.cit.api.here.com/maptile/2.1/maptile/newest/normal.day/{z}/{x}/{y}/256/png8?app_id=OO3n6HayrdDH6DhkxRgG&app_code=MZQ6Zn6zc1s5Psz92GMMxw”).addTo(map);

The line shows that you need to add the Map tile then API id and code.

here map using leaflet js

Add Bing Map base Layer :

For adding Bing map we have downloaded Leaflet-Bing-Layer.js file and place it with downloaded leaflet library. To download Leaflet-Bing-Layer.js file you can visit https://github.com/digidem/leaflet-bing-layer here. Now we can add the Leaflet-Bing-Layer by using this <script src=”leaflet-bing-layer.js”></script>

To any Bing map you need to have a key which is available https://www.bingmapsportal.com/Application

Bing map depends on Promises which needs a polyfill for older browsers by adding this script to your html <head>:

<script src=”https://cdn.polyfill.io/v2/polyfill.min.js?features=Promise”></script>

After having that key, take it into a variable and add a map container in your code with centre and zoom level. Now you can use the bing() method present inside the tileLayer class then add key as parameter.

var BING_KEY = ‘AvxUyTMNAOEAsT4pw2SiUhwIBxrNJxwfjHTCNN64QWIjmiRbAr1HZWANY6U2Tg3’
var map = L.map(‘map’).setView([51.505, -0.09], 13)
var bingLayer = L.tileLayer.bing(BING_KEY).addTo(map)

Finally use addTo() to add map to the container.

ESRI ArcGis Map Layer:

To use ESRI ArcGIS map you can download plugin from https://esri.github.io/esri-leaflet/download or can add this link into your document

<script src=https://unpkg.com/esri-leaflet@2.1.1/dist/esri-leaflet.js”</script>. 

After adding and styling container you can use L.esri.basemapLayer(‘Streets’) this command. Here street is parameter, there are some other parameter too that you can use in place of street. The parameters are “Streets”, “Topographic”, “Oceans”, “OceansLabels”, “NationalGeographic”, “Gray”, “GrayLabels”, “DarkGray”, “DarkGrayLabels”, “Imagery”, “ImageryLabels”, “ImageryTransportation”, “ShadedRelief”, “ShadedReliefLabels”, “Terrain”, “TerrainLabels” or “USATopo”. After that addTo() method is used to add map to the container.

L.esri.basemapLayer(‘Streets’).addTo(map);

esri map using leaflet js

There are many mapping service company which provide base layer either for free or for some cost. Leaflet provide a convenient method to add different base map layers. I hope this article helped you in rendering base map layer. If you find any difficulty in implementing the same, do let us know by commenting below.

Convert Shapefile to TopoJSON

ESRI shapefile are the binary vector data storage format for storing the location, shape, and attributes of geographic features. It is stored as a set of related files and contains one feature class. Whereas TopoJSON (topological geospatial data) is an extension of GeoJSON that encodes topology. The necessity of conversion is to reduce the size of data. While using Shapefile, you have to take care of all its mandatory files such as .shp, .shx, .dbf, .prj etc. Whereas GeoJSON and TopoJSON formats are single file formats.

There are many online and desktop application based solutions to do this conversion. But the method everyone looking forward is an easy way to convert a file to a preferred format. In this article we will see how easy is IGISMAP for the conversion process. Following are the methods to convert Shapefile to TopoJSON using IGISMAP Converter tool.

Use Online Converter Tool – Shapefile to TopoJSON MapOG

IGISMAP (Now MAPOG) to Convert Shapefile to TopoJSON

Go to MAPOG Converter Tool, after logging in with your registered email and password. If you are a new user, click the Sign Up button in the Login popup and register to IGISMAP by filling the details.

There are three main steps for using GIS Converter:

  • Upload the data
  • Choose the format to which it should be converted
  • Download the converted file.

Step one is to upload your Shapefile which you want to convert. You can upload the file from your system or select from the Recent Files.

Upload Shapefile

Here we using the Shapefile of India state level boundaries with demographic information. You can find this data in IGISMAP GIS Data Collection –

Step two is to select choose the output format of the converted file, in this case its TopoJSON. You can also set the Coordinate Reference System of your preference. As a default CRS will set to WGS 84 (World) [EPSG:4326]. Click on the Convert File button.

Select TopoJSON as Output Format

Your Shapefile will then get converted to TopoJSON file after a few seconds and will be published in the map canvas. You can download the TopoJSON file of New York state boundary by clicking the Download Converted File button.

Download and Publish TopoJSON File

You can also choose to style the layer or continue with further conversion process by clicking the Convert Another File button.

Converted Files section from the dashboard contains the list of the details of all the conversion done in your account, providing both input and output data available for download their corresponding formats.

IGIS Map Converter Tool provides many benefits other then just conversion of data. This tool provides us to generate this published map in PDF or as image format.

Info GIS Map supports most of the commonly used GIS or AutoCAD files like Shapefile SHP, KML, KMZ, CSV, TopoJSON, GeoJSON, GML, DXF, GeoTIFF, NetCDF, GRIB, HDF5, OSM, PBF, and many more raster and vector files, along with that it support more than 4000 Coordinate Reference System.

Here are other two ways to convert shapefile to topojson

Use Online Converter Tool – Shapefile to TopoJSON MapOG

Offline Method : Convert Shapefile to topojson through GDAL and then through geo2topo tool npm:

To convert shape file to topojson format offline you need to download GDAL and Node.js.  First step is to convert shapefile to geojson data format, which is done by using ogr2ogr command available in GDAL package. After successful installation check ogr2ogr availability by typing ogr2ogr in command prompt or by typing dir that will show all available directories.

Now you can convert shapefile to geojson data format by using given command

  • Ogr2ogr –f Geojson file_name.json input.shp

Here –f option is used to shows the file format, which shows output file format is geojson. GDAL takes name of output file prior to input file.

Convert geojson to topojson:

Now to convert geojson data to topojson data format you have to download node.js which is available https://nodejs.org/en/ here. After successful installation you need to check npm availability using command

  • npm –check.

If not available use

  • npm install -g npm-check

After this you need to install topojson-server for conversion of data that can be done by using

  • npm install topojson-server command

Now all setup is ready

Use geo2topo command to convert geojson data to topojson data

  • geo2topo –o geo.json topo.json

Here –o option is used to give the output. If command doesn’t run and gives error as no such file or directory. Then specify full path for file for both input and output. The older versions were having topojson as a command to convert geojson data format to topojson data format. Topojson is named as geo2topo command in new version.

Convert Shapefile to TopoJSON – Online Method

Mapshaper is an online tool that converts shape file to topojson data format directly. You only need to drag the shape file to http://mapshaper.org/ site. Then use export option to convert this data into topojson format. In Mapshaper there are many option are available to simplify the geometry, which you can explore.

convert shapefile to topojson

You may also look over converting kml to shapefile and shapefile to kml conversion.

I hope this article helped you in converting the file from Shapefile to TopoJSON. If you find any problem in performing operation do let me know by commenting below.

Convert GeoJSON to TopoJSON – GIS

Convert GeoJSON to TopoJSON. GeoJSON is an open standard format designed for representing simple geographical features, along with their non-spatial attributes, based on JavaScript Object Notation. The need of conversion is to reduce the size of data, so that rendering of data on browser can be made faster. TopoJSON (topological geospatial data) is an extension of GeoJSON that encodes topology. Here we have explored two methods for conversion of GeoJSON to TopoJSON (i.e. online and offline).

Use Online Converter Tool – Geojson to TopoJSON MapOG

Offline Method to Convert GeoJSON to TopoJSON:

You can directly convert GeoJSON to TopoJSON with the help of topojoson-server node package manager. For using this package you need to first install node js in your system (can be installed in windows, linux based operating system or Mac).

If you have Shapefile or KML file, then you can refere this articles i.e convert kml to shapefile, convert shapefile to GeoJSON and converting shapefile to kml, so that you can generate new GeoJSON file out of other GIS format files.

Convert GeoJSON to TopoJSON – NPM method

NPM (Node Package Manager) is a command-line utility that aids in package installation, version management, and dependency management or can be considered npm as a tool that helps to install another tools like topojson-server.

For this method you need to download node.js which is available https://nodejs.org/en/ here. After successful installation you need to check npm availability using command

  • npm –check.

If not available use

  • npm install -g npm-check

convert geojson to topojson

After this you need to install topojson-server for conversion of data that can be done by using

  • npm install -g topojson-server

Now all setup is ready

Use geo2topo command to convert geojson data to topojson data

  • geo2topo –o geo.json topo.json

Where geo.json is the geojson file i.e input file and topo.json is the file we are creating with the name topo as topo.json file i.e output file.

Here –o is output. If command doesn’t run and gives error as no such file or directory. Then specify full path for file for both input and output. It is recommended that you run this command from the same directory where geo.json file is stored.

If you don’t have any input files ready or any geojson or shapefile then you can download free GIS data fromat for testing this article.

Online method: Convert GeoJson to TopoJson

This is the simple and fast method. For the conversion you just need to drag the geojson file in http://mapshaper.org/ site. Then use export option to convert this data into topojson format. Map shaper website render and convert the file in the browser itself, but it you might face problem while converting a big geojson file. 

I hope that this methods listed above to convert geojson to topojson would have helped you in achieving result. If you find any problem or know any other method to perform this operation and want to share with us, then do let us know by commenting below, in the box provided.

Geographic Information System (GIS) for Telecom Sector Industry

Earlier the basic necessities were limited to food, clothes and Shelter. As we all know , that, everything changes with the time, so has had happened with the basic necessities of an individual. Basic necessities of an Individual has also changed over a period of time. Telecom is an add on to the basic necessities of an Individual. Unlike, the earlier basic necessities, telecom has so much to do with technology. Of those technologies, GIS is the one playing major role for telecom Industry. Lets see, how GIS for Telecom is useful, reasons to use GIS for telecom.

Use IGIS Map Tool in Telecommunication

What is Telecom Industry ?

Telecom Industry is one of the Vast and the Vital industry, serving its customers with varied number of players. Telecom Industry has enormous number of companies making it an Industry. It is a service providing industry, Consisting of telecom companies like IDEA, Airtel, Vodafone and many more are there.

GIS – Telecom Industry

Telecom industry makes us communicate over networks. It helps us to connect with our friends, family, relatives. Now here the question popping in our mind is how do they provide these services in every corner of the country, what might be the problems faced by them , how do they solve these problems?

Problems Faced by Telecom Industry :

Every Success is the result of Hardships and hardships can be done only by facing challenges. So, telecom industry too faces so many problems for satisfying its customers. The major Problems faced by telecom Industry are :

  • Capacity planning
  • Personnel management
  • market Segmentation
  • Real-Time knowledge of  Network structure.
  • Demand Forecasting

Now, lets discuss what these problems stand for.

  • Capacity Planning :  Capacity planning is related to the planning of providing the network to the each and every area of the country. Capacity planning is required to know the areas or locations where we need to focus for providing the services.
  • Personnel Management : The success of the company lies in its management. Management is responsible for managing the resources of the company. While, the management of personnel is a very crucial task. One needs to be very clear while allocating resources to the location according to the requirement.
  • Market Segmentation: Market Segmentation is the need of every business. No business can succeed without proper market segmentation. Segmentation of the market refers to the division of customers or consumers in different groups. One needs to be very careful while segmenting the market. As segmentation is one of the vital and major attribute of the Business.
  • Real-Time knowledge of network structure : Every Telecom company has to have the proper know how of network structure for any particular region at the given point or period of time .
  • Demand Forecasting : Demand forecasting again depends on the various attributes one of them is market segmentation and the previous data also helps in forecasting the demand.

These are all the problems faced by telecom industry, but the question is how do they deal with it. As it is not possible to evaluate everything regarding the area and the region on the basis of previous data or the printed maps. So now lets see what is the solution of these problems.

Check out Video – How to use IGIS Map in Telecom Sector Industry

Geographic Information System (GIS) for Telecom Sector Industry

The solution to all the above mentioned problems is GIS.

How GIS is the solution ?

GIS stands for geographic information system. It helps Telecom companies in solving their problems in the  following ways :

GIS  for Capacity management : As we know that capacity management is about the planning of providing the services to whom they have not reached yet. So GIS can help in locating the regions and areas on their Map, where they have not reached yet, or where they need to improve.

GIS for Personnel Management : GIS is very useful for allocating resources according to the requirements. GIS helps telecom company in identifying the areas where there is the requirement of the personnel. It also helps in identifying the number of personnel required, for which post they are required. All these can be done on the Maps with the help of GIS.

GIS for Market Segmentation : Market Segmentation can be done more efficiently on the maps with the help of GIS. One can easily divide the customers according to their groups, and then it becomes easy for them to allocate the towers for their network , where do they need to implant more towers, according to the complaints and grievances of the customer from different region.

GIS for Real Time Knowledge of Network Structure : Telecom industries can easily access their network points and signals, where are the signals reachable and where not, whether the signal is weak or good. It helps them in analysing the network status and structure as well for a particular region at particular point of time.

GIS for Demand Forecasting : Telecom Companies can use GIS for forecasting the demand of their products along with the help of the previous data and the market segmentation. With market segmentation company can  know what is their target Market. It makes easy on the company’s perspective if they know well about their target Market.

These are the problems faced by telecom industry, and the ways in which GIS helps in solving these problems.

Do pen Down your experience with GIS in telecom, in the comment section provided below.

Geographic Information System (GIS) for Hospital Industry – How, When and Uses

GIS (Geographic Information System) for Hospital Industry. ‘Health is wealth’, this quote is the truth. One can have everything with wealth but not health. One has to do so much to keep the health with them. But at some point of time everyone need an additional support to keep the health on track. That support we get from the Medical industry. Medical science has reached so up that now they have solution of every disease. There are many factors for a disease to occur. Medical Industry is one of the rapidly growing industry, for it is the must for every individual.

Though medical industry is a rapidly growing industry, but it also face some major problems. As we know that to reach to the top we face many hurdles in between. Although the medical industry is doing good but there is something, which helps or can help the medical industry to be better everyday. GIS helps Medical Industry to stay ahead with efficiency.

How GIS helps Medical or Hospital Industry ?

GIS is helping or can help the medical industry in enormous ways. Below mentioned are the major benefits that Medical Industry receive from GIS. GIS helps medical industry in following ways :

Now, lets understand these benefits and the GIS implementation for it .

GIS IN HOSPITAL INDUSTRY

Identifying Health Trends

Health trends varies from one region to another. A coastal region may not have some of the disease which are found in desert region. So this way the health trends varies from one region to another on the basis of various factors like – air, water, sunlight, food crops, food habits and many more. So, concerning all these factors one can identify the health trends, but to identify the regions one will surely need the GIS maps. With the help of GIS maps one can easily mark up the regions on the basis of these factors and can accumulate the health trends of that particular region.

Tracking the disease spread

While GIS helps in identifying the health trends, it is also capable of giving information regarding the spread of a disease. The spread of a disease refers to the communicable disease. How much communicable a disease is and where it is likely to spread next. So with the help of GIS this can be tracked. Tracking of a disease spread is important as this allows the doctors to take the preventive actions in prior, which can limit the spread of the disease.

Improved Services

Those who can satisfy their customers/consumers/clients with their services, are the one to achieve lots and lots of success. As far as Medical or hospital industry is concerned the better the service the happier the clients. With the help of GIS maps one can easily find out the disease spread regions, health trends, climate trends that prepares them in advance. The knowledge of health trends and disease spread in prior can limit the effect of the disease. Which eventually come up with the Improved services.

These are the benefits of using GIS in medical or hospital industry. If you know any more do let us know by commenting in the comment box provided below

GIS for Agriculture – When and Why

Agriculture plays a very vital role in everyone’s life. For few agriculture is not the only way of having food in their plate, rather a source of income. We get food from agriculture, one can not imagine his life without agriculture. Agriculture brings food in our plate, hence the agriculture needs to be proper care taken of. Care of Agriculture depicts the farming according to the nature of the soil, land and water.

Say for an example, some staples are grown in the plateau regions, but can not be grown in plain area. There are various kind of agriculture activities, but the main part of agriculture is to decide where to do farming, and what to grow. Deciding on this is really a very crucial task. So, we have something which can assist you with this decision taking. That is GIS. GIS is helping people in every field, then why not agriculture. Yes, You read it right, GIS can assist in agriculture also. Lets see how GIS is helpful in Agriculture?

Benefits of GIS Maps  in agriculture

GIS is beneficial to every one in every segment. Hence, it is beneficial for agriculture also. It provides agriculture with below mentioned benefits :

Lets see how GIS Maps provides with above mentioned benefits in agriculture.

GIS FOR AGRICULTURE

Climate Conditions

Climate is a variable that varies from region to region and sometimes within a region. As we know that Climate plays a vital role in agriculture sector, hence it is a necessity to give a proper and required focus on climate while planning for any farming or agricultural activity. Hence one can not easily find out the climate of a particular reason, as climate is made up of few factors like water,air sunlight. So, in such cases GIS maps can help in forecasting the climate of any region for farming anything. It would also help to let us know whether that crop can be grown in that particular region or not, with the help of GIS maps.

Know land type

No agriculture is possible without land, and no successful agriculture is possible without knowing the land type. Yes, As we know that land is an essential resource for agriculture but it is of no use if one does not know the land type of a region, as one can not grow a crop in deserted regions, which is mean to be grown in plateau regions. So, to identify a land type GIS maps are a must. GIS maps will help a person in finding out the Land type of a region for better results, One can easily mark those regions on GIS maps.

Water Supply

For growing the crops it is necessary to have water. We can not imagine our life without water, neither Can agriculture. So, to find out the water supply in a region we need to know the source of water of that region. That source can easily be find out With the help of GIS maps. GIS maps are the main source of information, of the factors of agriculture. You can easily identify the water bodies located near to a region and can accumulate the supply of water in that region.

Drought

Drought occurs because of the lack of water or rain. When there is no rain there will be no crops and food. Hence it is very important to know the drought prone  regions, as to secure yourself from investing in such place where you might face some loss. So, GIS maps can help you find out those drought prone regions, on the basis of the previous data and GIS maps. With GIS maps you can get the details of the region which are drought prone.

These are the benefits one can receive from GIS maps for Agriculture. Use GIS maps for Telecom, BCP, Logistics, Medical industry and last  but not the east Agriculture. If you know any more benefits of GIS For agriculture, do let us know by commenting below in the comment box of GIS For agriculture article.

GIS for Travels And Tourism

We all love to travel, some travel for peace, some travel for business, some travel for a break from regular schedule and then some travel for experience. As they say ‘Don’t tell me how much educated you are, tell me how much you have traveled’. Traveling gives enormous experience, it fills up  your soul, gives you a change, provides you with the peace of mind. Do you think to travel is an easy task ? Of course, travelling is very tempting, but to plan a trip is surely not a tempting thing, for it takes a lot of efforts and proper knowledge of the routes and the place. So, for keep the planning thing easy we have GIS maps. GIS maps offers some major benefits to Travels and tourism sector.

Benefits of GIS for Travels and Tourism

  1. Visualization of tourist Spot
  2. tourist location
  3. Route Planning
  4. Accommodation
  5. Cultural events and special attractions.

GIS for Travels And Tourism

Lets see how these benefits are offered by GIS to travels and tourism sector .

Visualization Of Tourist Spot

Travels and Tourism is one of the wide and important industry, which is spread over all corner of the world. When you are travelling to a new place it is the responsibility of the travels and tourism business holder, to welcome their guests by making them visit every tourist spot. But for that we need to know the tourist spot of that place. So, in such cases GIS maps are very Useful. GIS maps helps in marking and finding out the tourist place, and through GIS ,customers can visualize those spots they are planning to visit.

Tourist Location

GIS helps in finding the tourist location to the travels and tourism business holders and their customers. With the help of GIS they can easily visualize the location while sitting at home and can also plan a tour to it, with the proper planning of your tour.

Route Planning

So, if you are planning a tour to a new state, then how would you be travelling there? how are you going to reach there ? So, for that we need not only navigation but a proper and efficient route. In such cases GIS maps are very useful, as they can help you in making the proper route for your tour. With the help of GIS you can plan your route by making the best efficient routes and can choose one of them that is more feasible to you.

Accommodation

Travelling to a new place, that is so exciting, but you get stuck when it comes to the food and stay, that means about your accommodation. GIS maps can help you out with this major problem. As we know, now we can look for the hotels and restaurants of any area very easily over Maps. Hence, You do not need to worry about the accommodation facility. All you need to do is just use GIS maps and get the best accommodation facility to stay according to your preferences, which is nearby to the tourist spots you are going to visit.

Cultural Events and Special attraction

We travel to explore new places and the culture and special attraction of that place. So, for finalizing your tour you can use GIS maps. GIS maps is mostly used by the travelers and tourist to finalize their place to visit on the basis of the special attraction of that place and its culture. With GIS one can easily look for the cultural events and special attraction, moreover the business holders can also update such locations in the map.

These are the Some major benefits which GIS provides to Tour and travels industry. If you know any other such benefits of the GIS for tours and travels industry, do let us know by commenting below in the comment box of GIS for travels and Tourism industry.

5 Helpful GIS Mobile Applications – Free GIS App

GIS Stands for Geographic Information System. GIS is helping everyone in every field.  Be it Telecom industry, Medical industry, Agriculture Sector, and there are many more industries which are using GIS on a regular basis.

So, to provide an ease of GIS, so many mobile applications are now available. So, here we are to introduce you with the best GIS applications for Android And IOS. In case if you have not visited our Previous article use of GIS – 16 different industries covered. Here is the link.

5 Helpful GIS Mobile Applications

5 Helpful GIS Mobile Applications – Free GIS App

  1. MapIt
  2. SW Maps 
  3. Map With Us 
  4. MapPt 
  5. Locus GIS

These are the best 5 GIS applications for android and IOS. Lets Check what are the specialty of each of these GIS applications for Android and IOS.

1. MapIt – GIS Mobile application

MapIt is the another GIS application for android users. Mapit is widely used and one of the popular mobile application which is used for several purpose like environmental surveys,woodland surveys, road constructions, land surveying ,tree surveys, site surveys and soil samples gathering.

These are the sectors using MapIt GIS application, for Performing following functions –

  • Direct export to Dropbox or FTP location.
  • It has possibility to record multiple points ,lines and polygons on one layer.
  • Import/export attributes from file and much more to discover.
  • Address and location search .
  • You can also create new polygon or line features measurement details like area or length are also available.
  • possibility to group data into several layers.
  • it also allows you to local export or remote export.
  • It has Clusters for point map markers, efficient way of having large number of points on the map without performance issues.
  • support for WMS and ArcGIS .
  • it has possibility to create and maintain sets of attributes .
  • It provides base Map : Google Map, Bing Maps, Open street Maps, Mapbox.

Download MapIt from Here 

2. SW Maps – GIS Mobile application

SW maps is a free GIS application which helps you in collecting, sharing and representing Geographic information. No matter whether you are conducting full scale GNSS survey with high precision instruments,need to collect large amount of  location based data using nothng but your phone,or just need to view a few shapefiles with labels over a background map on the go, SW Maps has it all covered.

SW Maps is one of the useful GIS application having following features :

  • Conduct high accuracy GPS surveys using external RTK capable receivers over blue tooth.
  • Draw features on the map by adding markers and measure distance and area.
  • online base maps are also available : Google Maps or open street view.
  • Support for mbtiles and KML over lays
  • it provides shape files layers, with categorized styling.
  • It also allows you to connect with external GPS.
  • draw point,line and polygons.
  • You can also label features based on attribute values.
  • you can also share and export the data in KMZ files

These are all about the SW Maps GIS application. you can download the SW Maps from here 

3. Map with Us – GIS Mobile application

Map With us is one of the GIS application which is freely available on the google play store.Which provides following benefits to you :

  • Geolocate and upload photos,videos and audio
  • you can collect and edit the data in the field using custom data collection templates
  • Useful for business professionals
  • You will be able to easily export the collected data to KML files or shape files.
  • You can also import your KML or shape files to MapWithUs system.

These are the functions you can perform with Map with us GIS application. You can also download Map with us from here .

You can also check its iOS application here.

4. MapPt – GIS Mobile application

MapPt is one of the useful application which is available in 130 countries and in industries spanning from education and agriculture. This app is widely used by the people from below sectors :

  • Field mapping
  • Land surveying
  • Vegetation  Management
  • Forestry Planning
  • Environmental management
  • incident reporting
  • Farm Mapping
  • Mine management
  • Government Planning

People are using Map with us because of the below functions that they can perform with it :

  • It allows you to create,edit,store and share all types of geospatial information.
  • You can geotagged photos and gridding.
  • Create points,polygons.polylines.
  • Import and export popular GIS formats such as shapefiles, JP2,  and kml/kmz.
  • You can drop down forms for faster data collection.
  • Geofencing capabilities make sure you never breach a  boundary.
  • you can also share the data between popular cloud storage like Google drive.

Download MapPt Application from here

5.Locus GIS – Mobile Application

Locus GIS is a newly built app for the GIS professionals and enthusiasts. It is one of the GIS application for android and IOS users. This GIS application allows you to do following functions :

  • you can create your projects
  • you can also export the collected data to SHP file is fully compatible with ArcGIS Software
  • Select premium online and offline maps
  • It also provides advanced map tools like – map overlays,offsets,WMS sources support.
  • It also forecast the worldwide weather 24*7.

“Locus GIS application in beta version, which is valid till the end of 2017.”

  • Download Locus GIS from here 

These are all the 5 Helpful GIS Mobile Applications – Free GIS Apps available free of cost. If you know about any other such app do let us know by commenting below in the comment section of the 5 GIS applications for mobile which are helpful.

Exit mobile version
%%footer%%