


GeoPackage is an open, standards-based, platform-independent, portable, self-describing, compact format for transferring geospatial information. Whereas shapefile is collection of geometry with attribute detail. Here in this article, we will check how to convert Shapefile to GeoPackage or GPKG GIS format.
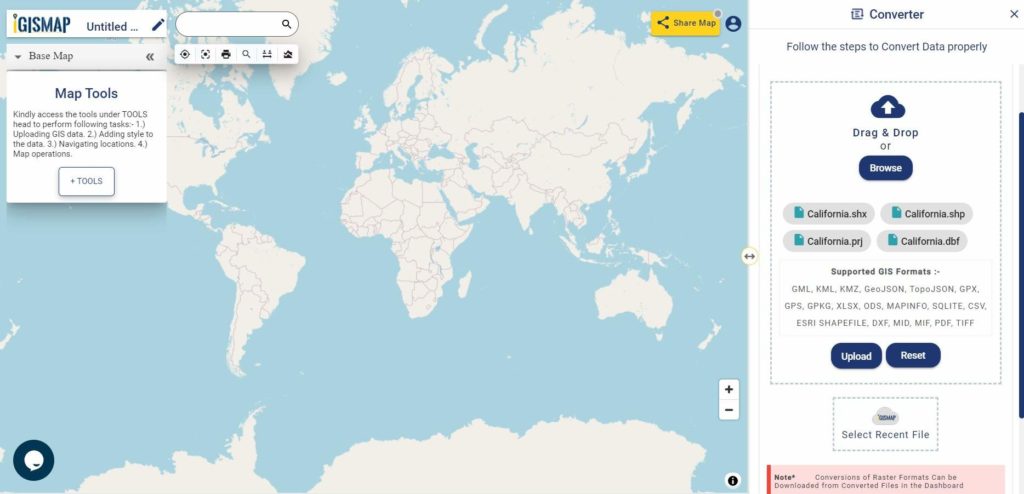
Online Tool To Convert Shapefile to GeoPackage file
The GeoPackage Encoding Standard describes a set of conventions for storing the following within an SQLite database:
1. Vector features
2. Tile matrix sets of imagery and raster maps at various scales
3. Attributes (non-spatial data)
4. Extension

You can open the gpkg (GeoPackage) file in QGIS software and see some of the general properties of gpkg (GeoPackage) file-
1. Storage type of this layer
–> GPKG
2. Description of this provider
–> OGR data provider (compiled against GDAL/OGR library version 2.2.2, running against GDAL/OGR library version 2.2.2)
3. Source for this layer
–> /var/www/html/PHP_pgrouting/public/outputllll.gpkg
4. Geometry type of the features in this layer
–> Line
5. The number of features in this layer
–> 19148
6. Capabilities of this layer
–> Add Features, Delete Features, Change Attribute Values, Add Attributes, Delete Attributes, Fast Access to Features at ID, Change Geometries, Presimplify Geometries, Presimplify Geometries with Validity Check
7. Extents
–> In layer spatial reference system units
xMin,yMin 68.4982,7.92528 : xMax,yMax 97.3348,35.5013
8. Layer Spatial Reference System
–> +proj=longlat +datum=WGS84 +no_defs
Convert Shapefile to GeoPackage – GPKG using OGR2OGR-
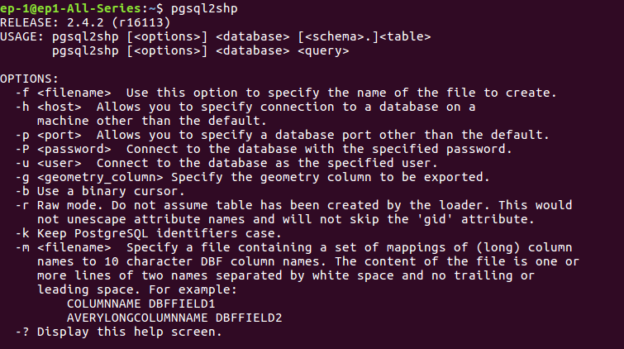
The command has some options, which can be seen by typing ogr2ogr in terminal. If this gives you error that means you don’t have ogr2ogr utility in your system. To install that you can follow the statements given below-
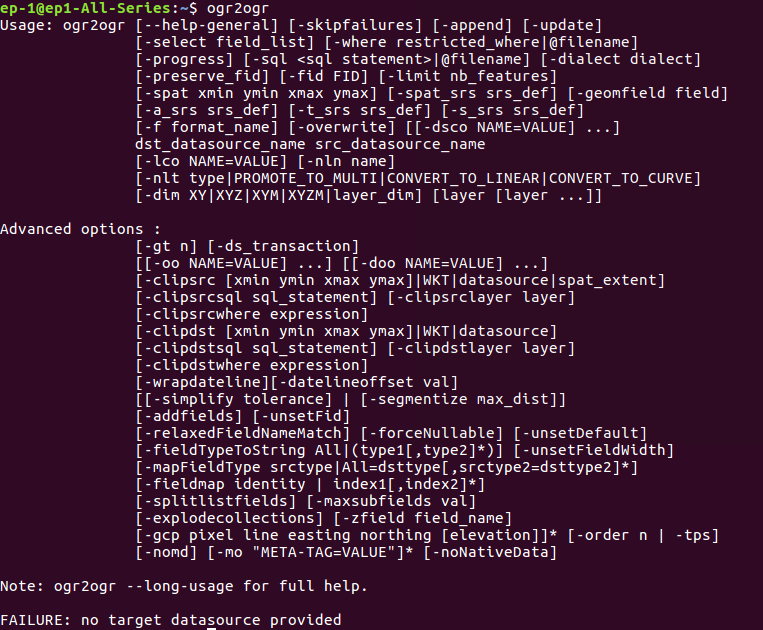
If Ogr2ogr utility is available, you will see the following result.
The command is given as-
–> ogr2ogr -f GPKG outp_gpkg.gpkg India_raods.shp
The command contains Utility name, option for file format, name for format, output file with .gpkg extension and input shape file.
To install ogr2ogr utility-


To check if ogr2ogr utility is working properly or not-

Online Tool To Convert Shapefile to GeoPackage file
PHP Code to Convert Shapefile to GeoPackage – GPKG-
Using shell_exec() method, you can run the command in PHP. This return output as string.
public function shptogpkg($shpfilepath,$output) {
$query=”ogr2ogr -f GPKG $output.gpkg $shpfilepath.shp”;
shell_exec($query);
}
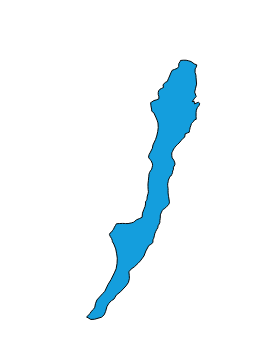
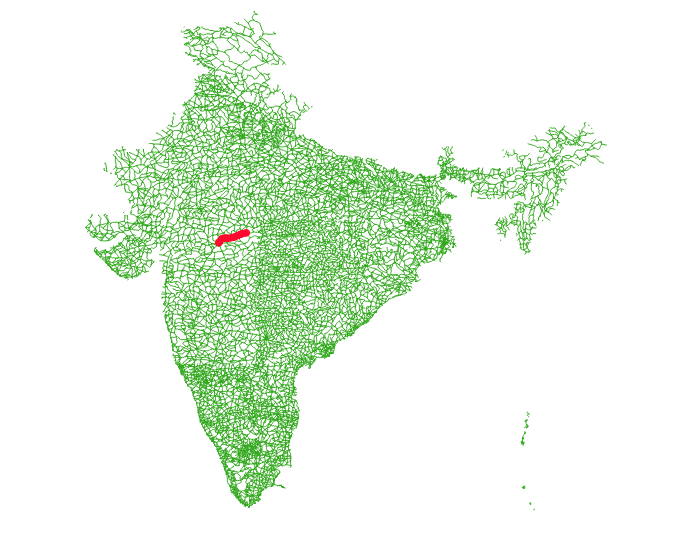
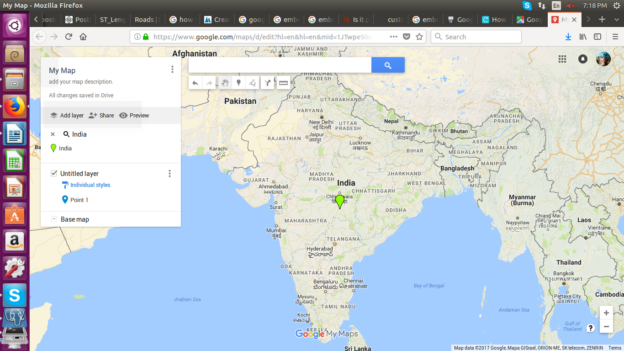
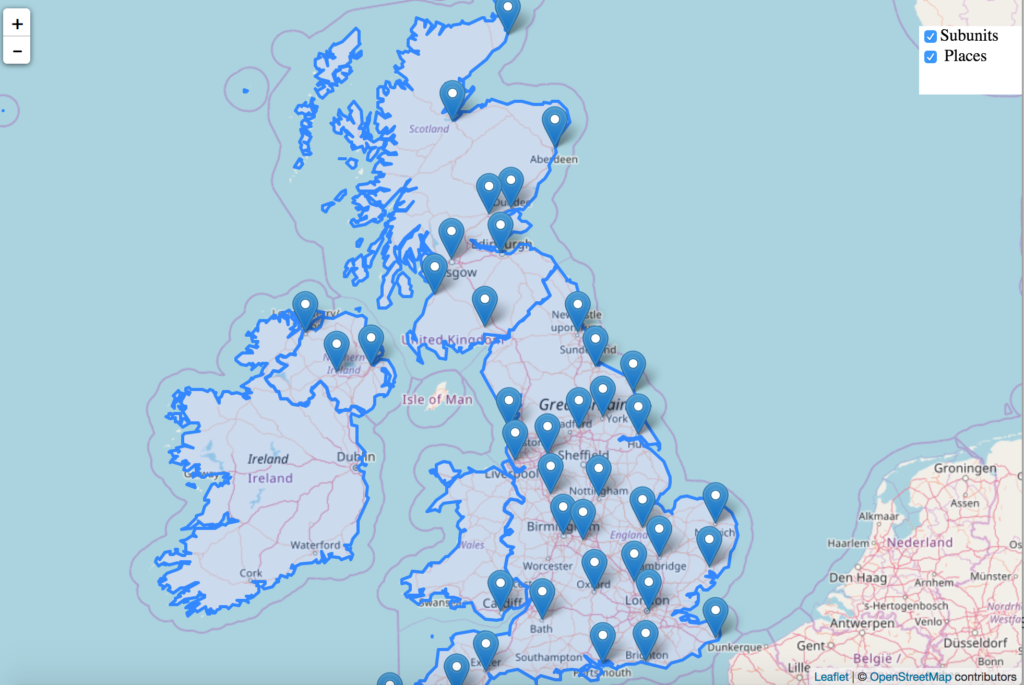
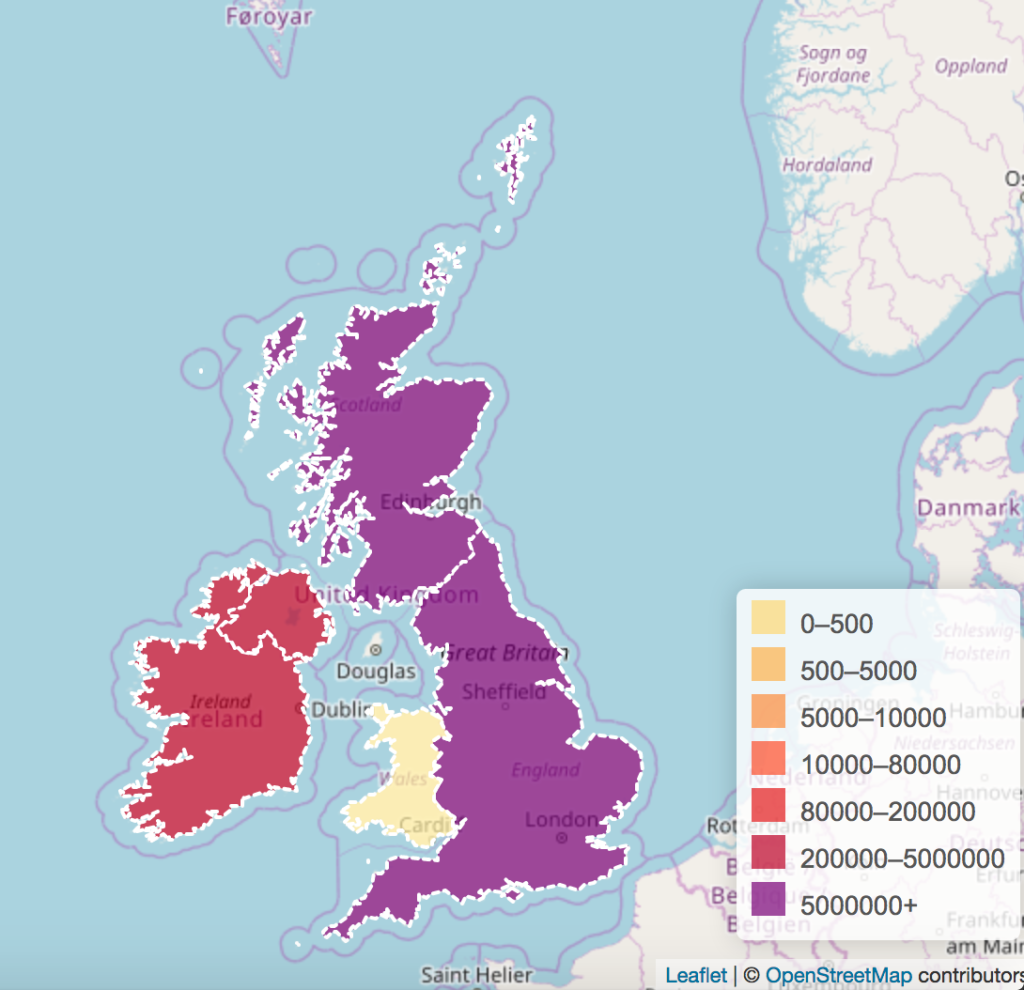
The output file can be open in QGIS software. I have converted Road File of one such country. Here is the output look in QGIS tool after Converting Shapefile to GeoPackage.


Change Coordinate system of Output-
Many of times, we need the output file in other coordinate system. For this we can use options of ogr2ogr utility. It has
-a_srs srs_def:
Assign an output SRS
-t_srs srs_def:
Reproject/transform to this SRS on output
-s_srs srs_def:
Override source SRS
So using these option we can get the data in required coordinate system. So for this you can write the query as-
—> ogr2ogr -f GPKG -s_srs EPSG:4326 -t_srs EPSG:32643 Output_file_name.gpkg Input_file_name.shp
Here define old EPSG (European Petroleum Survey Group) in -s_srs option and new in -t_srs option.
You may also Check Shapefile to GeoJSON, Shapefile to KML, Shapefile to TopoJSON, etc conversion.
Let me know if you find any problem in converting Shapefile to GeoPackage file, by commenting below in the box provided.