Geographic Information System is a system intends to capture, Store, manage, manipulate, analyze the data.
GIS Data by MAPOG is a versatile platform designed to provide users with easy access to a wide range of GIS Data formats, such as Shapefile, KML, GeoJSON, and many more. The platform offers a user-friendly interface for downloading both administrative and geographic data sets and other datasets like pipeline data, allowing users to effortlessly locate and utilize data tailored to their specific needs.
Understanding the Process
Downloading pipeline data using GIS Data by MAPOG is a simple and efficient process, requiring users to select their preferred data format, such as Shapefile or KML, suitable for various GIS applications. The platform encompasses data from over 200+ countries, with access to more than 900+ layers. It streamlines the downloading procedure by offering a step-by-step guide, enabling users to quickly obtain the data required for analysis, planning, or mapping tasks.
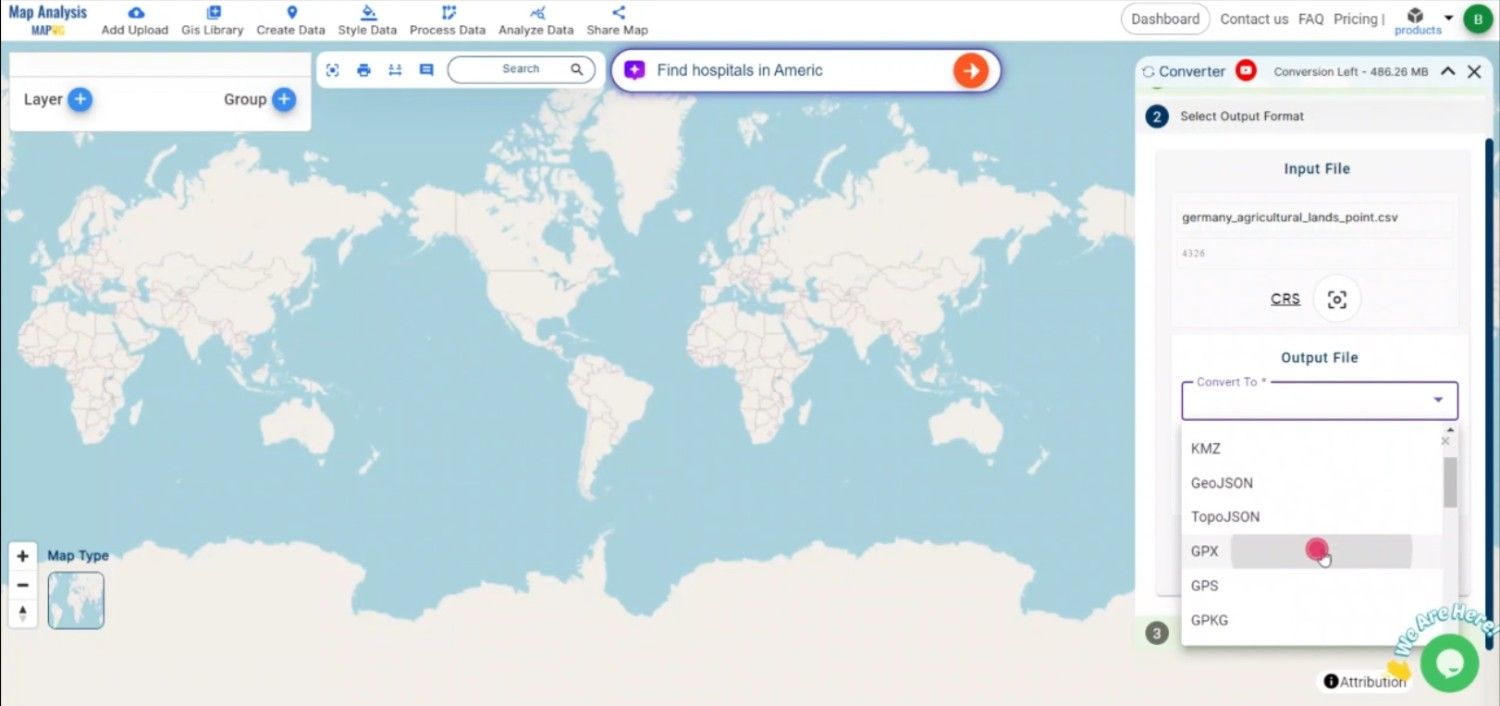
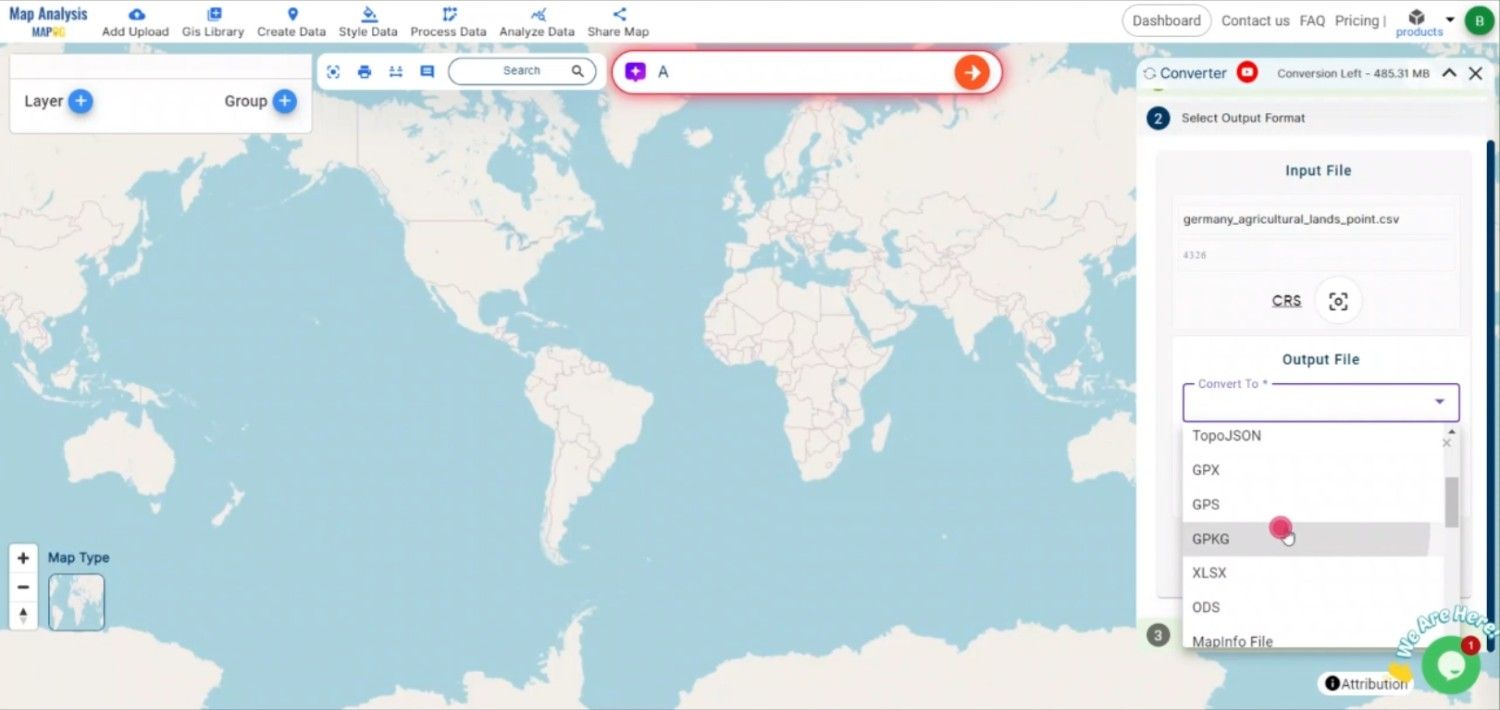
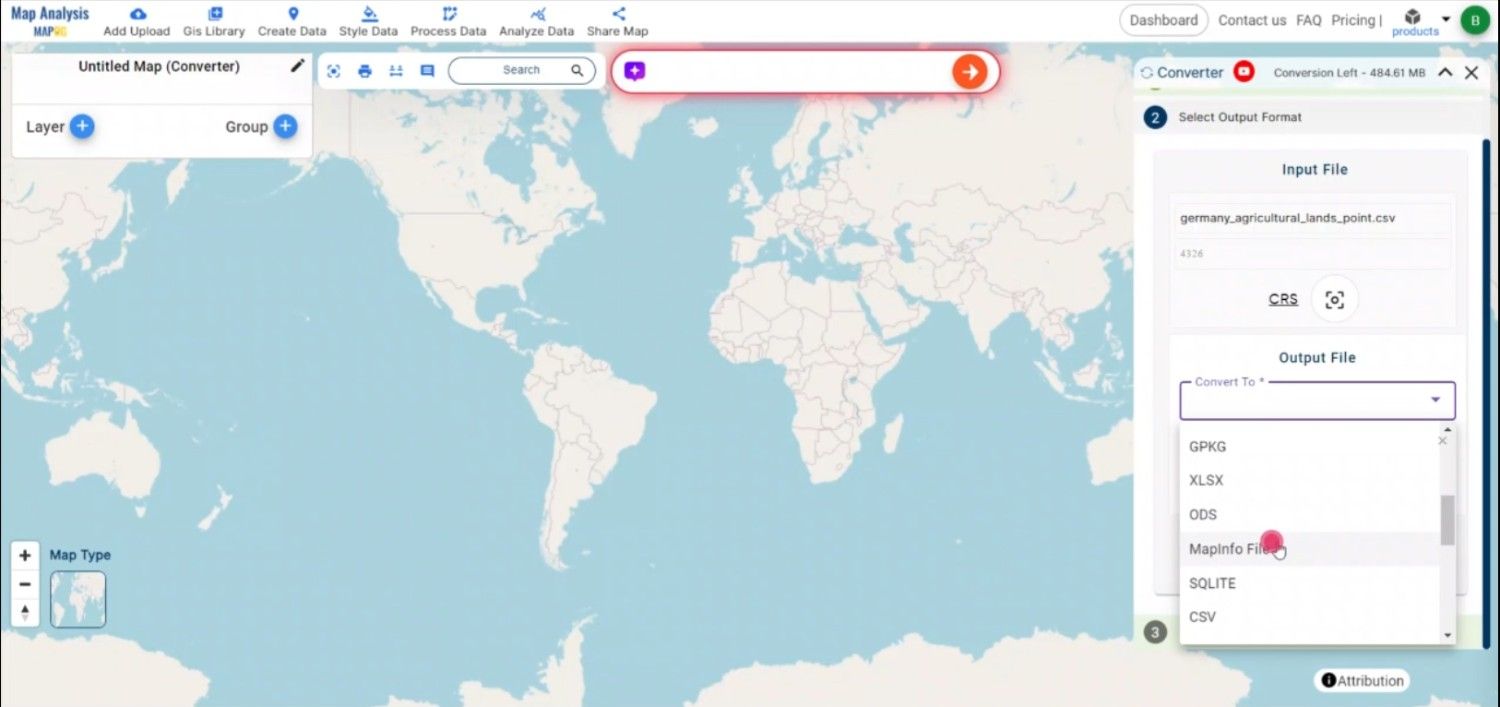
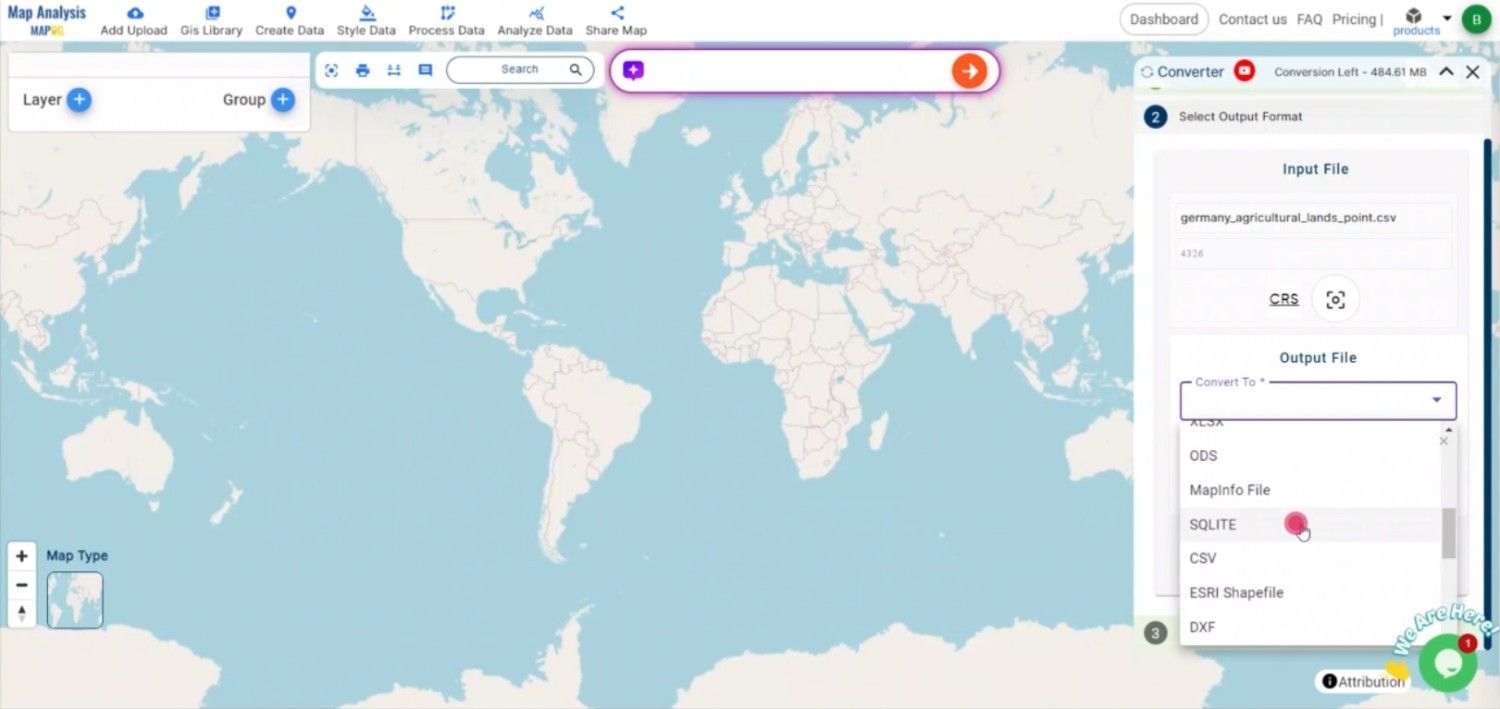
An extensive range of data formats is available, including KML, SHP, CSV, GeoJSON, Tab, SQL, TIFF, GML, KMZ, GPKG, SQLITE, DXF, MIF, TOPOJSON, XLSX, GPX, ODS, MID, and GPS, ensuring compatibility and accessibility for numerous applications and analytical needs.
Note:
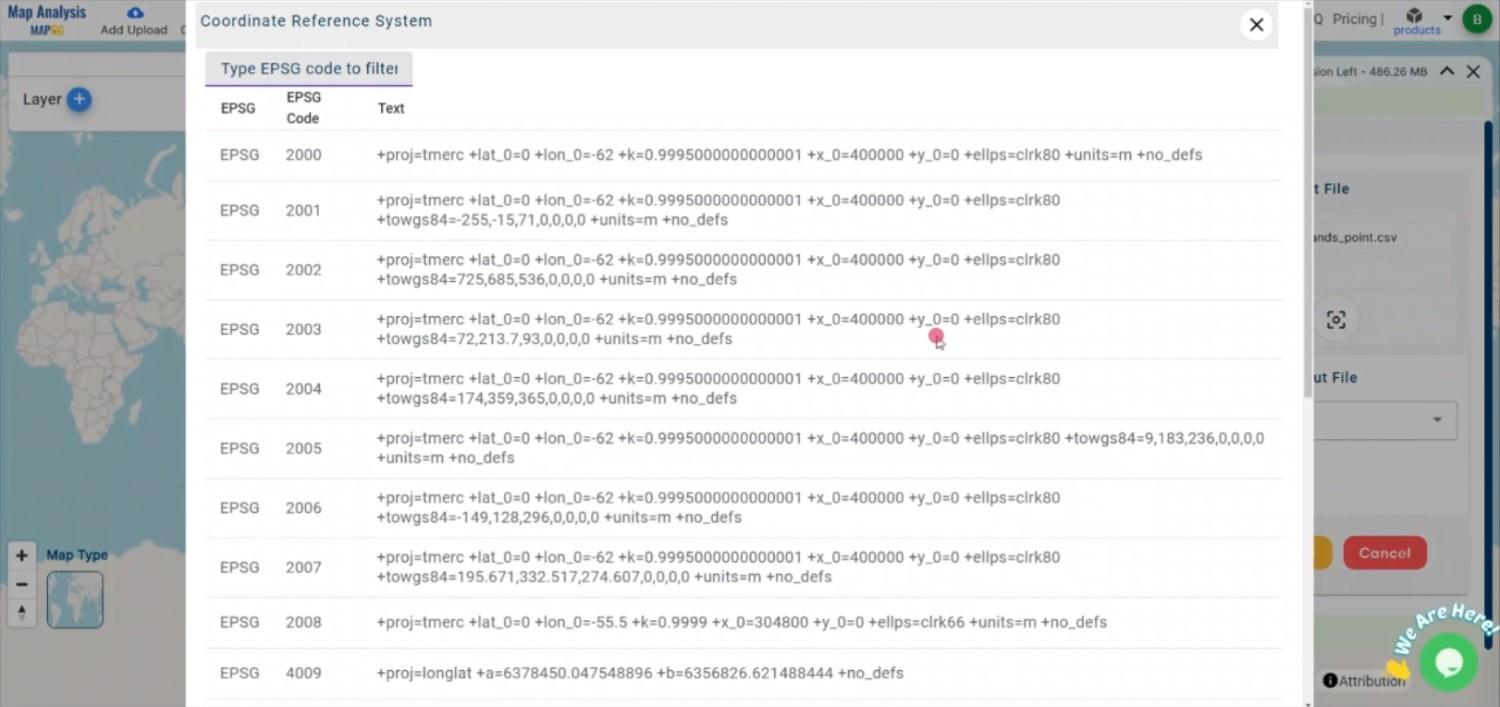
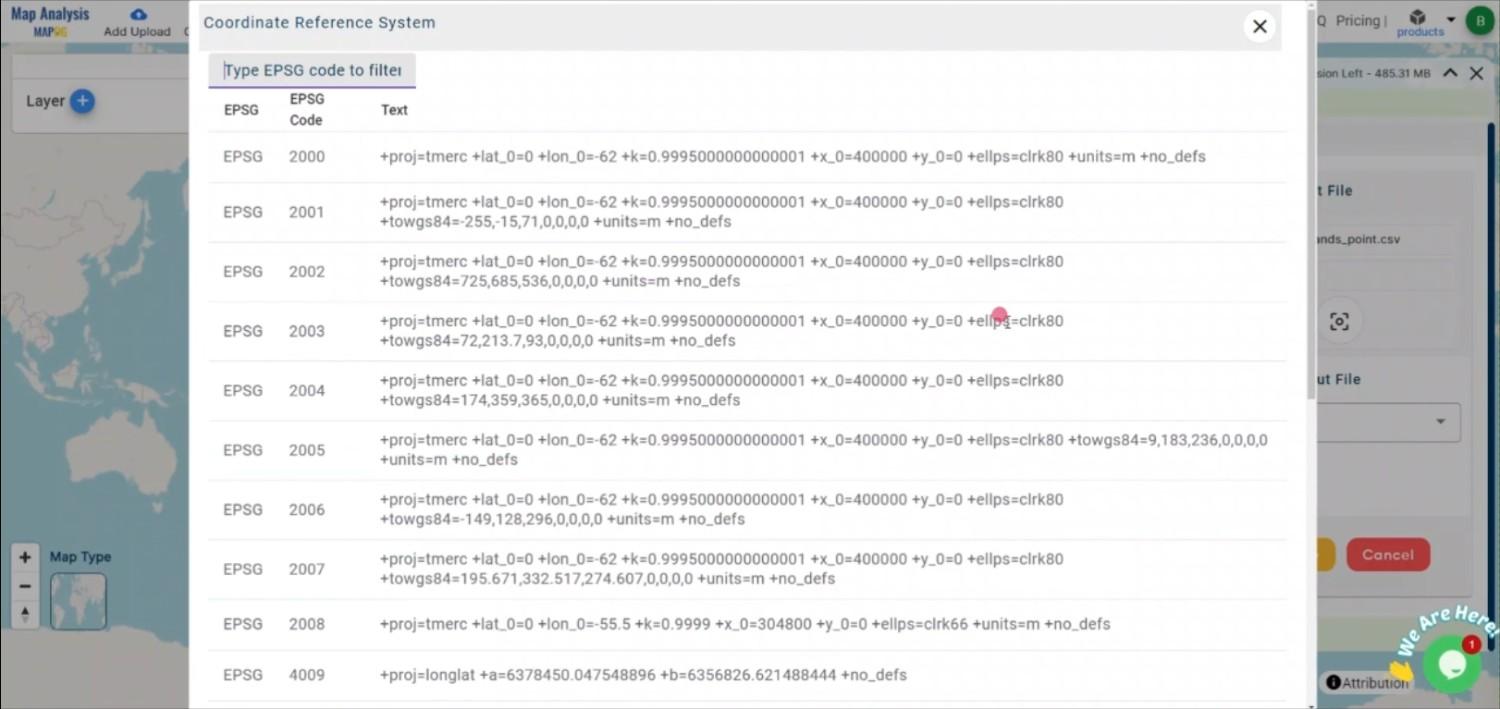
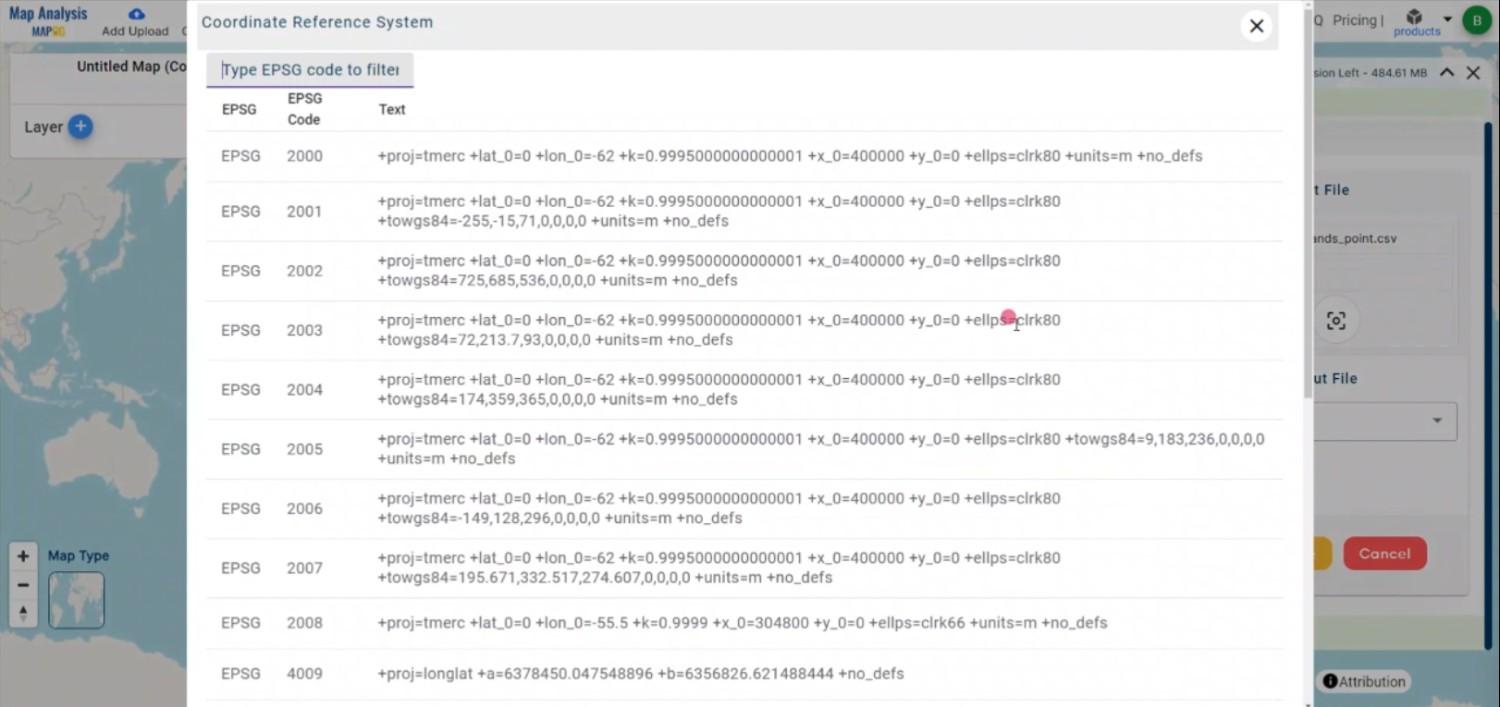
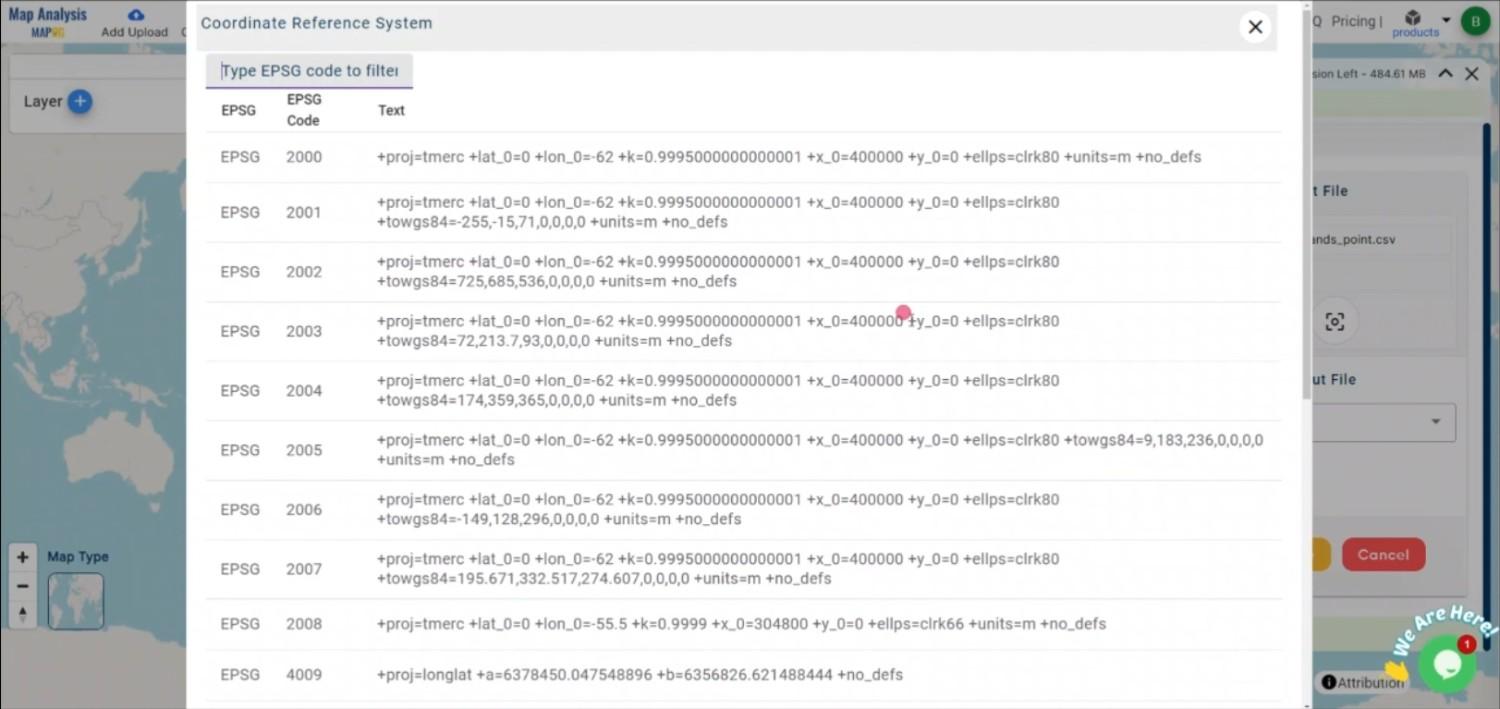
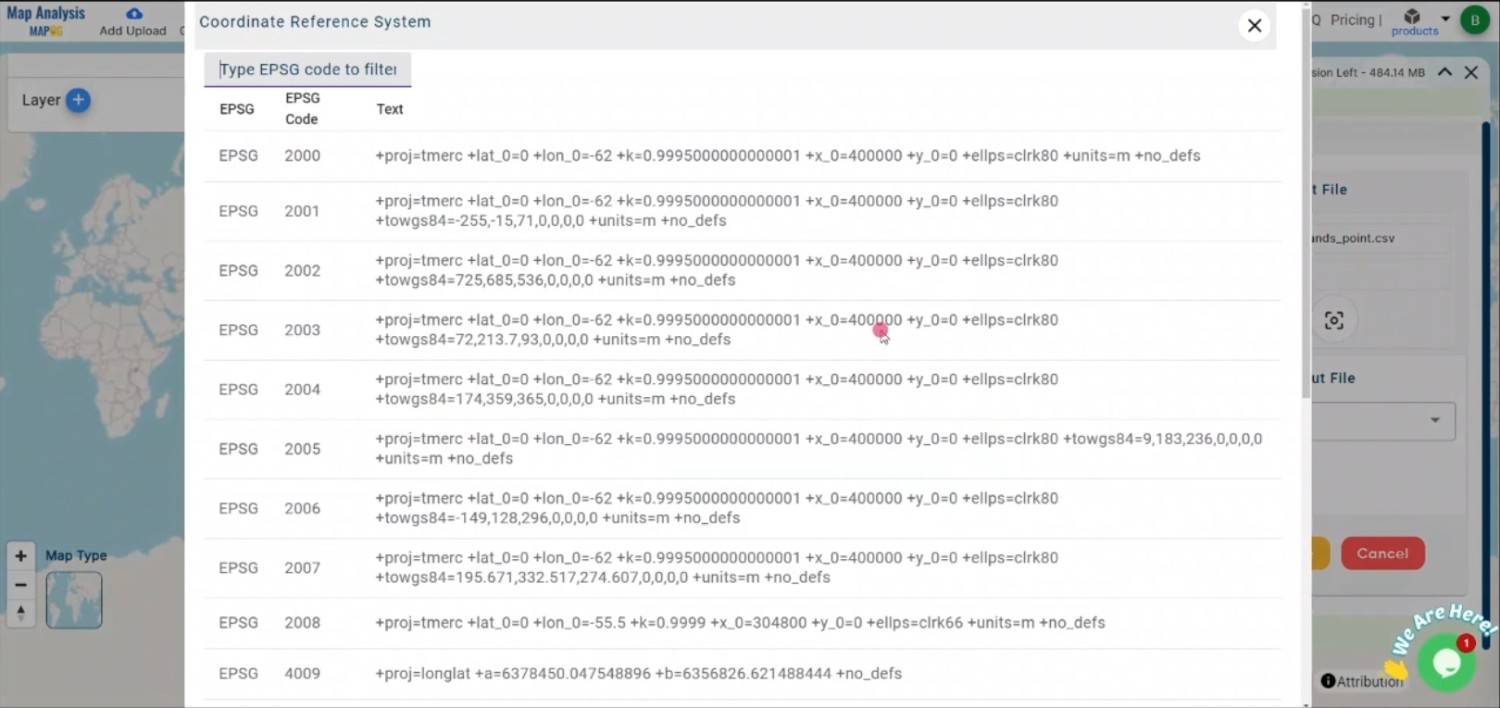
- All data is provided in GCS datum EPSG:4326 WGS84 CRS (Coordinate Reference System).
- Users need to log in to access and download their preferred data formats.
Step-by-Step Process to Download Pipeline Data
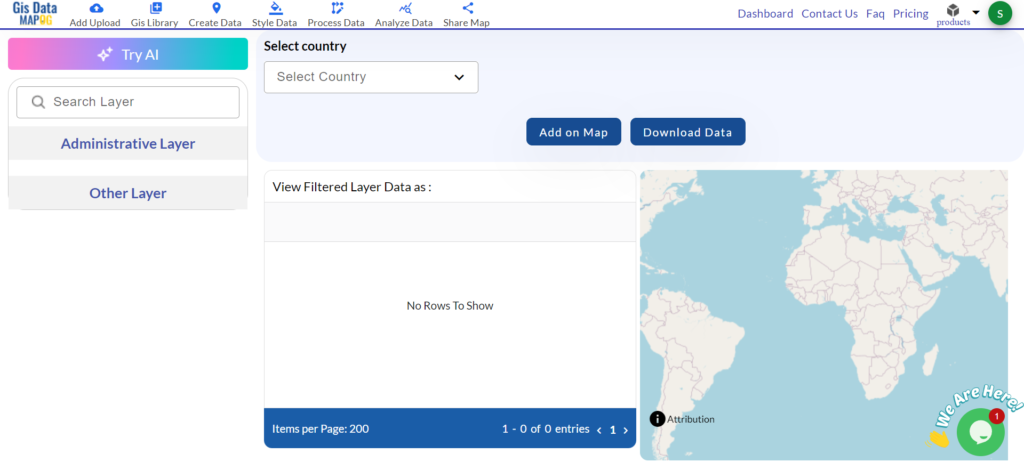
Step 1: Access GIS Data
Begin by logging into MAPOG with a valid email address. Once successfully logged in, navigate to the GIS data section to begin your search.
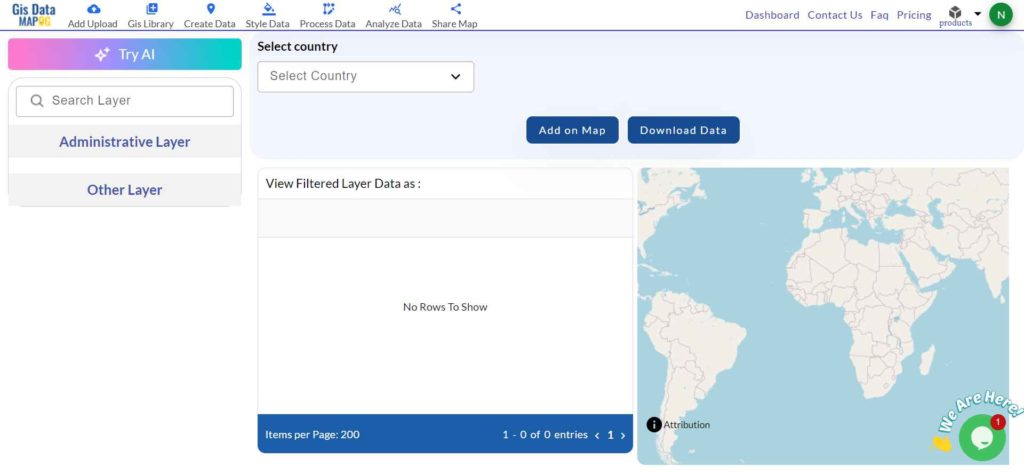
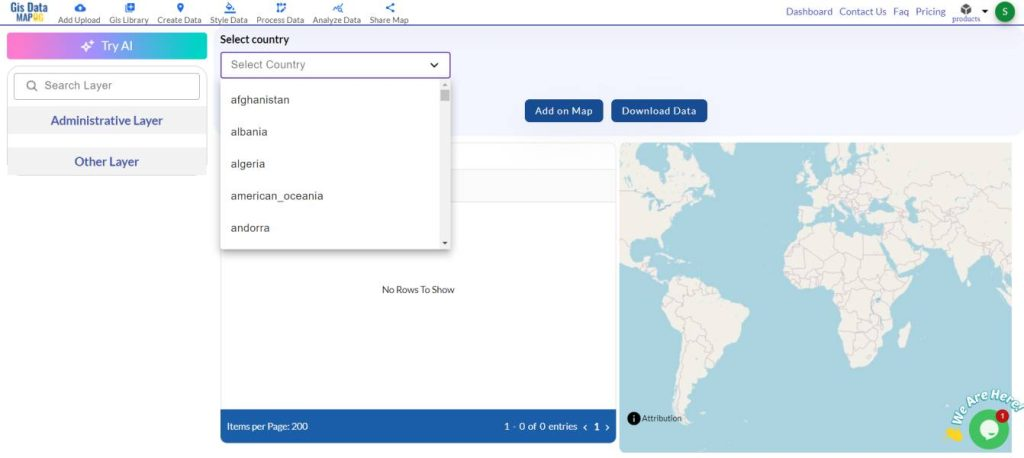
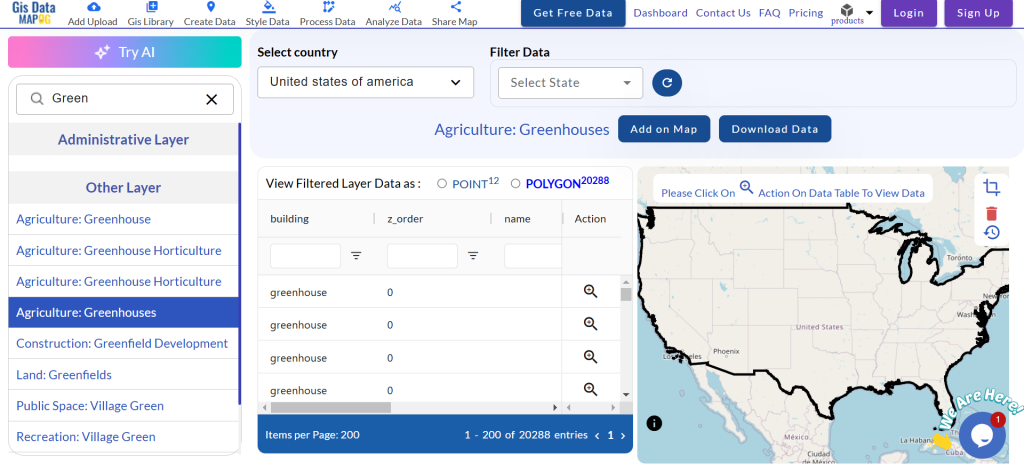
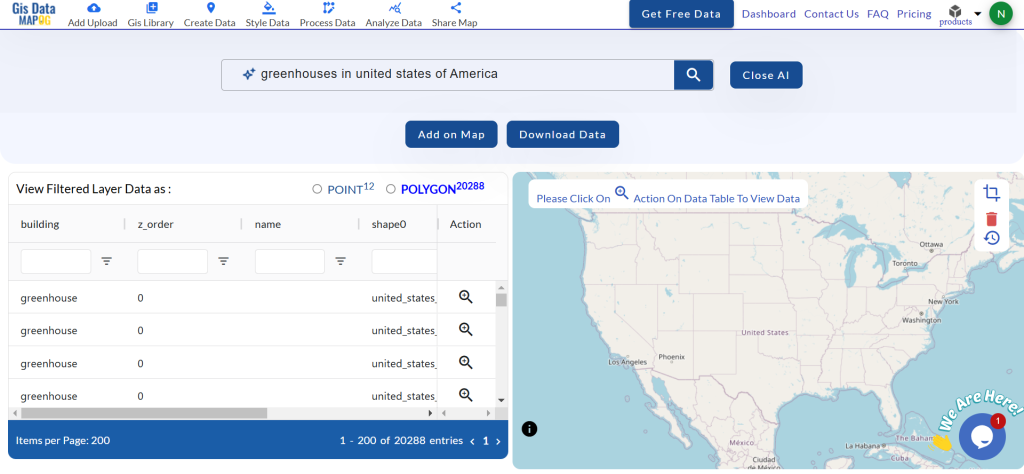
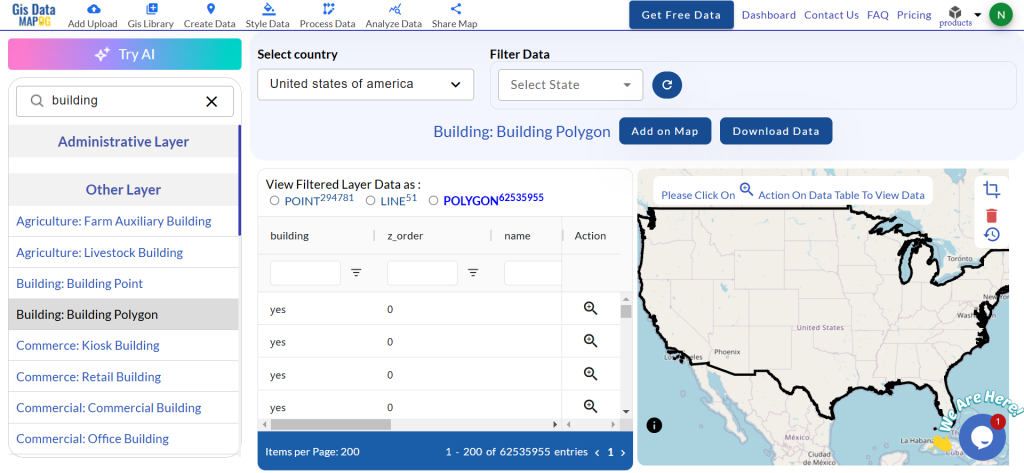
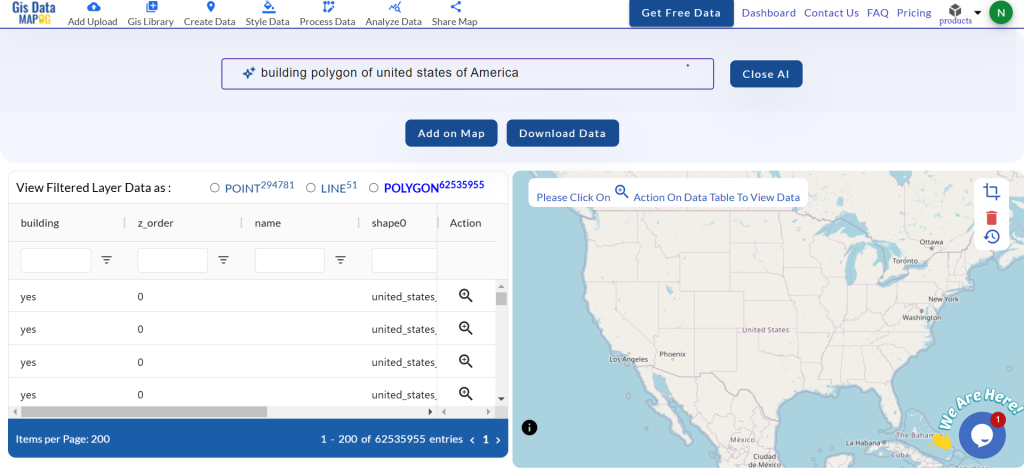
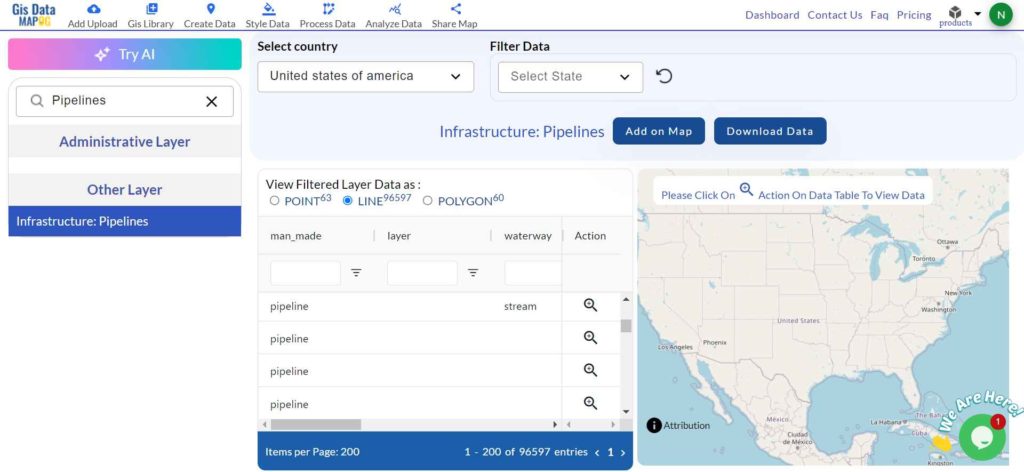
Step 2: Search for ‘Pipeline Data’
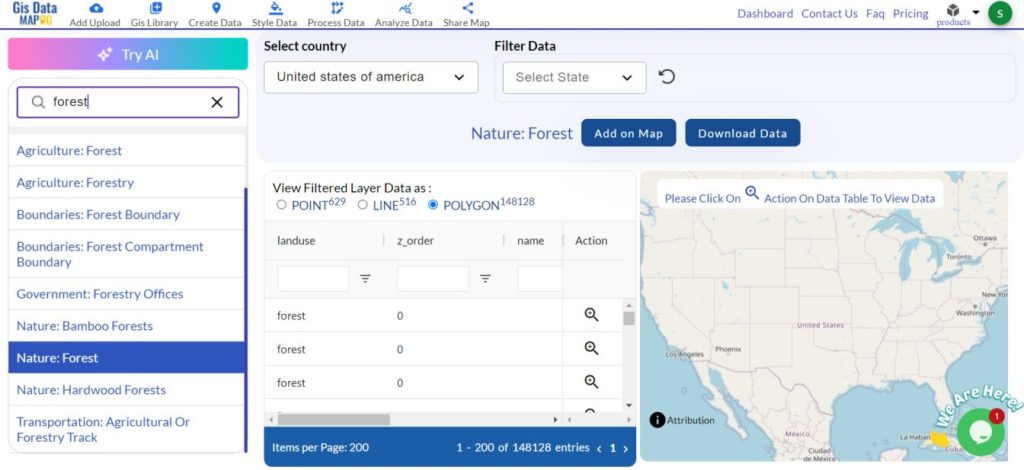
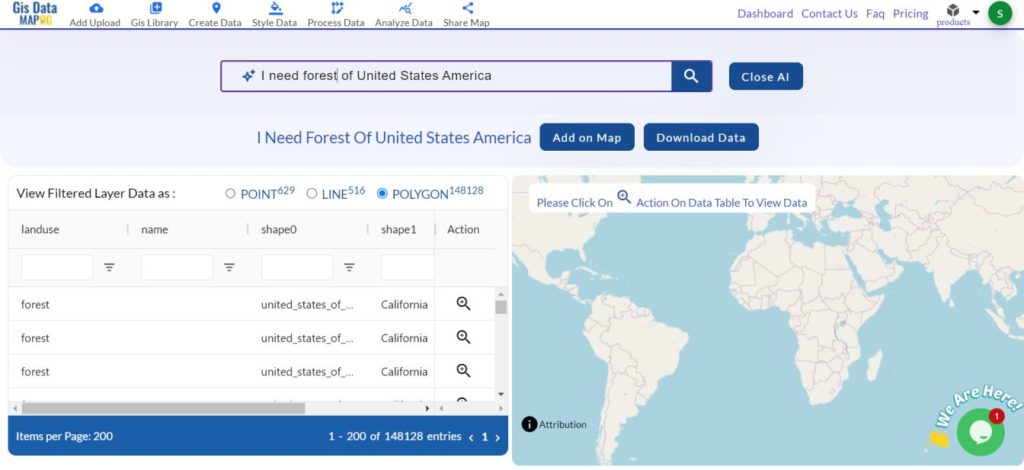
After accessing the GIS Data interface, select the country from which you wish to download data. Use the search layer option to look for the desired layer, such as “pipelines“. Review the data, its attributes, and its format (e.g., point or polygon). You can also utilize the “Try AI” tool located in the upper left corner to simplify your search—just specify the data you need and the area, and the tool will provide the corresponding data.
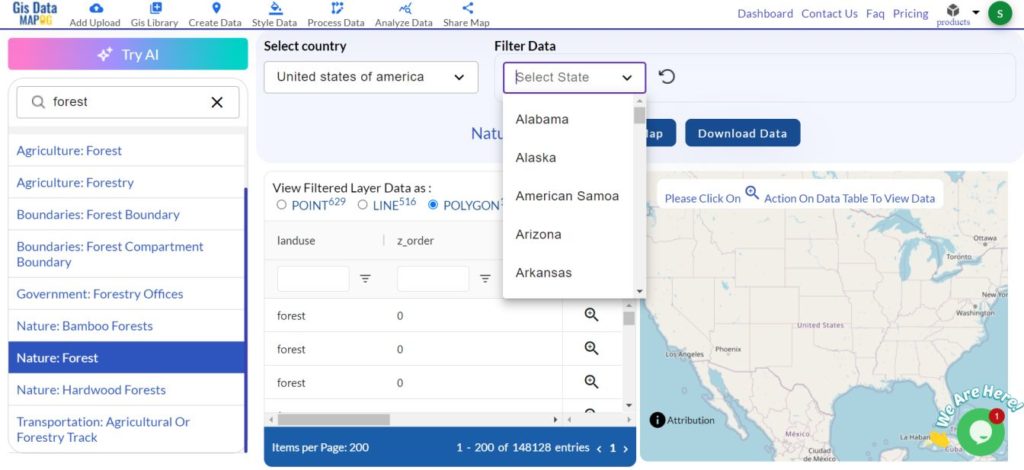
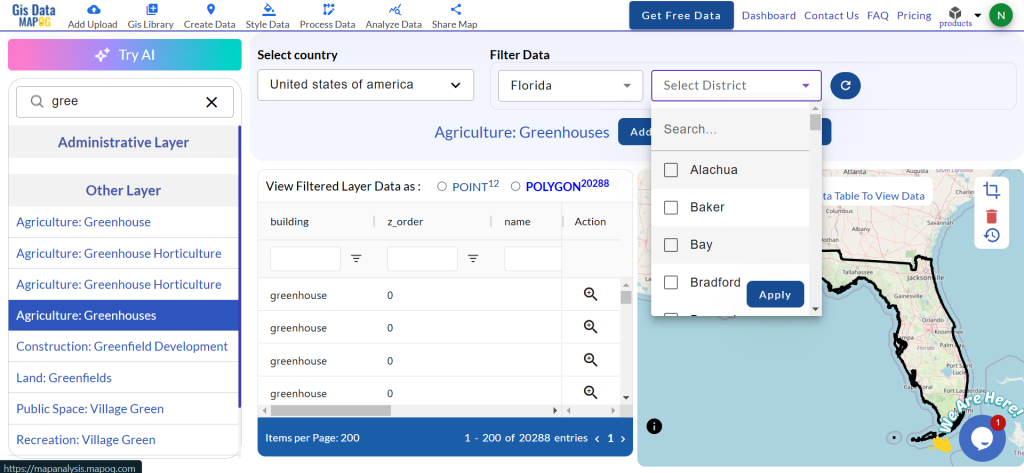
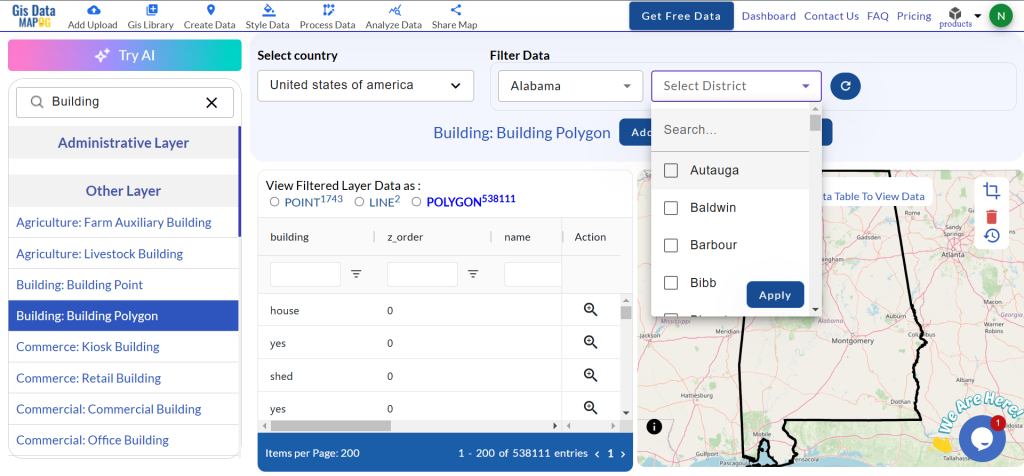
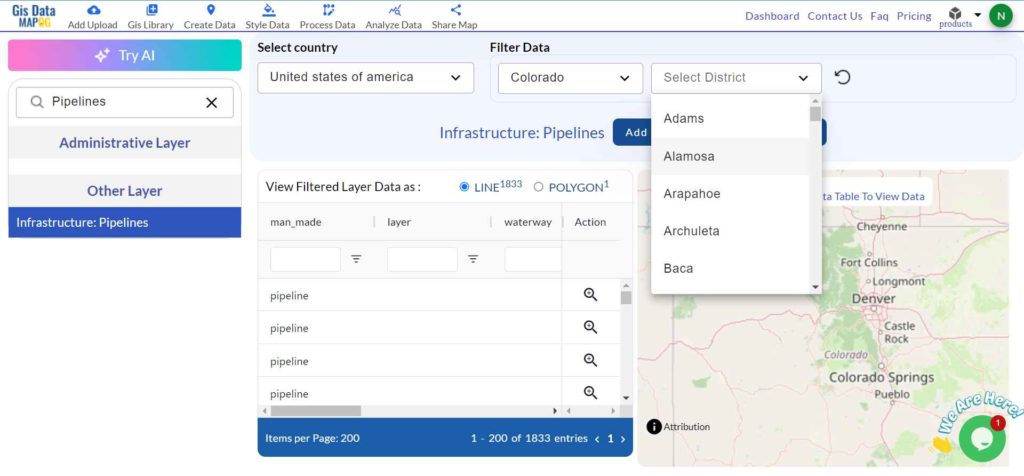
Step 3: Filter Data
Use the filter data option to refine your search by selecting specific states and districts. This feature allows for the location of more precise geographic information, enabling a deeper dive into data, such as narrowing down to specific states or districts. It enhances the accuracy and relevance of the data for targeted analysis or mapping.
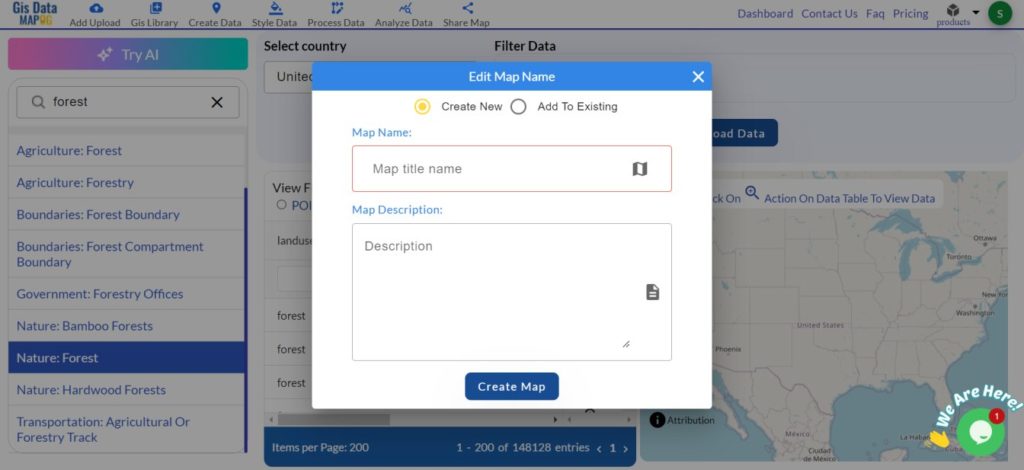
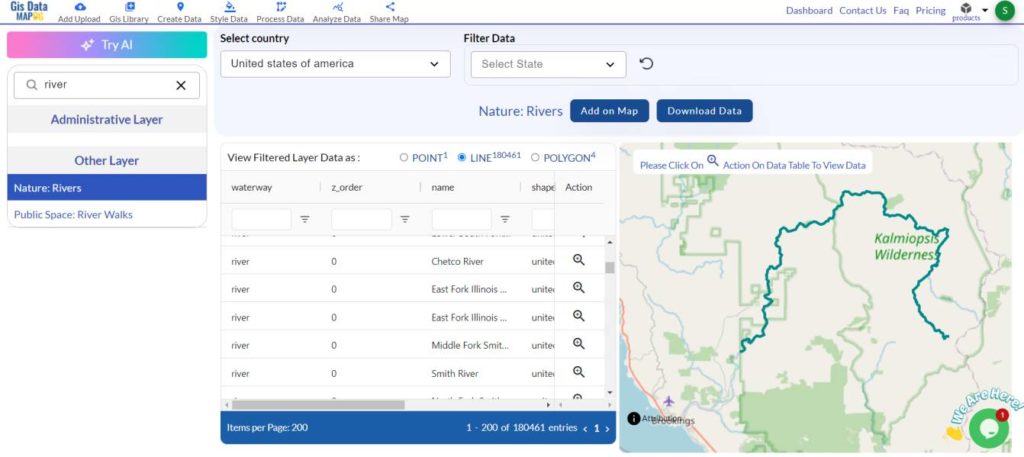
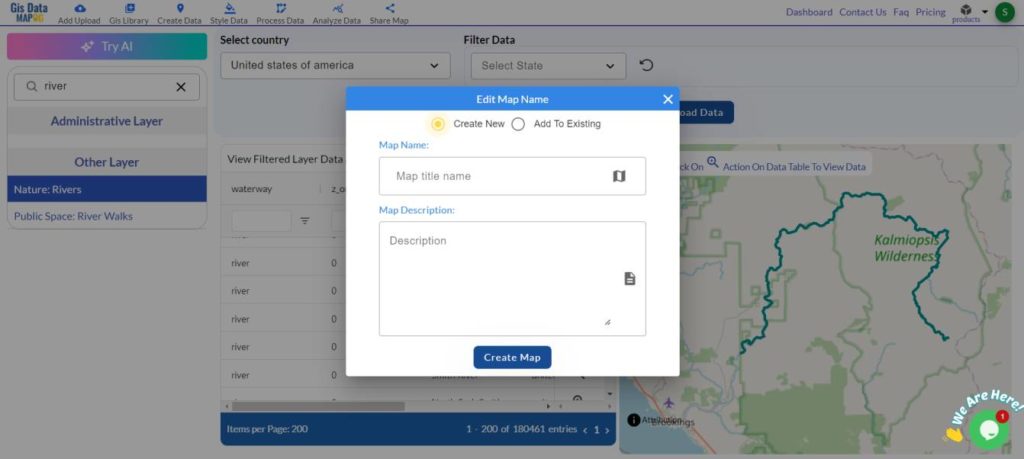
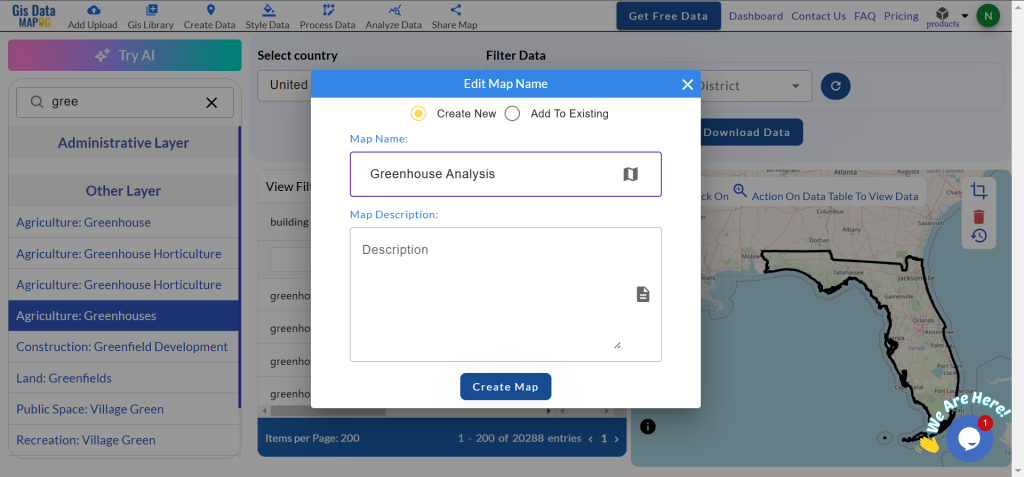
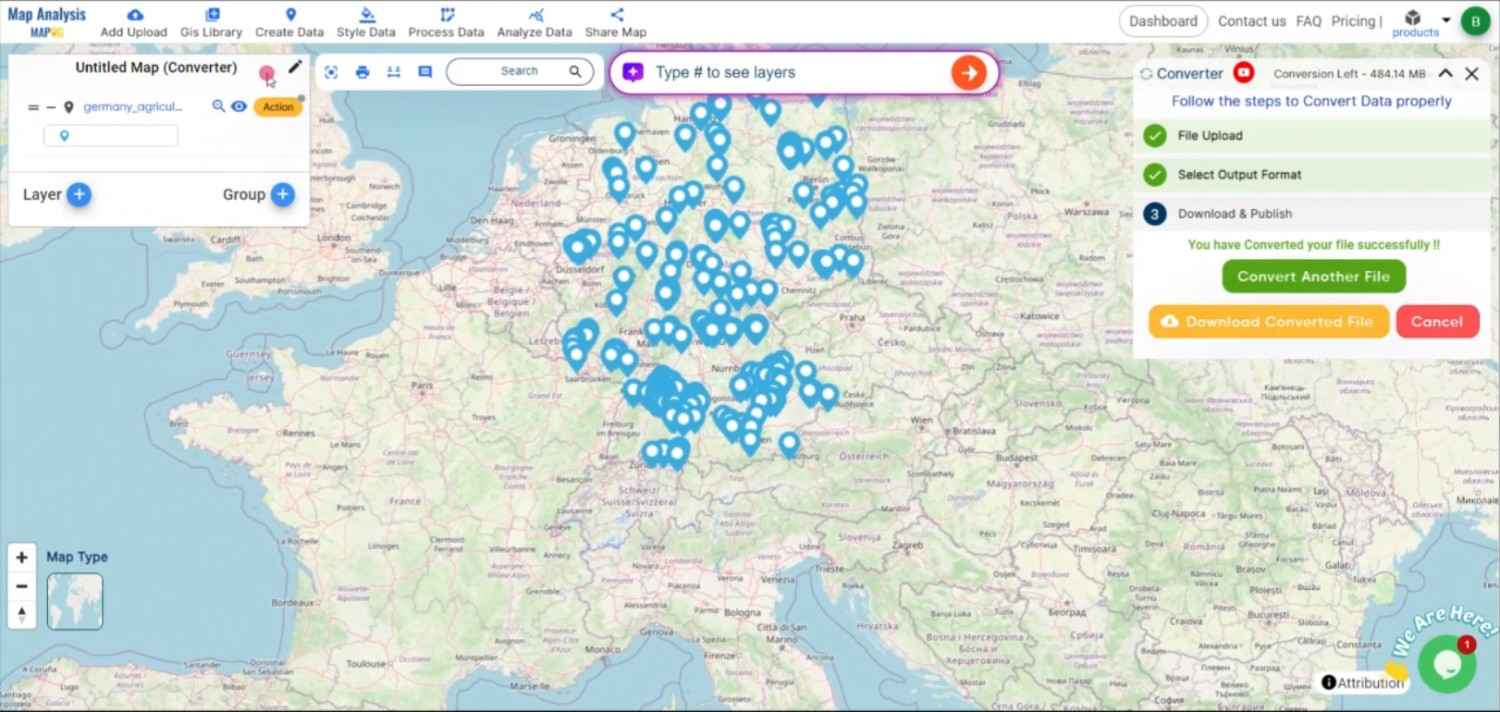
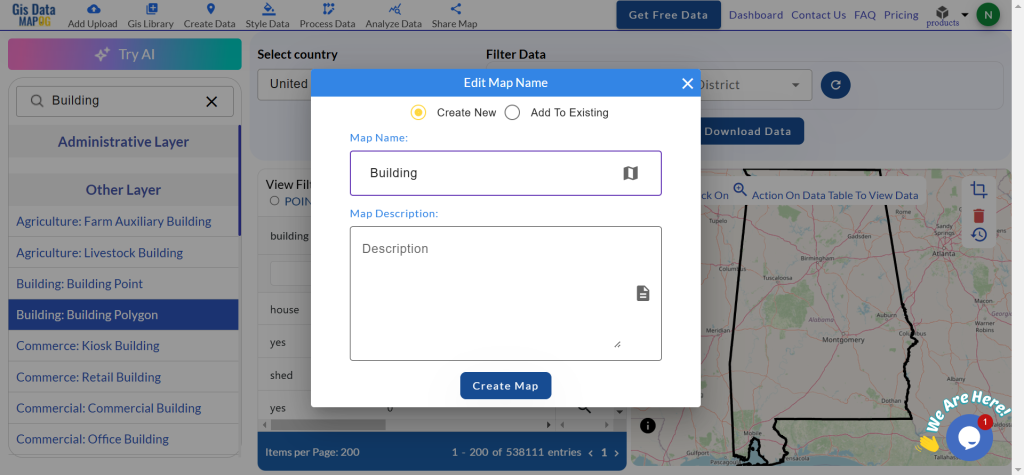
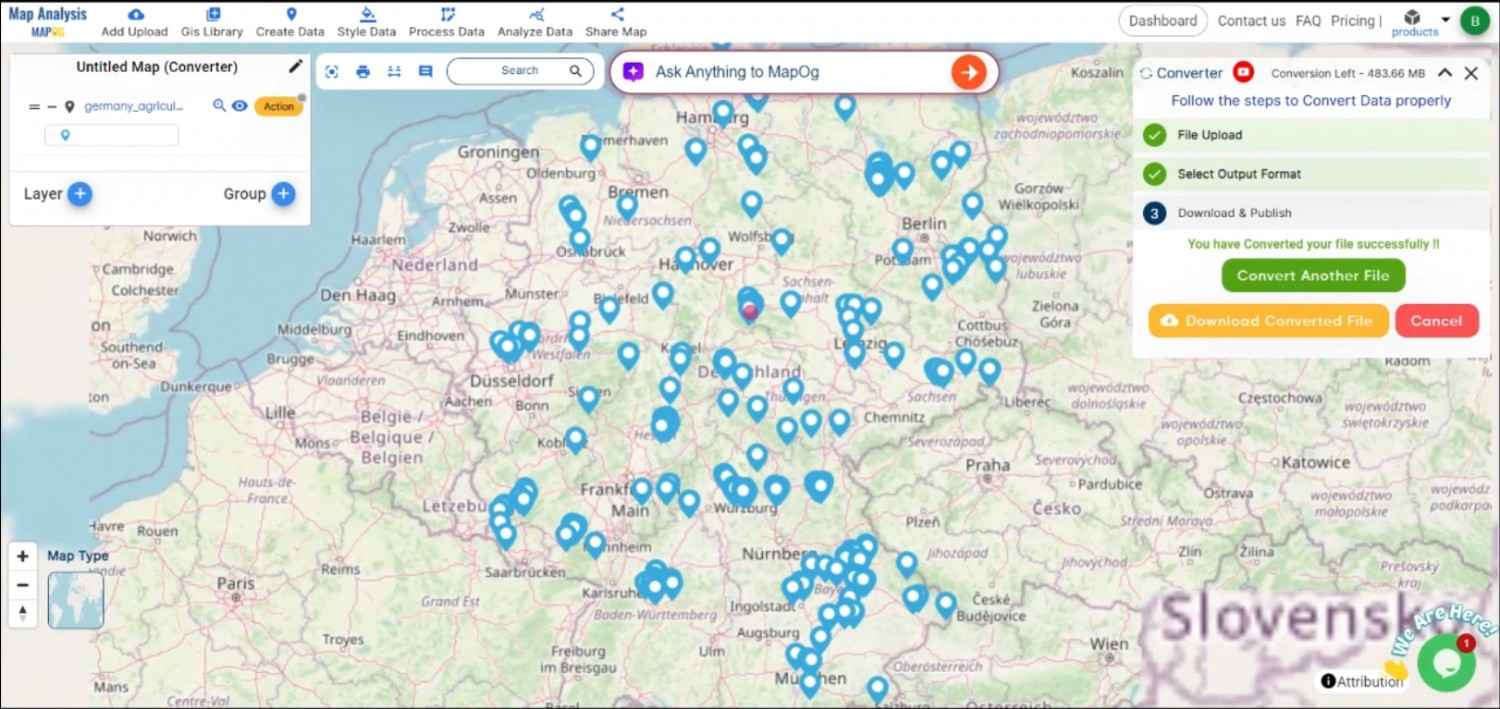
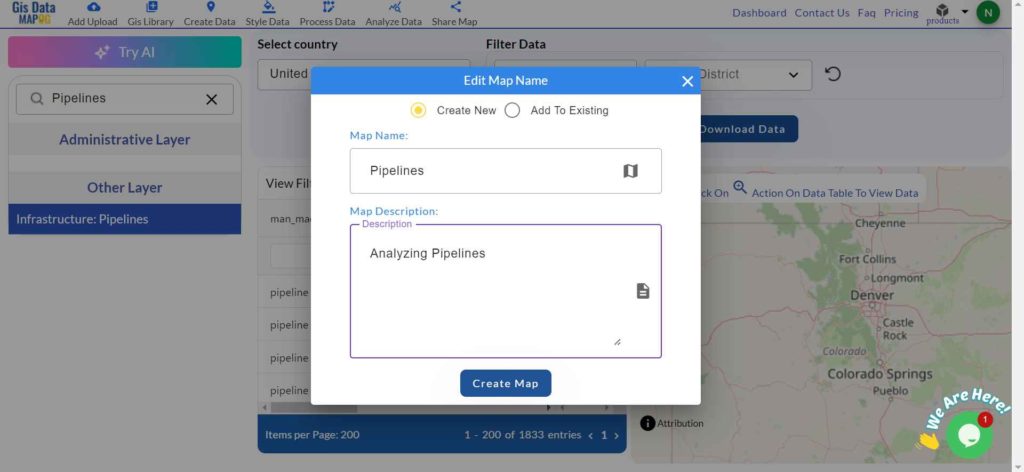
Step 4: Add on Map
Leverage the “Add on Map” feature to overlay the selected pipeline data onto the MAPOG interface for further investigation. This function helps users visualize spatial relationships and patterns, enhancing decision-making in GIS projects. You can add the dataset to a new map or include it in an existing map.
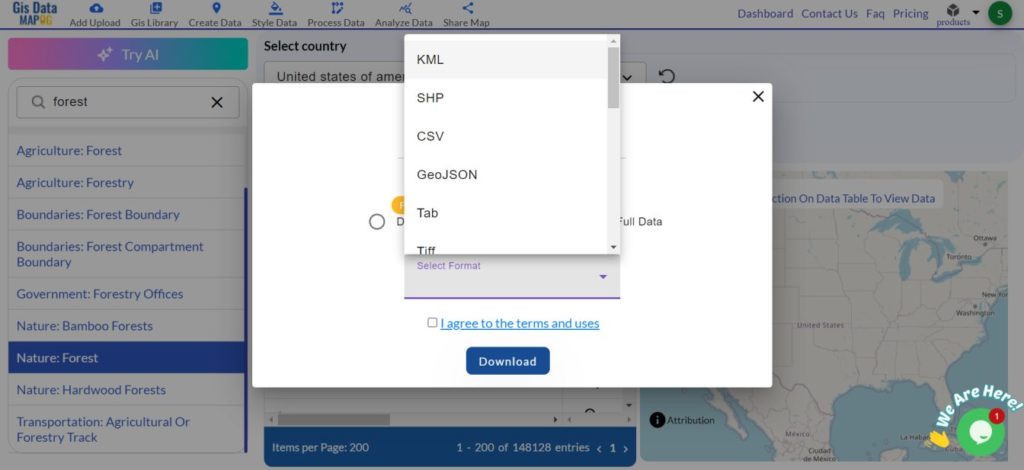
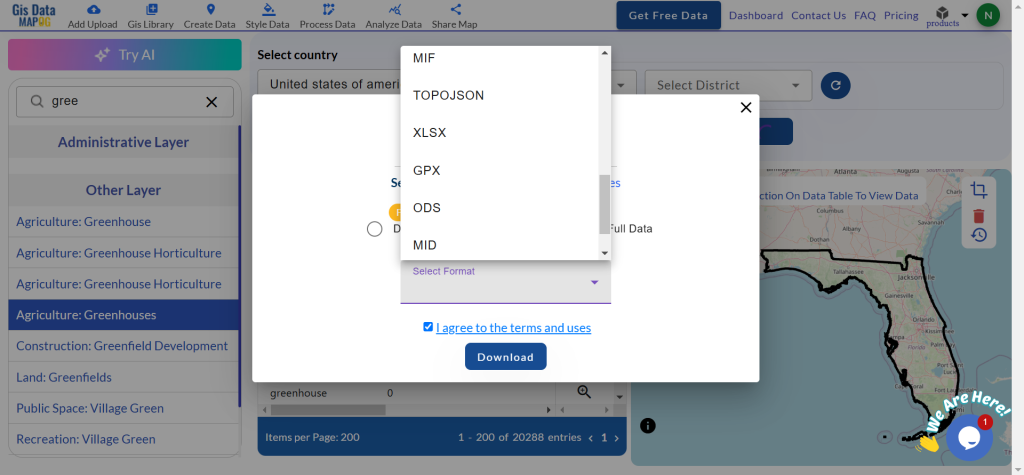
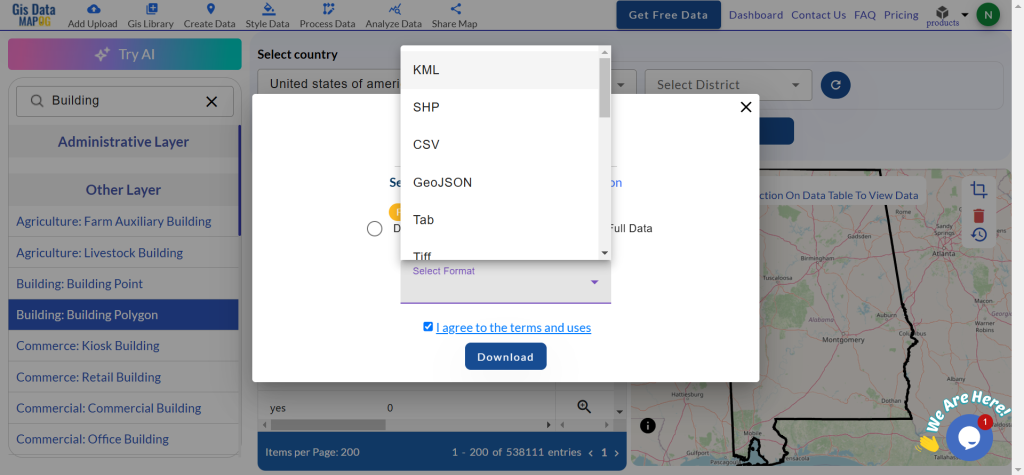
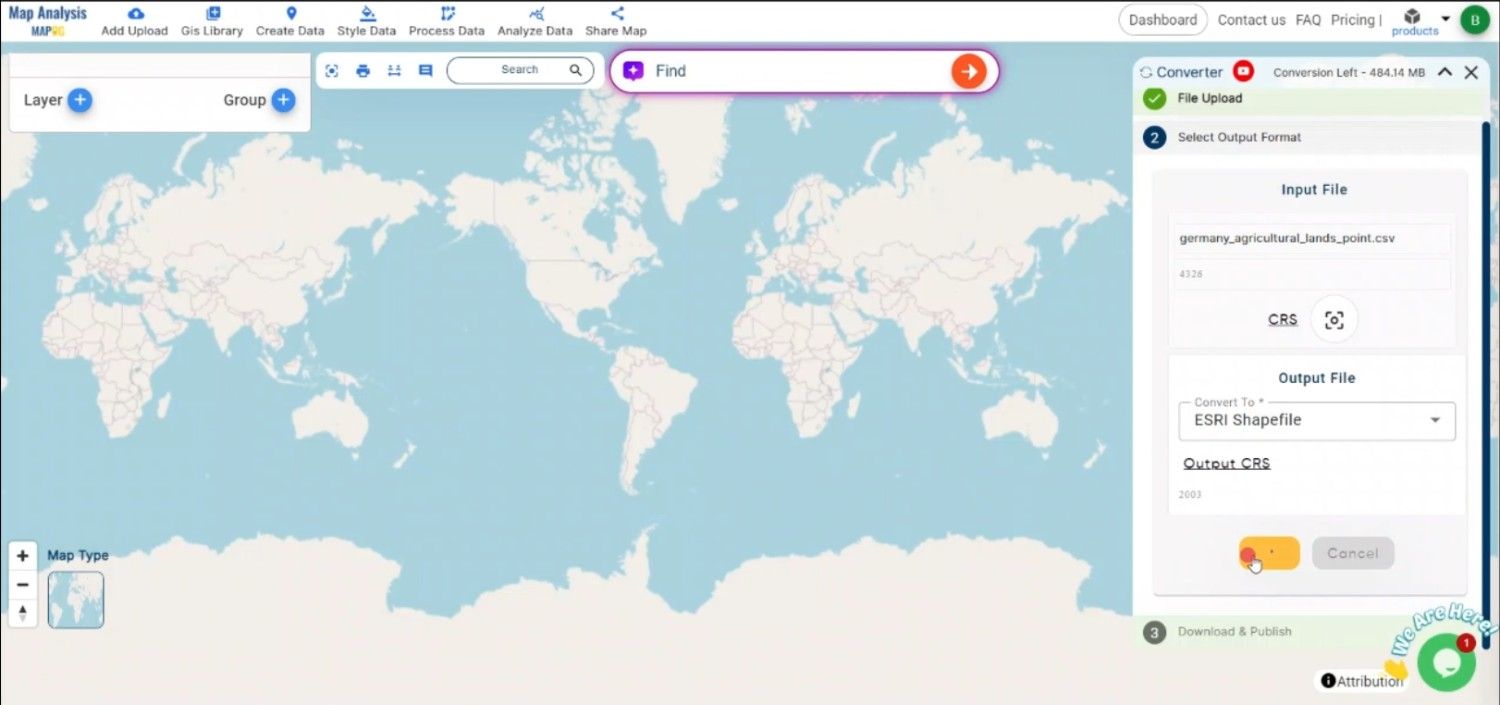
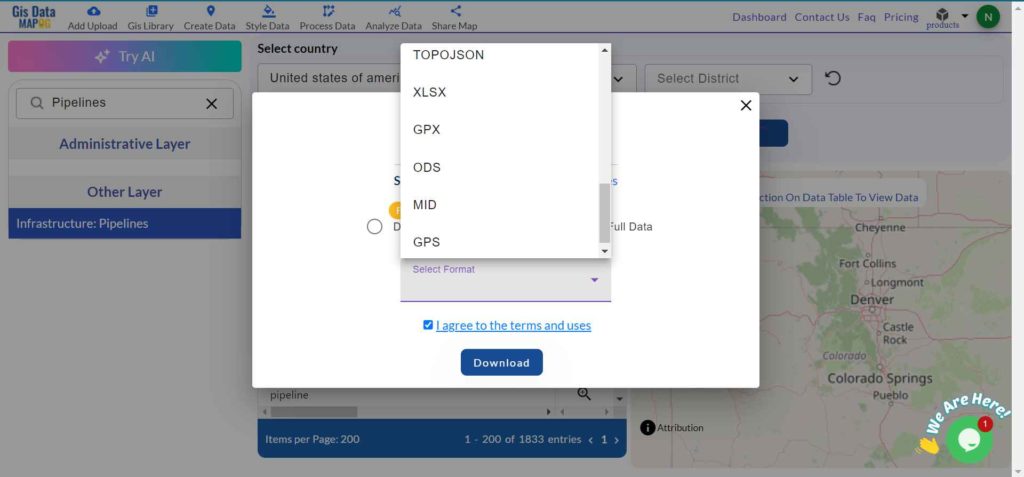
Step 5: Download Data
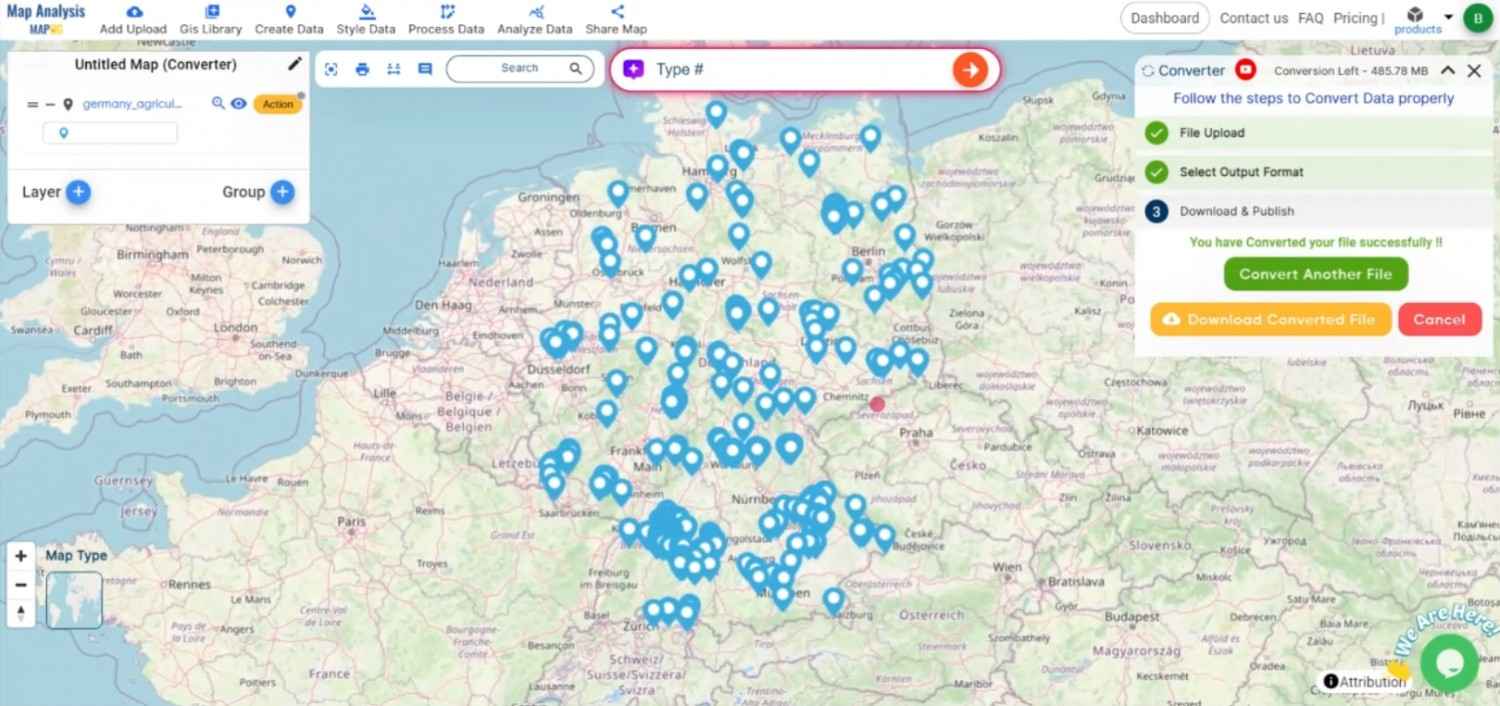
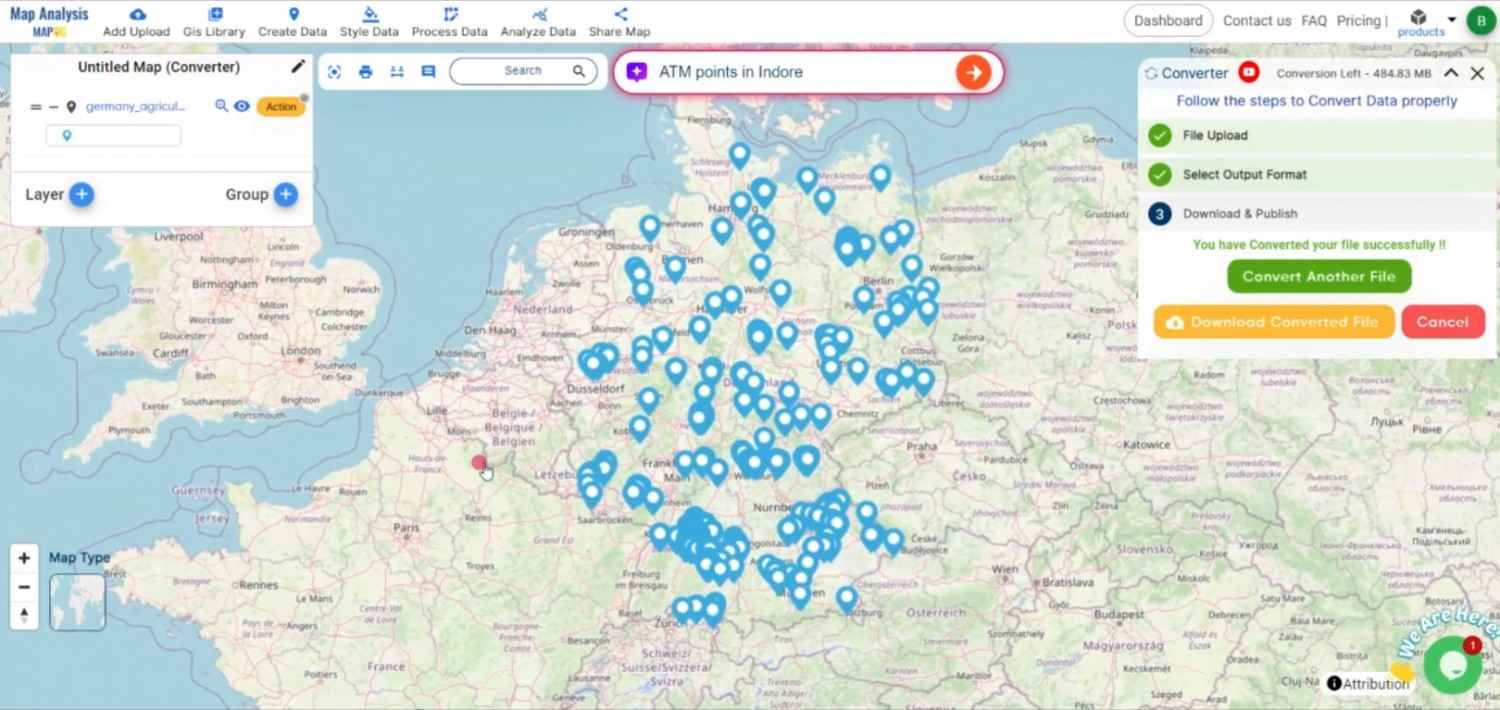
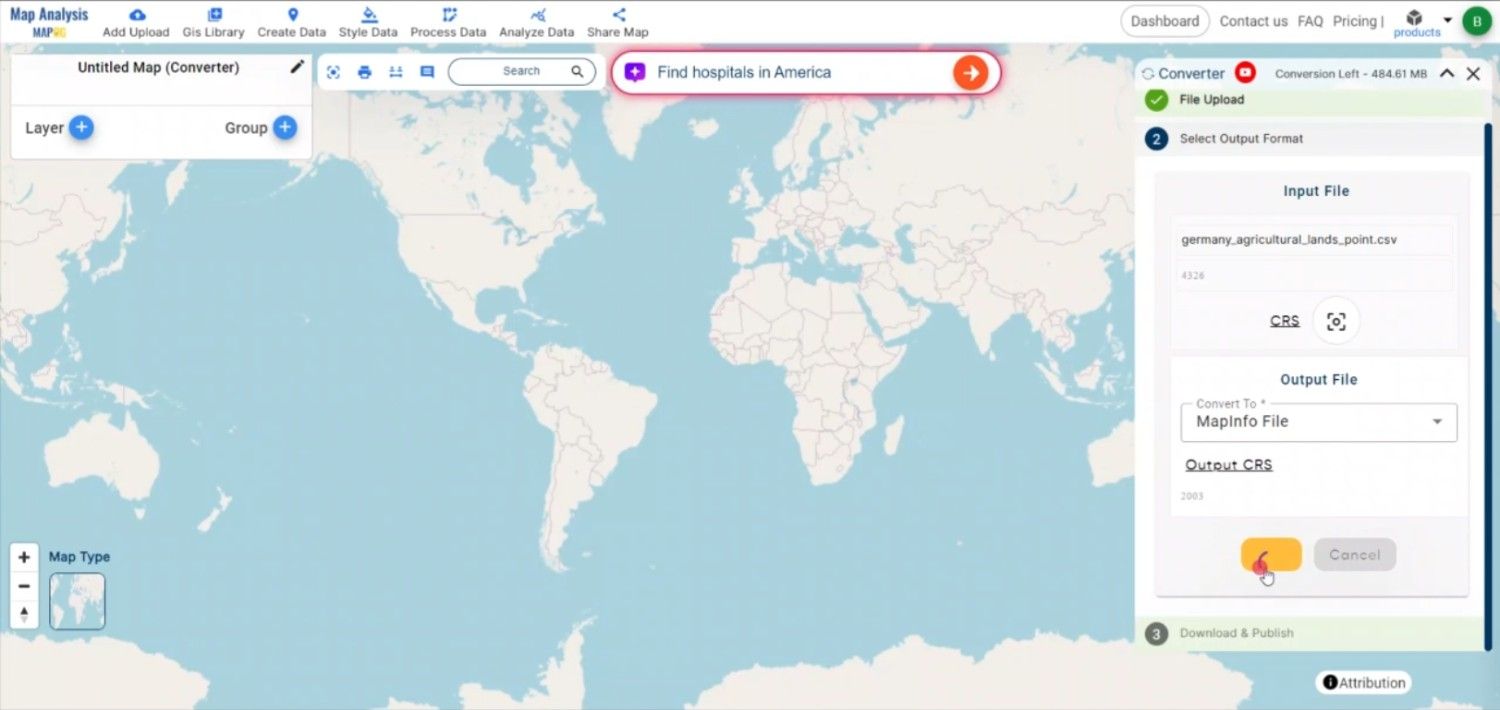
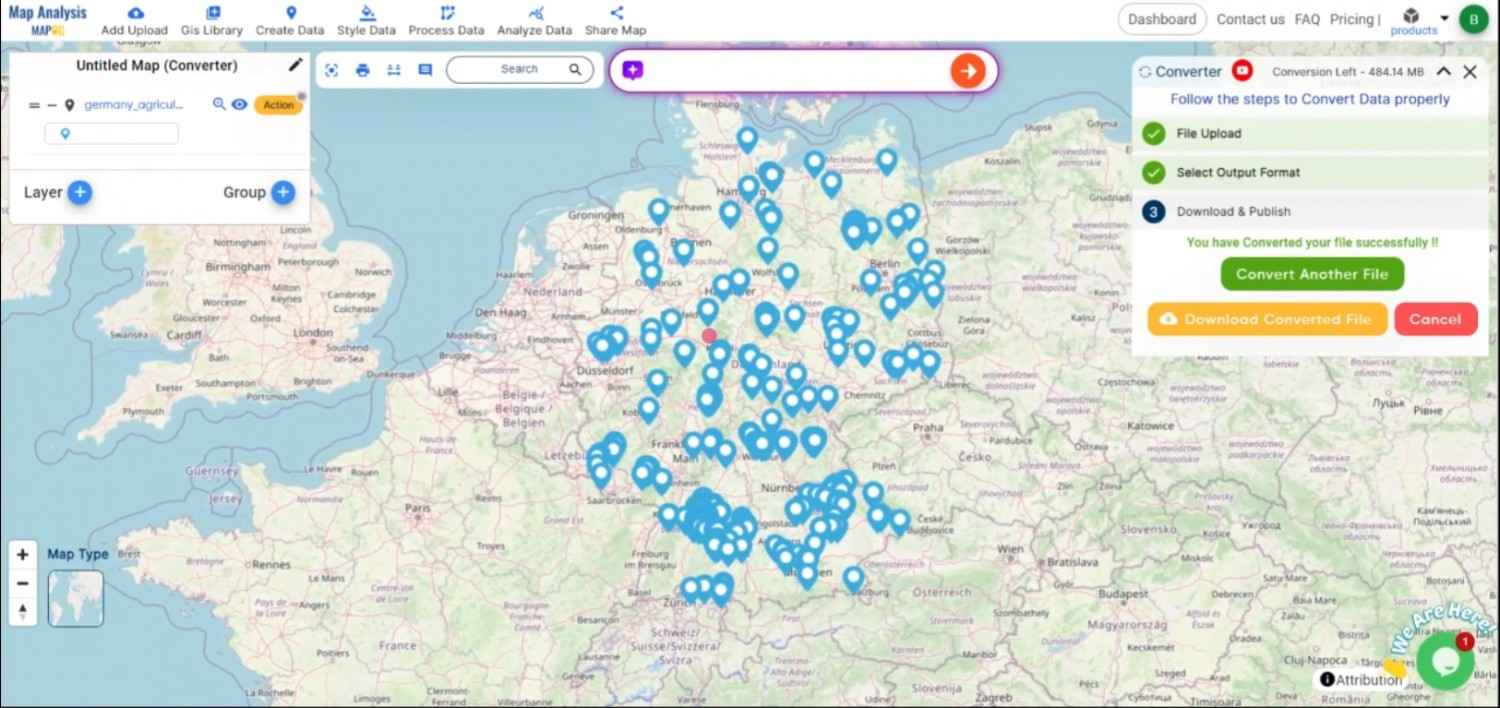
Click on the “Download Data” button. Choose between downloading sample data or the full dataset, depending on your needs. Then, select the desired format from the available options—Shapefile, KML, GeoJSON, or any of the other 15+ supported GIS formats. After agreeing to the terms and conditions, click on the download button again to complete the process, and your data will be downloaded.
Conclusion
Downloading pipeline data in multiple GIS formats from GIS Data by MAPOG is an uncomplicated and efficient process, facilitated by a series of easy steps. This platform enables access to accurate and current geographic data in numerous formats, providing flexibility and support for a wide array of planning, mapping, and analytical applications.
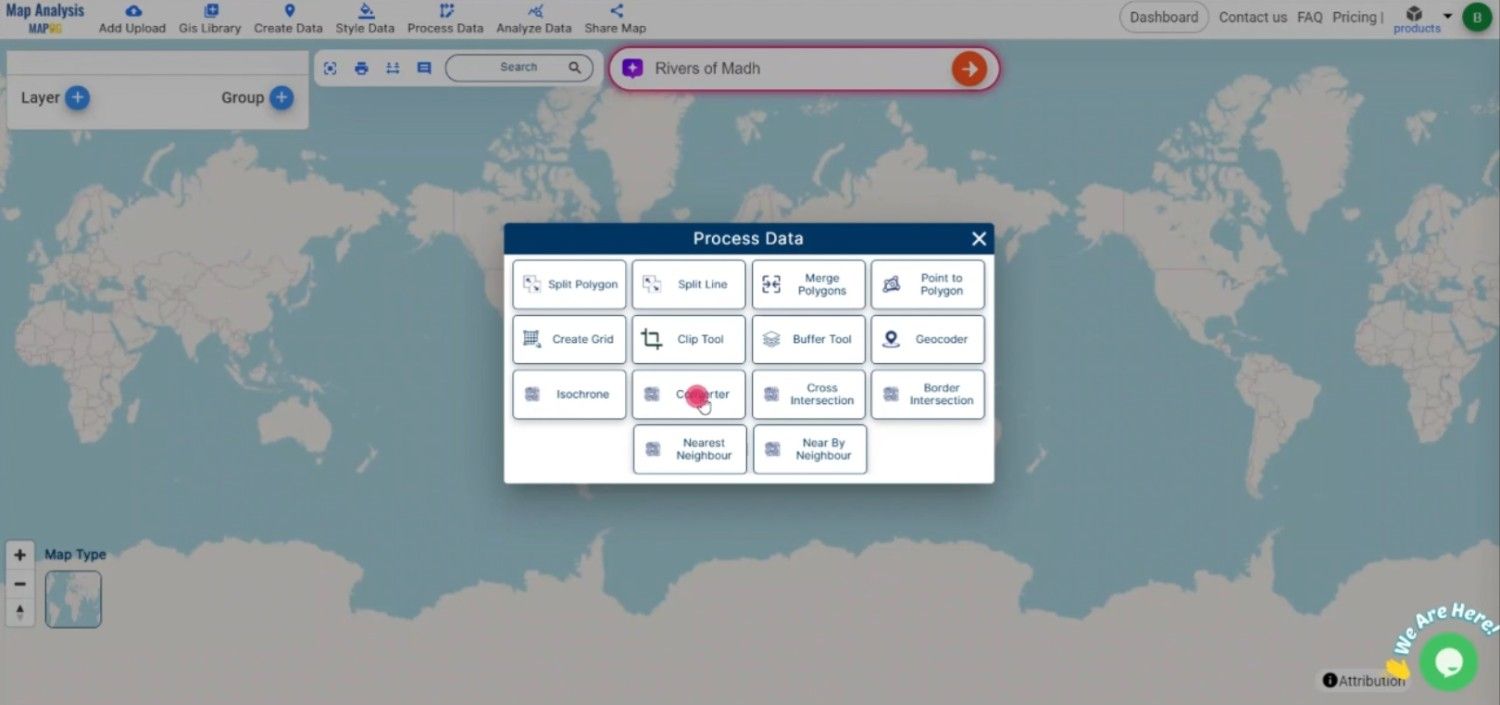
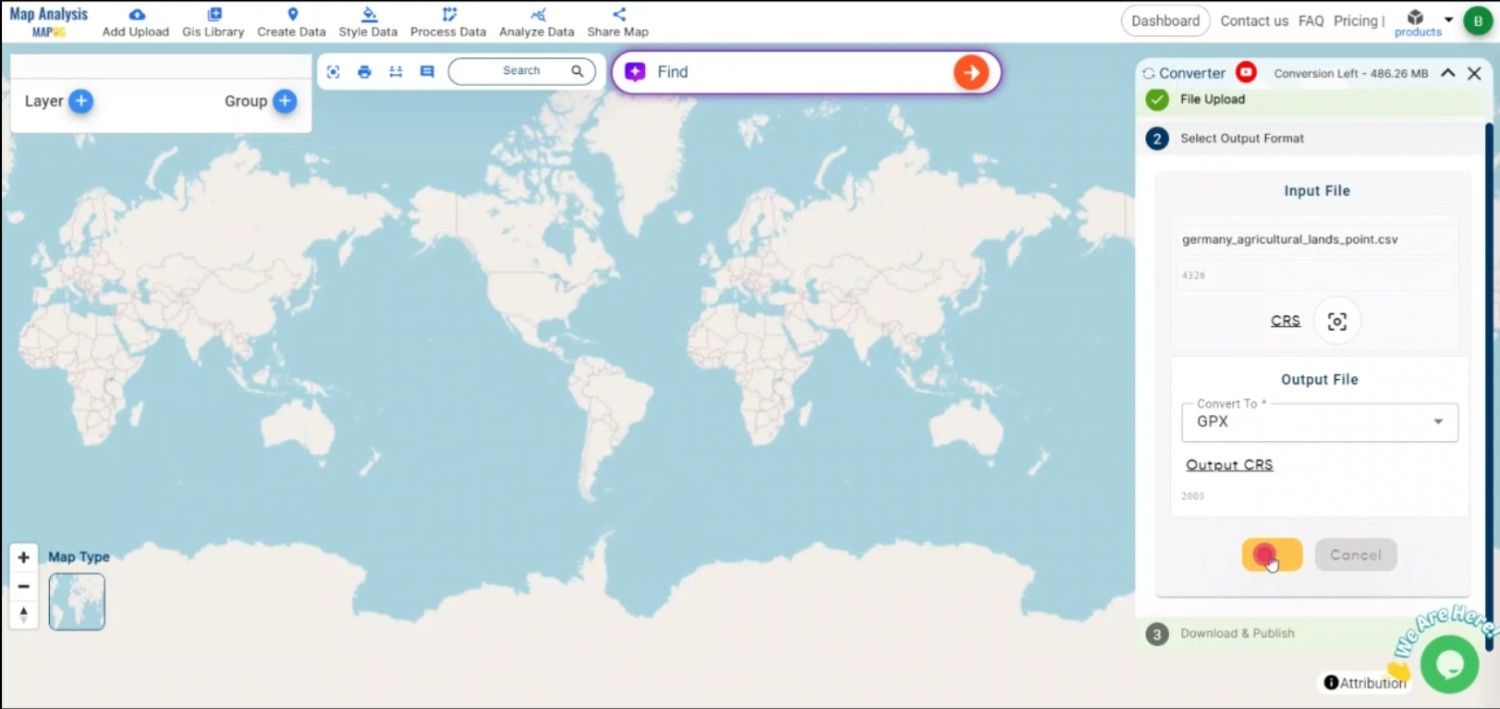
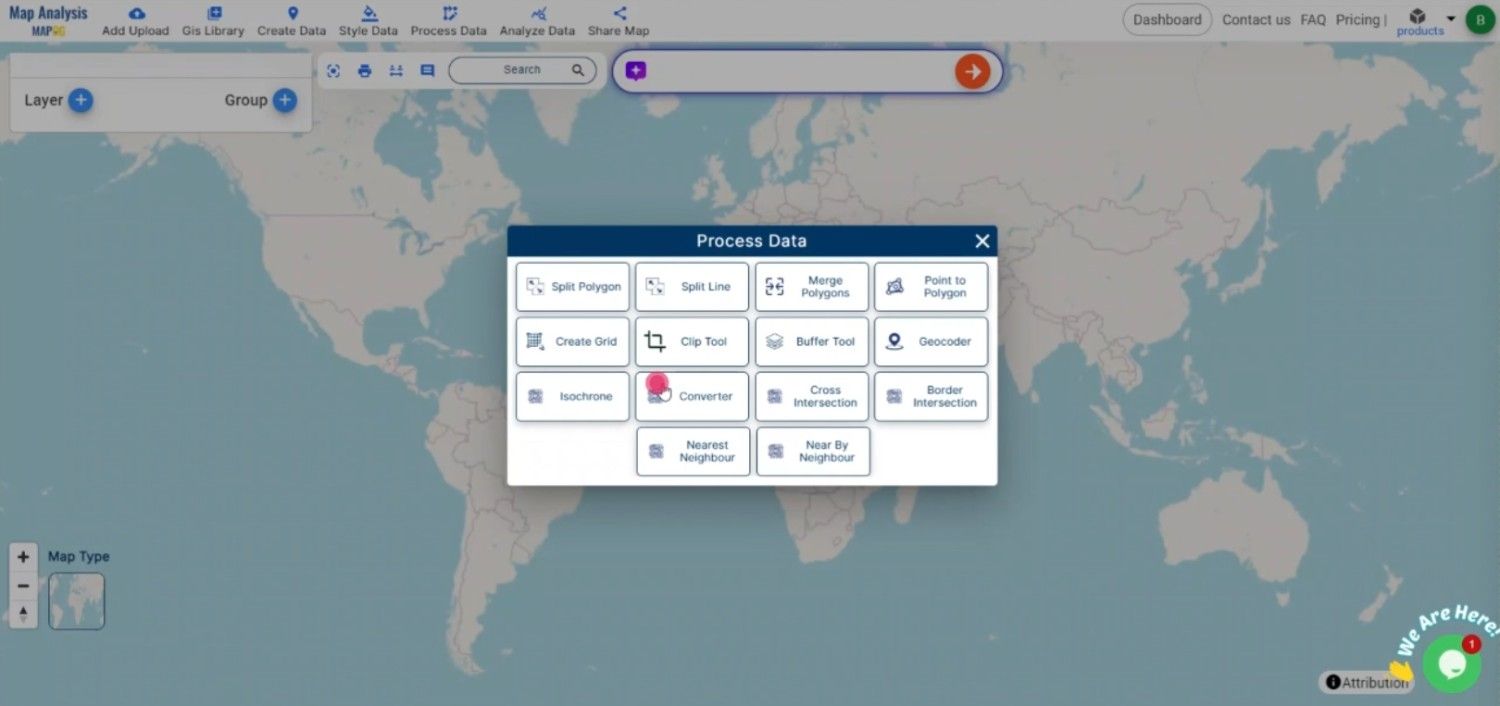
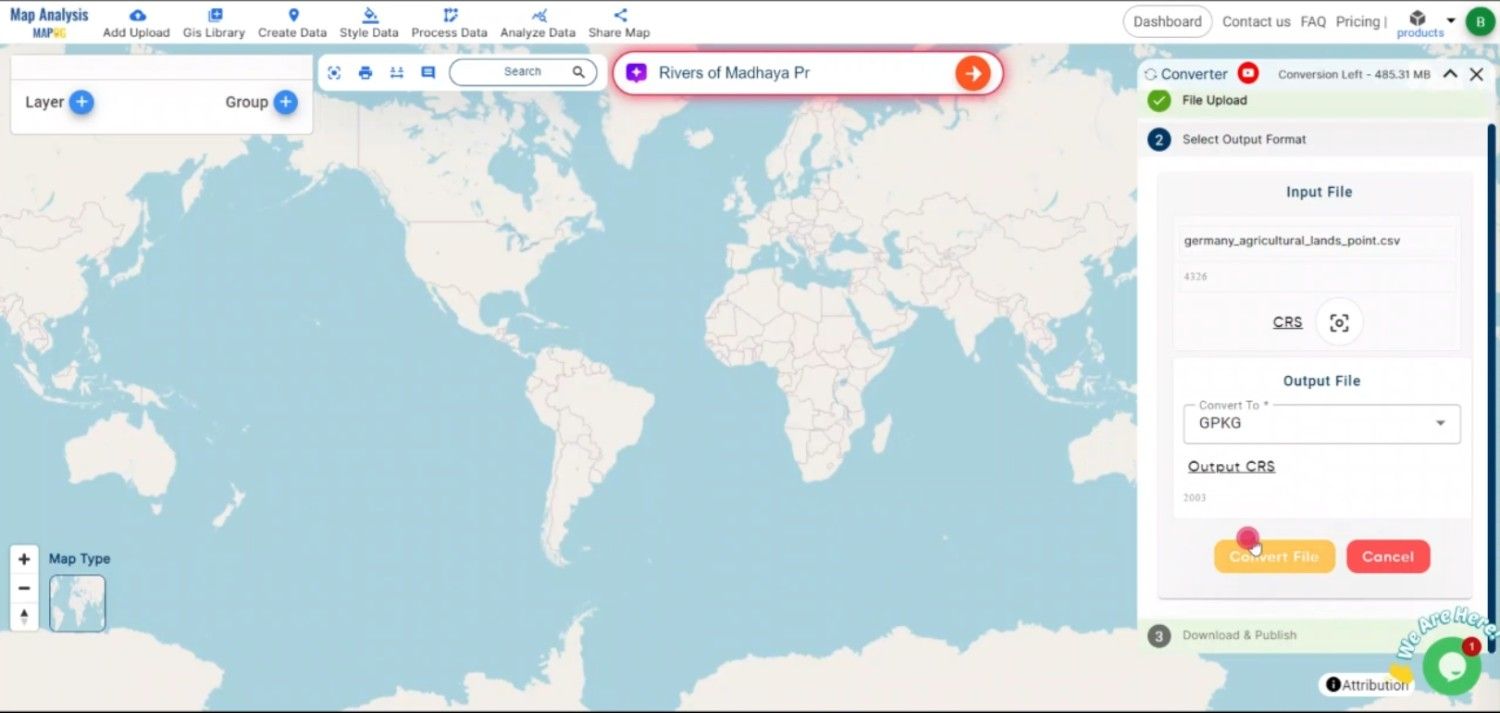
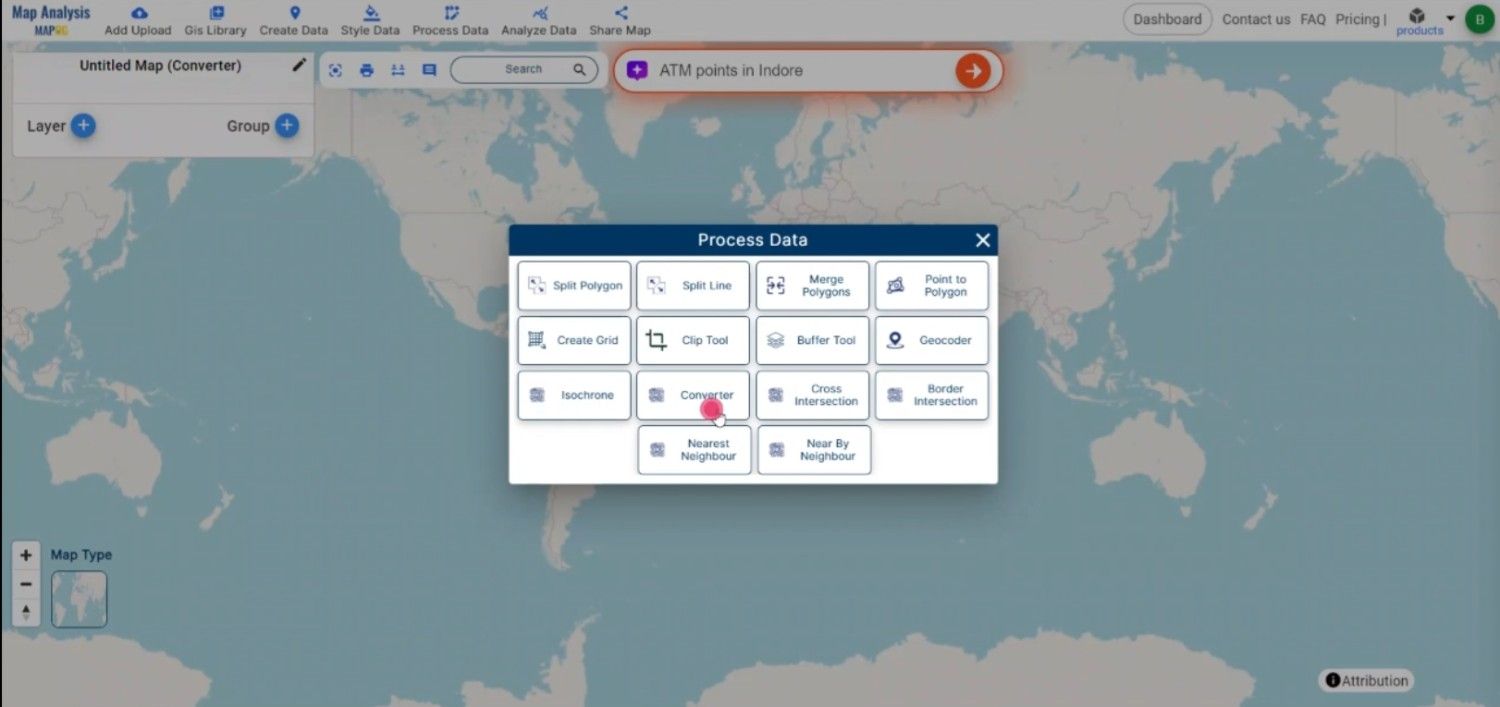
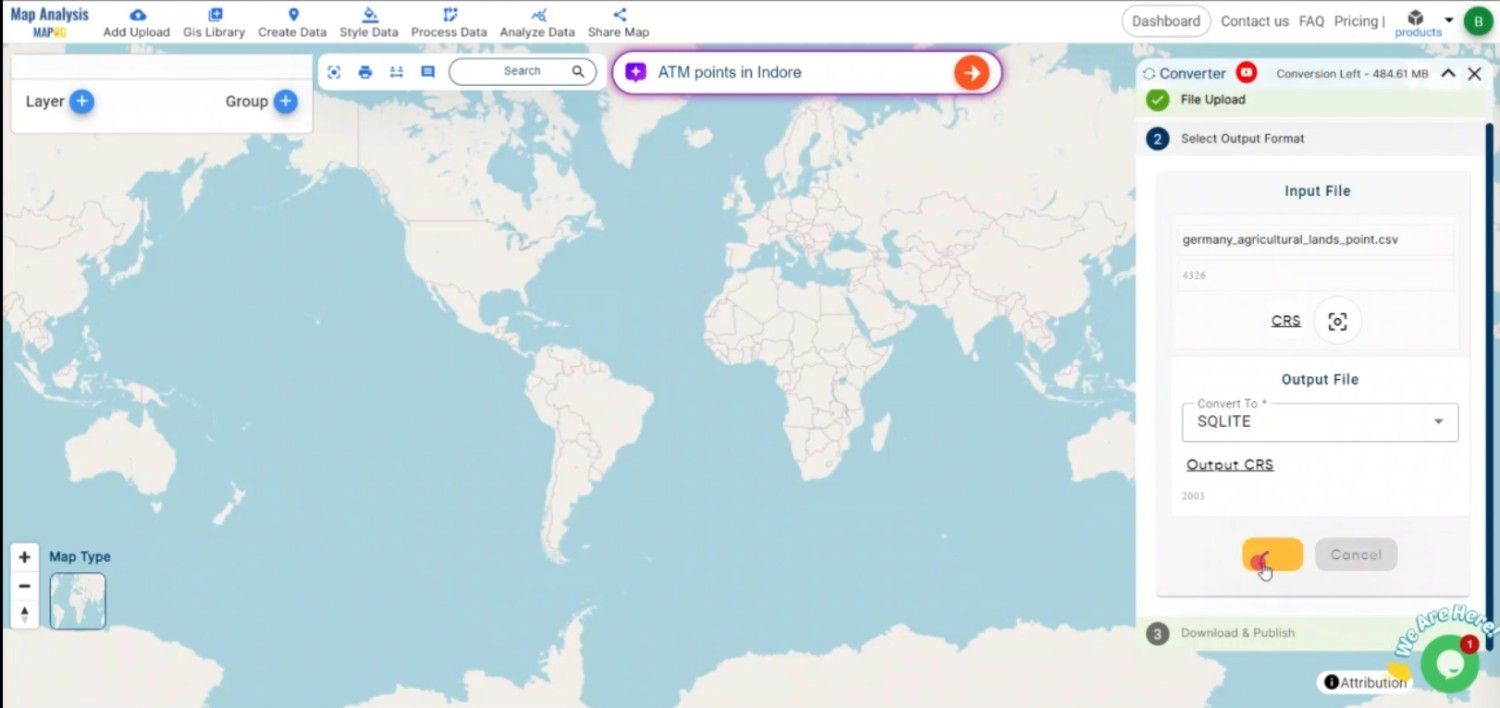
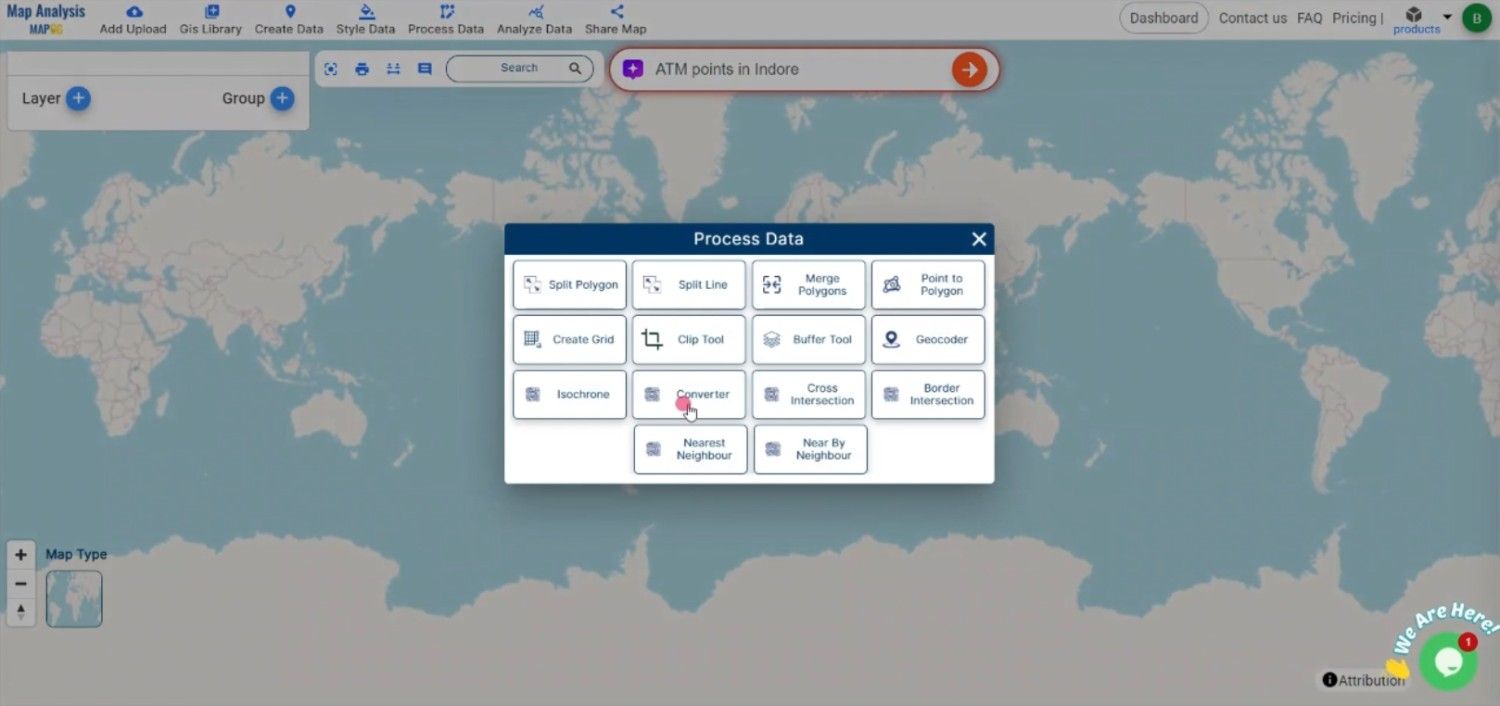
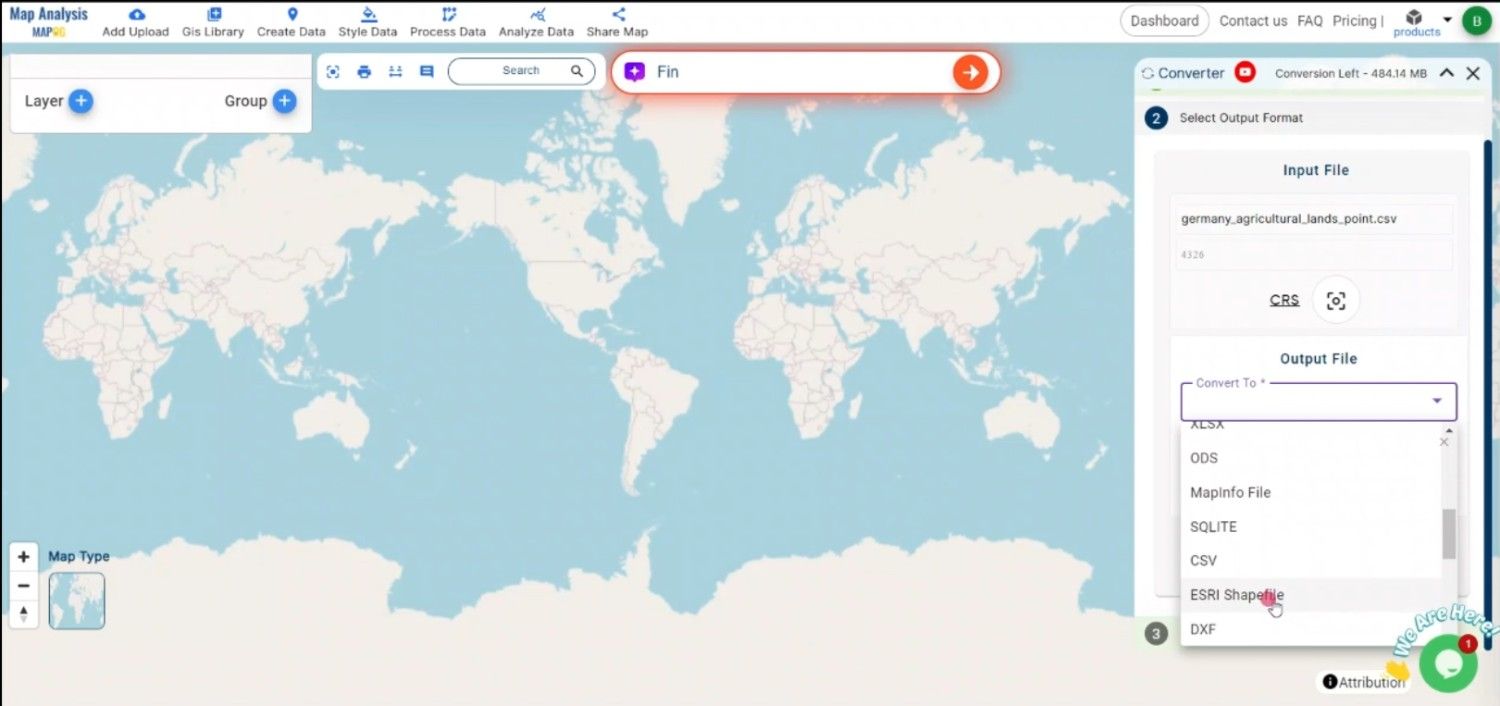
With MAPOG’s versatile toolkit, you can effortlessly upload vector and upload Excel or CSV data, incorporate existing layers, perform polyline splitting, use the converter for various formats, calculate isochrones, and utilize the Export Tool.
For any questions or further assistance, feel free to reach out to us at support@mapog.com. We’re here to help you make the most of your GIS data.
Download Shapefile for the following:
- World Countries Shapefile
- Australia
- Argentina
- Austria
- Belgium
- Brazil
- Canada
- Denmark
- Fiji
- Finland
- Germany
- Greece
- India
- Indonesia
- Ireland
- Italy
- Japan
- Kenya
- Lebanon
- Madagascar
- Malaysia
- Mexico
- Mongolia
- Netherlands
- New Zealand
- Nigeria
- Papua New Guinea
- Philippines
- Poland
- Russia
- Singapore
- South Africa
- South Korea
- Spain
- Switzerland
- Tunisia
- United Kingdom Shapefile
- United States of America
- Vietnam
- Croatia
- Chile
- Norway
- Maldives
- Bhutan
- Colombia
- Libya
- Comoros
- Hungary
- Laos
- Estonia
- Iraq
- Portugal
- Azerbaijan
- Macedonia
- Romania
- Peru
- Marshall Islands
- Slovenia
- Nauru
- Guatemala
- El Salvador
- Afghanistan
- Cyprus
- Syria
- Slovakia
- Luxembourg
- Jordan
- Armenia
- Haiti And Dominican Republic
- Malta
- Djibouti
- East Timor
- Micronesia
- Morocco
- Liberia
- Kosovo
- Isle Of Man
- Paraguay
- Tokelau
- Palau
- Ile De Clipperton
- Mauritius
- Equatorial Guinea
- Tonga
- Myanmar
- Thailand
- New Caledonia
- Niger
- Nicaragua
- Pakistan
- Nepal
- Seychelles
- Democratic Republic of the Congo
- China
- Kenya
- Kyrgyzstan
- Bosnia Herzegovina
- Burkina Faso
- Canary Island
- Togo
- Israel And Palestine
- Algeria
- Suriname
- Angola
- Cape Verde
- Liechtenstein
- Taiwan
- Turkmenistan
- Tuvalu
- Ivory Coast
- Moldova
- Somalia
- Belize
- Swaziland
- Solomon Islands
- North Korea
- Sao Tome And Principe
- Guyana
- Serbia
- Senegal And Gambia
- Faroe Islands
- Guernsey Jersey
- Monaco
- Tajikistan
- Pitcairn
Disclaimer : The GIS data provided for download in this article was initially sourced from OpenStreetMap (OSM) and further modified to enhance its usability. Please note that the original data is licensed under the Open Database License (ODbL) by the OpenStreetMap contributors. While modifications have been made to improve the data, any use, redistribution, or modification of this data must comply with the ODbL license terms. For more information on the ODbL, please visit OpenStreetMap’s License Page.