Convert GeoJSON to KML

In this article we would be discussing about conversion of GeoJSON data to KML (Keyhole Markup Language). This conversion is required when you are using software such Google earth to see the data. KML works great with Google earth. There is simple step to Convert GeoJSON to KML using ogr2ogr utility from GDAL library. Before that we must go through specification of GeoJSON and KML.

Here is the way to Convert the GeoJSON to KML online

Specification of GeoJSON – Convert GeoJSON to KML

Geojson data is open standard format, contains simple geographical feature with non-spatial data. In type element it has feature collection. That contains name, CRS (coordinate reference system) and features. These features can be line, point, polygon, Multi-Line string and multi-polygon.

Convert GeoJSON to KML

Specification of KML- Convert GeoJSON to KML

The KML (Keyhole Markup language) this data format contains information in tags. SimpleField contains attribute information with name and type. Style tag contains the style of file as color of lines, points and polygons. Geometry is stored as coordinates in file.

Convert GeoJSON to KML using GDAL Utility-

The conversion requires Gdal utility. This utility can be installed in the system by following the given commands.

By typing ogr2ogr in command prompt you can get the following result. This result shows the presence of ogr2ogr utility in system.

To know the version of installed GDAL library you can type,

–> gdalinfo –version

Before executing the conversion command, you should check the drivers. The drivers can be checked by typing

–> ogr2ogr –formats

in your command prompt. Now check for the GeoJSON and KML driver.

After checking the drivers you can execute the following command.

–> ogr2ogr -f ‘KML’ -a_srs EPSG:4326 Output_fileName.kml Input_FileName.geojson

Output of Convert GeoJSON to KML-

The generated output file can be open in editor to see the content.

In the similar way you can also convert shape file to MIF, shapefile to sql and shape file to excel file.

You can also comment in given comment box for any query, help or suggestions.

NetCDF Multidimensional data

NetCDF (network Common Data Form) is multidimensional data format only supports EPSG 4326 (WGS84). Multi dimensional simply means that it can grow in all direction with time. It has some important vocabulary to defines formation of NetCDF data structure. You may also look over HDF multidimensional Data, GRIB multidimensional data and all multidimensional data. To know about NetCDF you must go through this:

  1. Dimension
  2. Variables
  3. Coordinate Variables
  4. Attributes
  5. Conventions

Dimensions of NetCDF Multidimensional data:

NetCDF has dimensions from which only one dimension can be Unlimited that can grow up-to any length in any direction.  These dimensions can be physical quantities as latitude, longitude, altitude and time.

Variables:

Variable are array of values of same data type in NetCDF file. A variable has a name, data type, and shape described by its list of dimensions.

Coordinate Variables:

A one-dimensional variable with same name as a dimension is called coordinate variable. We can take an example from figure above float time(time). It is associated with a dimension and one or more data variables. Typically defines a physical coordinate corresponding to that dimension.

Attributes:

NetCDF attributes stores metadata of geographic data. Most attributes provide information about a specific variable. These attributes can be identified with structure variable name:attribute name.

Attribute as Long_name shows full name of given band and Unit shows is measurement unit.

Conventions:

The conventions define metadata that provide a description of the data in each variable and their spatial and temporal properties. A convention helps users of data from different sources decide which quantities are comparable. The convention name is available in global attribute in a netCDF file as shown below.

Details of NetCDF Multidimensional data:

To see all these you can use GDALinfo or ncdump command.

To use gdalinfo command for having netcdf information, you need to write

–> gdalinfo -json filename.nc

To use ncdump command for viewing information about NetCDF data, you need to write

–> ncdump filename.nc | more

If you face any problem in understanding NetCDF multidimensional data, please let us know via comments.


HDF MultiDimensional Data

Hierarchical Data Format HDF multidimensional data, which can grow in space and time dimension. It is specially designed by National Center for Supercomputing Applications (NCSA) for storing scientific data in mosaic datasets. You may also look over GRIB, netcdf and all multidimensional data.

Here the data is stored in hierarchical format i.e. in tree like structure. It contains band information in variables. Variables may have one or more variable. Each band data in this variables may differ in size and dimension. Also each data can contain information of different regions.


HDF 4 (Hierarchical data format release 4) – HDF MultiDimensional Data

HDF supports two formats, both are completely different and NOT compatible. It supports multidimensional arrays, raster images and table data. It has some limitations as it supports multiple (arrays, table and images) data hence makes complex API.

HDF 5 (Hierarchical data format release 5)- HDF MultiDimensional Data

This format is designed to overcome the limitations of HDF 4. This structure consist of datasets and groups.

  • Groups, which are container structures which can hold datasets
  • Datasets, which are multidimensional arrays of a homogeneous type.

Get information of HDF multidimensional data bands-

As data is arranged in hierarchical format, we need to run two command to get band details, both from GDAL utility.

1. Gdalinfo- This commands gives the information about number of  subdatasets present in file. Each sub-dataset detail is stored in SUBDATASET_n_NAME metadata item. The related description is stored in SUBDATASET_n_DESC metadata item.

2. Gdal_translate- The gdal_translate utility is used to import the bands or convert in desired format. Here we have converted HDF data in NetCDF format.

Hope this article help you to understand HDF data format. You can also visit multidimensional data for more information. Please let us know if you require any help, by commenting in given comment box.

GRIB Multidimensional Data

General Regularly-distributed Information in Binary GRIB multidimensional Data that can grow in space (Latitude, Longitude and altitude) and time. GRIB data is standardized by World Meteorological Organization (WMO). This contains various raster data in mosaic datasets.  This stores data from meteorological department and weather forecast. You may also look over NetCDF multidimensional data, HDF multidimensional data and all multidimensional data format.

GRIB Multidimensional Data versions

It has two versions GRIB1 and GRIB2.

  1. GRIB 1: This format is no longer used. It is recognized just because it is stilling using by World Area Forecast system of the ICAO. The CMC (Canadian Meteorological Center) will stop producing data in this format.
  2. GRIB 2: This is a great modernization of GRIB data format. It does not support and compatible for GRIB 1 version.

Get Details Of GRIB Multidimensional data

To get details of GRIB data we can use gdalinfo utility from GDAL library. This command helps us to see the sub datasets present in GRIB file with their description, bounding box etc.

To convert it in NetCDF format or any other format we can use gdal_translate command. Here with the help of gdal_translate options with can also assign SRS (Spatial reference system) of output file.

–> gdalwarp -overwrite -to SRC_METHOD=NO_GEOTRANSFORM -t_srs EPSG:4326 Input_GRIB.grb -of netCDF Output_NETCDF.nc

If you need any other information regarding multidimensional data such as NetCDF or HDF you can visit are tutorials and also comment in given comment box. We are always available for your help.

MultiDimensional Data – NetCDF, GRIB, HDF Format

In this article we are going to discuss about multidimensional data. The dataset comprises space (latitude ,longitude and altitude) and time. Here we can have temperature dataset as an example which spreads in all direction and increases/decreases with time.

Multi-Dimensional data comprised of multiple dataset for specific purpose. Data can be for Atmospheric, oceanographic and earth sciences purpose. These multidimensional data can capture using satellite and generated from numerical models where data is interpolated from other data sources.

In GIS, data formats such as NetCDF, HDF and GRIB are multidimensional data. Here we can store feature and raster data in these formats.

NetCDF Multidimensional data format

NetCDF (network Common Data Form) is a data format for storing multidimensional data. This data can be temperature, humidity, pressure, wind speed and direction in both vector and raster format. Each variables can displayed through a dimension in GIS with layers or table from the netCDF file.

NetCDF is a self-describing, machine-independent data formats that support the creation, access, and sharing of array-oriented scientific data. Currently, Network common data format (NetCDF) raster types support Climate and Forecast(CF) and Cooperative Ocean/Atmosphere Research Data Service (COARDS) conventions.

GRIB Multidimensional data format

GRIB (General Regularly-distributed Information in Binary) is a data format stores meteorological data and forecast weather data. The GRIB raster type allows two format GRIB 1 and GRIB 2. This also stores a large number of rasters with different dimensions in mosaic images.

HDF Multidimensional data format

HDF (Hierarchical Data Format) is a format designed by the National Center for Supercomputing Applications (NCSA) to store scientific data. The HDF raster type data format allows to add multiple raster data in HDF4 or HDF5 format in an image mosaic. Image mosaic is merge of two or more datasets.

Hope this article helped you to understand Multidimensional data. You can also read NetCDF, GRIB and HDF multidimensional data in detail. We also have converted all three data in geotiff and other format.

Feel free to comment for any help and suggestions.

Convert GeoJSON to Shapefile

In this article we are converting GeoJSON to Shapefile shp format. You might be thinking why would anyone convert GeoJSON in shapefile. Answer is very simple Shapefile is very popular data format with open specification for data interoperability among GIS (Geographical information system) softwares. Before moving towards conversion steps we must look for GeoJSON and Shape file in detail. There Specification is given below.

Here is the Online Converter Tool from GeoJSON To Shapefile

Specification of GeoJSON-

Geojson data is open standard format, contains simple geographical feature with non-spatial data. In type element it has feature collection. That contains name, CRS (coordinate reference system) and features. These features can be line, point, polygon, Multi-Line string and multi-polygon.

Convert GeoJSON to Shapefile

Specification of Shapefile-

Shapefile is very popular data format specially among open source GIS softwares. It has some mandatory files, which contains various information such as index of geometry, attribute data and projection information.

  1. shx- contains geometry index,
  2. shp- contains geometry,
  3. dbf- contains attribute data,
  4. prj- contains projection data.

Convert GeoJSON to Shapefile using MapOG Tool

Convert GeoJSON to Shapefile Shp Using Gdal Utility-

Conversion from geojson to shapefile requires GDAL library in your system. For downloading it you can follow given commands.

To check the availability of library can be check by typing ogr2ogr in command prompt. You can also check the version of GDAL library by typing gdalinfo –version.

To convert data from geojson to shapefile we must have format available in library. To check the formats available you can execute the following command,

–> ogr2ogr –formats

you will get the following list that contains the drivers list. Check for the GeoJSON and Shapefile driver.

Now you can execute the conversion command given below,

–>ogr2ogr -f ‘ESRI Shapefile’ -a_srs EPSG:4326 Output_fileName.shp Input_FileName.geojson

Here Command shows some options of ogr2ogr utility as -f, which shows output file format, -a_srs shows SRS (spatial reference system) assigned to output file. The Generated output file can be seen on QGIS software.

Converted Output GeoJSON to Shapefile In QGIS software-

In similar way you can also convert Shp to geojson, shp to KML or many more.

Feel free to contact for any help or suggestions by commenting in given comment box.

Leaflet FAQs – Leaflet Interview Questions

Leaflet is one of the most popular open-source JavaScript libraries for interactive maps. Simplicity, performance and usability are the major keys of the Leaflet. It create maps right from the R console or RStudio and Use map bounds and mouse events to drive Shiny logic. Leaflet allows developers without a GIS background to very easily display tiled web maps hosted on a public server, with optional tiled overlays. Here in this post we will check FAQs of Leaflet and Common Question asked during Interview Questions.

Leaflet Interview Questions – Frequently Asked Question Leaflet

Que. What is Leaflet?
Ans. Leaflet is the leading open-source JavaScript library for mobile-friendly interactive maps.

Que. Define marker.
Ans. Marker icons in Leaflet are Defined by L.Icon objects, which are passed as an option when creating markers.

Que. Define popup.
Ans. Popups are usually used when you want to attach some information to a particular object on a map.

Que. How to add layer on map?
Ans. using command addTo(map) or addLayer() .

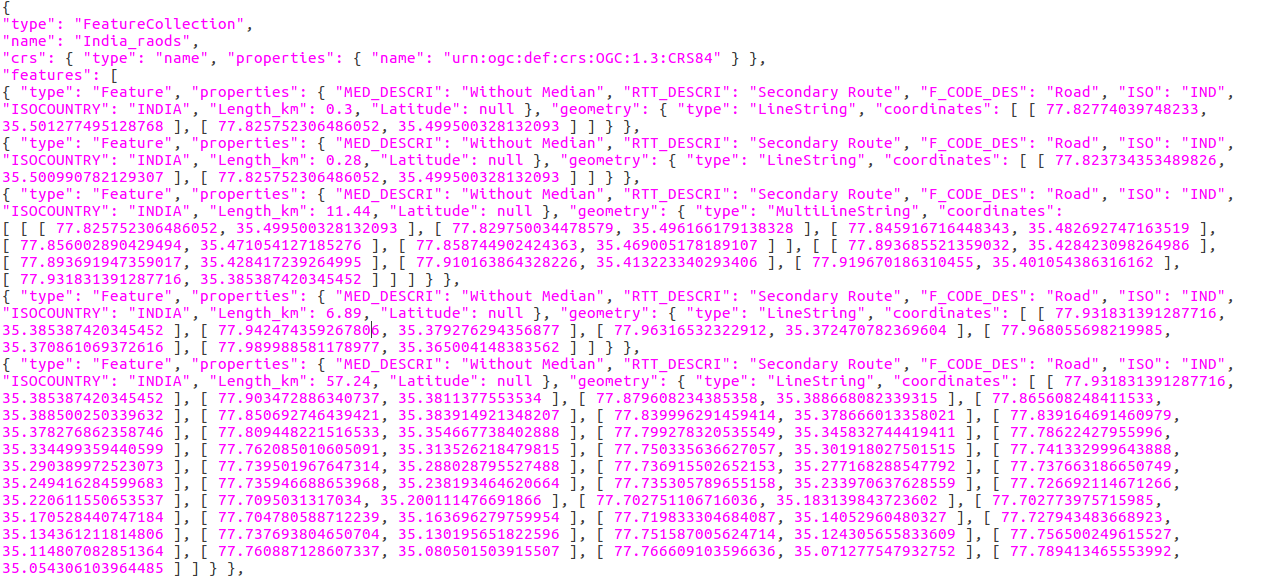
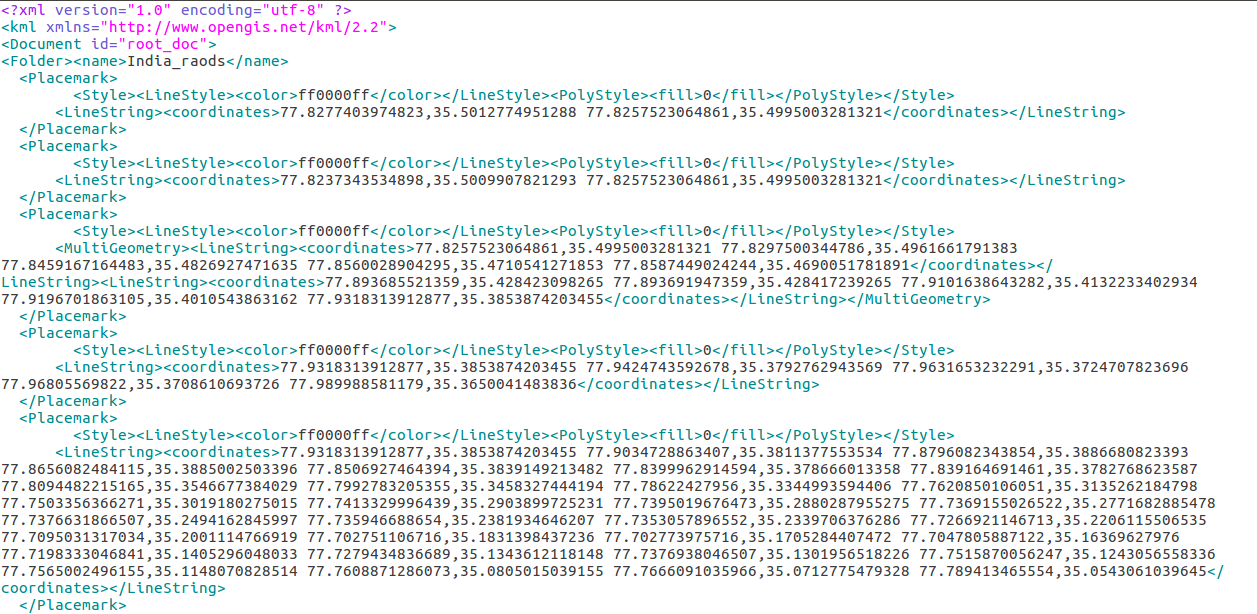
Que. What is GeoJSON data format?
Ans. GeoJSON is an open standard format designed for representing simple geographical features, along with their non-spatial attributes. It is based on JSON, the JavaScript Object Notation.

Que. What is topojson?
Ans. TopoJSON is an extension of GeoJSON that encodes topology. Rather than representing geometries discretely, geometries in TopoJSON files are stitched together from shared line segments called arcs.

Que. What is topology?
Ans. the study of geometrical properties and spatial relations unaffected by the continuous change of shape or size of figures.

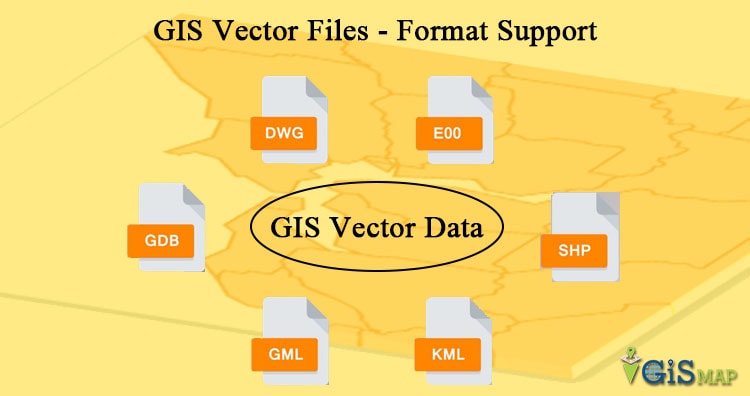
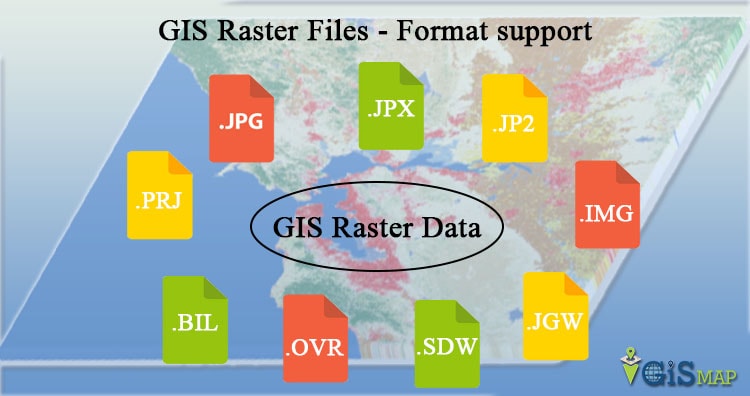
Que. list data formats.
Ans. vector and raster data format.

Que. What is tile layer?
Ans. A tile layer is a set of web-accessible tiles that reside on a server. L.tileLayer() is used to load and display tile layers on the map.

Que. What are the types of marker?
Ans. circle, polygon, point and there also Can be customized icons.

Que. Explain control in leaflet.
Ans. Leaflet has a nice little control that allows your users to control which layers they see on your map.
name control elements.
zoom, attribution, layers and scale.

Que. Explain layerGroup() in leaflet.
Ans. layerGroup() is used to group several layers and handle them as one. If you add it to the map, any layers added or removed from the group will be added/removed on the map as well.

Que. Explain layer control in leaflet.
Ans. layer control that allows your users to control which layers they see on your map.

Que. How Can you load geojson data in lealet?
Ans. using L.geoJSON() method, which accepts object in geojson format.

Que. How Can we convert layer into geojson.
Ans. Using toGeoJSON() method, which returns a GeoJSON representation of the layer group (as a GeoJSON FeatureCollection, GeometryCollection, or MultiPoint).

Que. Explain L.control.layers(baseMaps, overlayMaps).addTo(map);
Ans. The first argument passed when creating the layers control is the base layers object. The second argument is the overlays object.

Que. What is bound?
Ans. Represents a rectangular area in pixel coordinates.

Que. What do you mean by getSouthWest()?
Ans. Returns the south-west point of the bounds. Similarly we Can use getNorthEast(), getNorthWest() and getSouthEast() to get corner bounds.

Que. How Can you find width and height of screen?
Ans. width Can be obtain by subtracting bounds obtained from getNorthEast() and getNorthWest(). Similarly by subtracting getSouthWest() and etSouthEast() we Can have height.

Que. How you Can get current zoom level?
Ans. getZoom() Returns the current zoom level of the map view

Que. How can you get center coordinates of map view.
Ans. getCenter() Returns the geographical center of the map view

Que. How can you get current size of map view.
Ans. getSize() Returns the current size of the map container (in pixels).

Que. Initially How will you set the layer view on map?
Ans. setView If true, automatically sets the map view to the user location with respect to detection accuracy, or to world view if geolocation failed.

Que. How Can you fit the layer in map view?
Ans. fitBounds() Sets a map view that contains the given geographical bounds with the maximum zoom level possible.

Que. How Can you show layers coming from geoserver in leaflet?
Ans. L.tileLayer.wms() is to take data coming from geoserver in tile format

Que. Can you put not georeferenced image on map?
Ans. yes we Can.

Que. Can you georeferenced an image?
Ans. L.imageOverlay(imageUrl, imageBounds).addTo(map);

Que. What is event object?
Ans. Event object is an object that you receive as an argument in a listener function when some event is fired, containing useful information about that event.

Que. How can you get latitude longitude from map on click?
Ans. We can get the long-lat value by using:

map.on('click', function(e) {
  alert(e.latlng); // e is an event object (MouseEvent in this case)
  });

Que. What is option in leaflet?
Ans. options is a special property that unlike other objects that you pass to extend will be merged with the parent one instead of overriding it completely, which makes managing configuration of objects and default values.

Que. What is includes in leaflet?
Ans. Includes is a special class property that merges all specified objects into the class (such objects are called mixins).

Que. How Can you disable the double click zoom option?
Ans. map.doubleClickZoom.disable();

Que. What is attribution in map?
Ans. Attribution is the act of regarding a quality or feature as a characteristic or inherent part of someone or something. The act of attributing, especially the act of establishing a particular person as the creator of a work of art. You are free to copy, distribute, transmit and adapt our data, as long as you credit data provider and its contributors. 

Que. How Can you style geojson data in leaflet?
Ans. A Function defining the Path options for styling GeoJSON lines and polygons, called internally when data is added. The default value is to not override any defaults:

Que. What is choropleth map?
Ans. A choropleth map is a thematic map in which areas are shaded or patterned in proportion to the measurement of the statistical variable being displayed on the map, such as population density or per-capita income.

Que. What is onEachFeature()?
Ans. A Function that will be called once for each created Feature, after it has been created and styled. Useful for attaching events and popups to features.

Que. How Can you set opacity of layer?
Ans. setOpacity() method is used to set the opacity of each layer.

Que. What is z-index?
Ans. The z-index property specifies the stack order of an element. An element with greater stack order is always in front of an element with a lower stack order.

Que. How Can you set z-index of any layer in leaflet?
Ans. setZIndex() Calls setZIndex on every layer contained in this group, passing the z-index.

Que. What is renderer in leaflet?
Ans. Base class for vector renderer implementations (SVG, Canvas). Handles the DOM container of the renderer, its bounds, and its zoom animation. A Renderer works as an implicit layer group for all Paths – the renderer itself Can be added or removed to the map.

Que. What is a plugin?
Ans. A plugin is a software add-on that is installed onto a program, enabling it to perform additional features.

Que. Why do we use plugin?
Ans. To add new features in library.

I hope this Question answer might have helped you in understanding  Leaflet and in clearing the Basics interview questions of Leaflet. Let us know if you have any other list of questions answer available in Leaflet by commenting below in the space provided.

Maps FAQs – Maps Interview Questions

Maps shows a emphasizing relationships between elements of some space, such as objects, regions, or themes represented symbolically. Map is the shortened term referring to a two-dimensional representation of the surface of the world. Maps are most commonly used to depict geography, maps may represent any space, real or imagined, without regard to context or scale, such as in brain mapping, DNA mapping, or computer network topology mapping. Here in this post we will check FAQs of Map and Common Question asked during Interview Questions.

Maps Interview Questions – Frequently Asked Question Maps

Que. Define Map?
Ans. A map is a visual representation of an entire area or a part of an area, typically represented on a flat surface. The work of a map is to illustrate specific and detailed features of a particular area, most frequently used to illustrate geography.

Que. Explain importance of legends.
Ans. legend is included with a map to unlock it. It gives you the information needed for the map to make sense.

Que. Explain importance of north arrow.
Ans. A north arrow (sometimes also called a compass rose) is a figure displaying the main directions, North, South, East and West. On a map it is used to indicate the direction of North.

Que. Explain importance of scale.
Ans. Map scale refers to the relationship (or ratio) between distance on a map and the corresponding distance on the ground.

Que. Explain importance of title.
Ans. Map title is an element in a Map layout that describes the theme or subject of a map. The map title should instantly give the viewer a good idea of What the map is depicting.

Que. Explain map projection.
Ans. A map projection is a systematic transformation of the latitudes and longitudes of locations from the surface of a sphere or an ellipsoid into locations on a plane. Maps cannot be created without map projections.

Que. What is ortho image.
Ans. orthoimage is an aerial photograph or image geometrically corrected (“orthorectified”) such that the scale is uniform: the photo has the same lack of distortion as a map.
name few types of map.
Climatic map.
Physical map.
Political map.
Street map.
Relief map.
Thematic map.
Topographical map.

Que. What is map element.
Ans. Almost all maps must include certain basic elements that provide the reader with critical information. Among these are the title, scale, legend, body of the map, north arrow, cartographer, neatline, date of production, projection used, and information about sources.

Que. What is conical map?
Ans. A method of projecting maps of parts of the earth’s spherical surface on a surrounding cone, which is then flattened to a plane surface having concentric circles as parallels of latitude and radiating lines from the apex as meridians.

Que. What is map symbols?
Ans. A map is a smaller representation of an area on the earth’s surface; therefore, map symbols are used to represent real objects. Without symbols, maps would not be possible. Both shapes and colors can be used for symbols on maps.

Que. Define classes of map projection.
Ans. Albers Equal Area Conic, Equidistant Conic, Lambert Conformal Conic and Polyconic

Que. Explain 4 types of distortion in map.
Ans. There are four basic characteristics of a map that are distorted to some degree, depending on the map projection used. These characteristics include distance, direction, shape, and area.

Que. What is distorted map?
Ans. distortion on a map or image is the misrepresentation of shape, area, distance, or direction of or between geographic features when compared to their true measurements on the curved surface of the earth.

Que. What is DEM?
Ans. Digital Elevation Models (DEMs) are a type of raster GIS layer. Raster GISrepresents the world as a regular arrangement of locations. In a DEM, each cell has a value corresponding to its elevation.

Que. What is DTM?
Ans. A DTM is effectively a DEM that has been augmented by elements such as breaklines and observations other than the original data to correct for artifacts produced by using only the original data.

Que. What is DSM ?
Ans. A DSM is an elevation model that includes the tops of buildings, trees, powerlines, and any other objects. Commonly this is seen as a canopy model and only ‘sees’ ground where there is nothing else overtop of it.

Que. Explain contours?
Ans. a line on a map joining points of equal height above or below sea level.

Que. What is thematic map?
Ans. A thematic map is a map that emphasizes a particular theme or special topic suchas the average distribution of rainfall in an area. They are different from general reference maps because they do not just show natural features like rivers, cities, political subdivisions and highways.

Que. What is physical map?
Ans. A physical map focuses on the geography of the area and will often have shaded relief to show the mountains and valleys.

Que. What is route map?
Ans.  A road map or route map is a map that primarily displays roads and transport links rather than natural geographical information. It is a type of navigational map that commonly includes political boundaries and labels, making it also a type of political map.

Que. What is land cover?
Ans.  Land cover is the observed (bio)physical cover on the earth’s surface. It should be confined to describe vegetation and man-made features.

Que. What is land use?
Ans.  Land use involves the management and modification of natural environment or wilderness into built environment such as settlements and semi-natural habitats such as arable fields, pastures, and managed woods.

Que. What do you mean by land use map?
Ans.  Land use/land cover data are most commonly in a raster or grid data structure, with each cell having a value that corresponds to a certain classification. Land Use and Land Cover (LULC) The Land Use and Land Cover (LULC) data files describe the vegetation, water, natural surface, and cultural features on the land surface.

Que. Name few land use map.
Ans.  Residential Land Use, Transportation Land Use, Commercial Land Use, Industrial Land Use, Institutional and Public Buildings and Open space and recreational land

Que. What is resolution?
Ans. In computers, resolution is the number of pixels (individual points of color) contained on a display monitor, expressed in terms of the number of pixels on the horizontal axis and the number on the vertical axis. The sharpness of the image on a display depends on the resolution and the size of the monitor. 

Que. What is locator map?
Ans. A locator map, sometimes referred to simply as a locator, is typically a simple map used in cartography to show the location of a particular geographic area within its larger and presumably more familiar context.

I hope this Question answer might have helped you in understanding Maps and in clearing the Basics interview questions of Maps. Let us know if you have any other list of questions answer available in Maps by commenting below in the space provided.

Vector Data file formats list in GIS

In GIS, we require some data formats to express the geographical features, which mainly are of two types Raster and Vector data formats. These data sources also has multiple file formats in them which are often used to express the geographical features. In this post we are looking forward to see the List of Vector Data file formats in GIS. Vector considers the geographical features as geometrical shape and express them by different types of geometry.

List of Vector Data file formats in GIS

You can also have a look at Raster data source in my previous post Raster data file format lists in GIS. Vector Data is mainly split into three types of geometry according to the geographical features :

  • Points:

    Zero-dimensional points data is most commonly used to represent nonadjacent features and geographical features that can be expressed by single point and to represent discrete data points. Points have zero dimensions, therefore you can measure neither length or area with this dataset. Examples would be schools, points of interest, wells, peaks. Points features are also used to represent areas when displayed at a small scale and abstract points. For instance, point locations could represent city locations or place names. Measurement is not possible by using point data.

  • Line:

    Line (or arc) or Polyline data is used to represent linear features. Common examples would be rivers, railroads, trails, streets and topographic lines. Liner features are displayed at a small scale and it only have one dimension and therefore can only be used to measure length.  Line features have a starting and ending point. Common examples would be road center-lines and hydrology. Line features can measure distance.

  • Polygon:

    Two-dimensional polygons are used to represent areas such as the boundary of a city (on a large scale map), lake, or forest.  Polygon features are two dimensional and therefore can be used to measure the particular area and perimeter of a geographic feature. Polygon features are most commonly distinguished using either a thematic mapping symbology (color schemes), patterns, or in the case of numeric gradation, a color gradation scheme could be used. Polygons convey the most amount of information of the file types. Polygon features can measure perimeter and area.

Both line and point feature data represent polygon data at a much smaller scale and Each of these geometries are linked to a row in a database that describes their attributes. They help reduce clutter by simplifying data locations. As the features are zoomed in, the point location of a auditorium is more realistically represented by a series of building footprints showing the physical location of the campus. Different geometries can also be compared.

Now let us see the List of Vector Data file formats in GIS :

  • Shapefiles

    The Shapefile format is a popular geospatial vector data format for geographic information system (GIS) software for storing the location, shape, and attributes of geographic features. It is developed and regulated by Esri as a (mostly) open specification for data interoperability among Esri and other GIS software products.
    A Shapefile is stored in a set of related files and contains one feature class. The Shapefile is BY FAR the most common geospatial file type you’ll encounter. It’s become the industry standard. you’ll need a complete set of files that are mandatory to make up a Shapefile.

    The required files are –
    .shp is a mandatory Esri file that gives features their geometry. Every Shapefile has its own .shp file that represent spatial vector data. For example, it could be points, lines and polygons in a map.

    .shx are mandatory Esri and AutoCAD shape index position. This type of file is used to search forward and backwards.

    .dbf is a standard database file used to store attribute data and object IDs. A .dbf file is mandatory for shape files. You can open .DBF files in Microsoft Access or Excel.

    .prj is an optional file that contains the metadata associated with the shapefiles coordinate and projection system. If this file does not exist, you will get the error “unknown coordinate system”. If you want to fix this error, you have to use the “define projection” tool Which generates .prj files.

    .xml file types contains the metadata associated with the shapefile. If you delete this file, you essentially delete your metadata. You can open and edit this optional file type (.xml) in any text editor.

    .sbn is an optional spatial index file that optimizes spatial queries. This file type is saved together with a .sbx file. These two files make up a shape index to speed up spatial queries.

    .sbx are similar to .sbn files in Which they speed up loading times. It works with .sbn files to optimize spatial queries. We tested .sbn and .sbx extensions and found that there were faster load times When these files existed. It was 6 seconds faster (27.3 sec versus 33.3 sec) compared with/without .sbn and .sbx files.

    .cpg are optional plain text files that describes the encoding applied to create the Shapefile. If your Shapefile doesn’t have a cpg file, then it has the system default encoding.

  • ArcInfo Coverage

    This is a data model for storing geographic features using ArcInfo software. A coverage stores a set of thematically associated data considered to be a unit. The ArcInfo coverage GIS format is a georelational data model that stores vector data. It has no extension, just a set of folders. Coverages use feature classes, stored as points, arcs, polygons or annotation. Feature attributes are stored in the ArcInfo Coverage’s .adf or INFOb files. It is stored as a directory. Each feature is identified with a unique number. These feature numbers are a way to link attribute data with each spatial feature.

  • E00 ArcInfo Interchange

    This file format intended to support the transfer between ESRI systems of different types of geospatial data used in ESRI software. This GIS format is used to conveniently exchange GIS coverage files. It has the extension E00 and increases incrementally (E01, E02…) with individual coverage files. Export functions in ESRI software assemble all the data and definition files relevant to a particular coverage, grid, or TIN (triangulated irregular network) into a single logical file.
    Although convenient for interchange, you need to process the data before you can add it to ArcGIS. Run the ‘Import from E00’ in the Conversion ArcToolbox in order to access the data.

  • Spatial Database engine (ArcSDE)

    ArcSDE serves data in a centralized way over an entire organization using a relational database management system. GIS users can seamlessly access spatial data using Esri ArcMap, ArcEditor, ArcInfo and other products.
    ArcSDE facilitates versioned editing with multiple users over the same network. Users can easily publish to the web. ArcSDE geodatabases with several DBMS storage models including Oracle, Microsoft SQL Server, IBM DB2, IBM Informix and PostgreSQL.

  • Digital Line Graph (DLG)

    DLGs are topologically structured for use in mapping and GIS applications. DLGs are distributed by the government, and its features are in separate files that most GIS packages will import, although extra data manipulation is often necessary. DLG is a cartographic map feature represented in USGS digital vector form. DLGs consist of line work with the contours removed, therefore elevation is not available. DLGs comes with optional and SDTS formats.

  • GeoJSON

    GeoJSON is a lightweight format based on JSON, used by many open source GIS packages. GeoJSON’s feature includes Points, line strings, polygons and multipart collection of these types. therefore it represents addresses, locations, streets, highways, countries, tracts of lands and many like this. GeoJSON features doesn’t only represent physical world but mobile routing and navigation apps also describe their service coverage using GeoJSON.

  • AutoCAD DXF

    AutoCAD Drawing Interchange File (DXF) is an exchange format for content of AutoCAD Drawing Files (DWG). The DXF format specification is maintained and has been openly published by AutoDesk. DXF coordinates are always without dimensions so that the reader or user needs to know the drawing unit or has to extract it from the textual comments in the sheets.  It does not have topology, but offers good detail on drawings, line widths and styles, colors, and text. DXF is typically constructed in 64 layers. Each layer consists of different features; allowing the user to separate features.

  • Keyhole Markup Language (KML)

    This GIS format is XML-based and is primarily used for Google Earth. KML was developed by Keyhole Inc which was later acquired by Google. KML is an XML notation for expressing geographic annotation and visualization within two-dimensional maps and three-dimensional browsers.
    KML has its own zipped version KMZ (KML-Zipped) which replaced KML and now is the default Google Earth geospatial format because it is much compressed version. KML is an international standard of OGC. KML specifies an interesting set of feature like place marks, image, polygons, textual description and many for displaying in many geospatial software. KML comes with an extension .kmz .

  • TIGER

    TIGER stands for Topologically Integrated Geographic Encoding and Referencing. TIGER is a vector data format used by the USCB to describe land attributes such as buildings, roads, lakes and such areas like census tracts. GIS can be used to merge census demographics with the TIGER files to create map and conduct analysis. It includes geocoded block faces with address ranges of street numbers. This means than that they include topology and can address match. The maps are a combination of DLG and DBF/DIME files.

  • Vector Product Format (VPF)

    Vector Product Format (VPF) is a military standard for vector-based digital map products produced by the U.S.DOD. It has been adopted as part of the Digital Geographic Exchange Standard (DIGEST) in the form of Vector Relational Format (VRF), so VPF can be considered to be an international standard as well.

  • Esri TIN

    Triangular irregular networks (TIN) are a digital means to represent surface morphology. This format can spatially describe elevation information including breaking edge features. TINs are a form of vector-based digital geographic data and are constructed by triangulating a set of vertices (points). The vertices are connected with a series of edges to form a network of triangles. Each points and triangle can carry a tag information. A TIN stored in this file format can have any shape, cover multiple regions (e.g. islands) and contain holes (e.g. lakes).

  • Geography Markup Language (GML)

    The Geography Markup Language (GML) is an XML grammar defined by OGC for expressing geographical features. The GML specification defines (a) a language for expressing application schemas for feature types and (b) predefined properties and schemas commonly required to describe geographical features, such as polygons, curves, points, coordinate reference systems, units of measure, observations, coverages, etc. GML serves as a language for geographic systems as well as an open interchange format for geographic transactions.
    GML has the ability to integrate all forms of geographic information, including not only conventional “vector” or discrete objects, but coverages and sensor data.

  • SpatiaLite

    SpatiaLite is an open source library intended to extend the SQLite core to support fully fledged Spatial SQL capabilities. It is similar to PostGIS, Oracle Spatial, and SQL Server with spatial extensions, although SQLite/SpatiaLite aren’t based on client-server architecture: they adopt a simpler personal architecture. SpatiaLite is smoothly integrated into SQLite to provide a complete and powerful Spatial DBMS (mostly OGC-SFS compliant). It isn’t necessary to use SpatiaLite to manage spatial data in SQLite, which has its own implementation of R-tree indexes and geometry types. But SpatiaLite is needed for advanced spatial queries and to support multiple map projections.

  • OSM (OpenStreetMap)

    OpenStreetMap is the largest crowdsourcing GIS data project of the planet Earth.
    The GIS format .OSM is OpenStreetMap’s XML-based file format. The more efficient, smaller PBF Format (“Protocolbuffer Binary Format”) is an alternative to the XML-based format.
    The data interoperability in QGIS can load native .OSM files. The OpenStreetMap plugin can convert PBF to OSM, which then can be used in QGIS.

  • Scalable Vector Graphics

    An SVG is an image that is an extension of the XML language. Any program that recognizes XML can display the SVG image. The scalable part of the term emphasizes that you can zoom- in on an image and not lose resolution. SVG files also have the advantages of being smaller, and arriving faster, than conventional image files such as GIF, PDF, and JPEG.

  • National Transfer Format (NTF)

    It is now the standard transfer format for Ordnance Survey digital data. It is designed for the transfer of spatial information.

  • SOSI

    SOSI is stands for Samordnet Opplegg for Stedfestet Informasjon
    (Coordinated Approach for Spatial Information). It is a spatial data format used for all public exchange of spatial data in Norway. It includes standardized definitions for geometry and topology, data quality, coordinate systems, attributes and metadata.

  • MapInfo TAB format

    The MapInfo TAB format is a popular data format for GIS software. It is developed and regulated by MapInfo Corporation as a proprietary format. MapInfo Professional data set should relate to the two basic environments for working in MapInfo; “Browser View” and “Mapper View” as a basic file component. This environment provides storage of attribute or object data and is represented like a spreadsheet. In this simplified scenario, no geographic information is available. And the minimum files required for the basic MapInfo environment are .TAB and .DAT .

Raster data file format lists in GIS

This post will describe you about the Raster data file format lists in GIS. In Geographical information system there are only two methods which are used to store data for both kinds of mapping references i.e Raster and Vector Data GIS files. And in this post we are going to talk about the various Raster data file formats in GIS.  Raster data is  very useful for analysis. Raster data represents the world as a surface divided into regular grid of cells.

Raster data models are useful for storing data that varies continuously, as in an aerial photograph, a satellite image or an elevation surface. There are two types of raster data: continuous and discrete. Raster stores the data in the type of digital image represented by reducible and enlargeable grids and these grid of cells contains a value representing information, such as temperature, discrete data represents features such as land-use or soils data.

Raster data provides a matrix of cells with values representing a coordinate and sometimes linked to an attribute table and it is much simpler for many layers combinations. Raster data is very easy to modify or program due to simple data structure.

Now coming to the main question how many file formats does Raster data have?  and here we  are going to look for the answer as Raster data file format lists in GIS showing all the data format lists.

Popular Raster data file format lists in GIS

    • Portable Network Graphics (PNG)

      Provides a well-compressed, lossless compression for raster files. It supports a large range of bit depths from monochrome to 64-bit color. Its features include indexed color images of up to 256 colors and effective 100 percent lossless images of up to 16 bits per pixel.

      Single file—extension *.png
    • Joint Photographic Experts Group (JPEG2000)

      Open-source raster format. A compressed format, allows both lossy and lossless compression. JPEG 2000 is a non-proprietary image compression format based on ISO standards, and typically uses .jp2 as the file extension. It’s advantages are that it offers lossy and lossless compression, and world files (.j2w) can be used to georeference an image in GIS software. Compression ratios are similar to MrSID and ECW formats.

      Single file—extension *.jp2, *.j2c, *.j2k, or *.jpx
    • JPEG File Interchange Format (JFIF)

      A standard compression technique for storing full-color and grayscale images. Support for JPEG compression is provided through the JFIF file format.

      Single file—extension *.jpg, *.jpeg, *.jpc, or *.jpe
      World file—extension *.jgw

      ArcCatalog only recognizes the .jpg file extension by default. To add .jpeg or .jpe files to ArcMap without renaming them, add those file extensions to ArcCatalog or drag those files from Windows Explorer into your map.

    • Multi-resolution Seamless Image Database (MrSID)

      Multi-Resolution Seamless Image Database (by Lizardtech). A compressed wavelet format, allows both lossy and lossless compression. MrSID is a proprietary format of LizardTech’s GeoExpress software for imagery compression, and is commonly used on orthoimages. The MrSID file extension is .sid. A companion file with a .sdw extension and the same prefix name as the .sid is used as a world file for georeferencing a MrSID image.
      Most greyscale TIFF images are compressed with MrSID to 10:1 or 15:1. Color images are usually compressed to 30:1 or 40:1. GeoExpress is also commonly used to create image mosaics.
      Most recent GIS software, including ArcGIS, are able to read MrSID compressed images without any additional extensions. ArcView 3.x, however, requires a MrSID Extension for image access. Plugins for other software, such as AutoCAD and Photoshop, may or may not be required.
      Supports generations 2, 3, and 4.

      Single file—extension *.sid
      World file—extension *.sdw
    • Network Common Data Form (netCDF)

      netCDF file format with CF medata conventions for earth science data. Binary storage in open format with optional compression. Allows for direct web-access of subsets/aggregations of maps through OpeNDAP protocol.
      It is the machine-independent data formats that support the creation, access, and sharing of array-oriented scientific data.
      The netCDF libraries support multiple different binary formats for netCDF files:

      • The classic format was used in the first netCDF release, and is still the default format for file creation.
      • The 64-bit offset format was introduced in version 3.6.0, and it supports larger variable and file sizes.
      • The netCDF-4/HDF5 format was introduced in version 4.0; it is the HDF5 data format, with some restrictions.
      • The HDF4 SD format is supported for read-only access.
      • The CDF5 format is supported, in coordination with the parallel- netcdf project.
    • Digital raster graphic(DRG)

      Digital Raster Graphic is a raster file format. From scanning a paper USGS topographic map for use on a computer a digital image is created called DRGs. The DRGs which are created by USGS are typically scanned at 250 dpi and then the DRGs are saved as a TIFF file in the server. The Raster data image usually includes the original border information, referred to as the “map collar”. The raster map file is projected by UTM and georeferenced to the surface of the earth.

      • ARC Digitized Raster Graphic (ADRG)

        ARC Digitized Raster Graphics is a standard National Imagery and Mapping Agency (NIMA) digital product. ADRG is designed to support applications that require a raster map background display.
        ADRGs are the digitized maps and transformed charts and The intended exchange medium for ADRG is a compact disk (CD-ROM)
        The ADRG’s charts transformed into a specific georegistration framework and acccomplnied by ASCII encoded support files. ADRG is geographically referenced using the equal arc-second raster chart/map (ARC) system in which the globe is divided into 18 latitudinal bands, or zones. The data consists of raster images and other graphics generated by scanning source documents.

        Multiple files
        Data file—extension *.img or *.ovr
        Legend file—extension *.lgg
      • Enhanced Compressed ARC Raster Graphics (ECRG)

        Enhanced Compressed ARC Raster Graphics (ECRG) file is an Enhanced Compressed ARC Raster Graphics. ECRG is geographically referenced using the ARC system in which the globe is divided into 18 latitudinal bands, or zones. ECRG uses JPEG 2000 compression.
        Distributed by the NGA. CADRG/ECRG is geographically referenced using the ARC system. The data consists of raster images and other graphics generated by scanning source documents. CADRG achieves a nominal compression ratio of 55:1. ECRG uses JPEG 2000 compression using a compression ratio of 20:1

      • Compressed ARC Digitized Raster Graphics (CADRG)

        CADRG is a comprising computer-readable digital map and chart images. they are also the file formats of Raster data. CADRG files are usually physically formatted within a National Imagery Transmission Format (NITF) message. It supports various weapons, C3I theater battle management, mission planning, and digital moving map systems. CADRG data is derived directly from ADRG and other digital sources through downsampling, filtering, compression, and reformatting to the Raster Product Format (RPF) Standard.The CADRG Reader can read CADRG files with or without the NITF message wrapper. The CADRG Writer can create CADRG datasets with or without the NITF message wrapper.

        CADRG achieves a nominal compression ratio of 55:1. ECRG uses JPEG 2000 compression using a compression ratio of 20:1

        File extension is based on specific product. You can specify 	which products you want ArcGIS to recognize (Customize > ArcMap Options > Raster > File Formats).
    • Raster Product Format (RPF)

      Raster Product Format, military file format specified in MIL-STD-2411. RPF is a standard data structure developed in 1994 as a U.S. Military Standard for geospatial databases. RPF’s database is composed of rectangular arrays of pixel values (e.g. in digitized maps or images) in compressed or uncompressed form.
      It was designed as a adaptable format to encompass raster data products in compressed or uncompressed form. The intent was to enable application software to use the data in RPF format on computer readable interchange media (e.g. CD-ROM) directly without further manipulations or transformation.
      The underlying format of CADRG and CIB.
      Single file—no standard file extension

      1. Compressed ADRG – Compressed ADRG, developed by NGA, nominal compression of 55:1 over ADRG (type of Raster Product Format)
      2. CIB – Controlled Image Base, developed by NGA (type of Raster Product Format)

    • Binary file

      An unformatted file consisting of raster data written in one of several data types, where multiple band are stored in BSQ (band sequential), BIP (band interleaved by pixel) or BIL (band interleaved by line). Georeferencing and other metadata are stored one or more sidecar files.
      The Binary Terrain format was created by the Virtual Terrain Project (VTP) to store elevation data in a more flexible file format. The BT format is flexible in terms of file size and spatial reference system.

      Single file—extension *.bt
      Projection file—extension *.prj
      • Band Interleaved by Pixel (BIP), Band Interleaved by Line (BIL), Band Sequential (BSQ)
        This format provides a method for reading and displaying decompressed, BIL, BIP, and BSQ image data. By creating an ASCII description file that describes the layout of the image data, black-and- white, grayscale, pseudo color, and multiband image data can be displayed without translation into a proprietary format.
        BIP and BIL are formats produced by remote sensing systems. The primary difference among them is the technique used to store brightness values captured simultaneously in each of several colors or spectral bands.
        Multiple files
        Data file—extension *.bil, *.bip, or *.bsq
        Header file—extension *.hdr
        Color map file—extension *.clr
        Statistics file—extension *.stx
    • Enhanced Compressed Wavelet (ECW)

      A compressed wavelet format, often lossy. ECW is a proprietary format of ERMapper for imagery compression. It is a more recent format than MrSID, but is gaining popularity because of free compression utilities available from ER Mapper’s website. ECW is a propriatary format. It is a wavelet-based, lossy compression, similar to JPEG 2000.
      It is a proprietary wavelet compression image format optimized for aerial and satellite imagery.
      This format can be used for Desktop, but when publishing, you require the ECW for ArcGIS for Server extension license.

      Single file—extension *.ecw

      ESRI grid – proprietary binary and metadataless ASCII raster formats used by Esri. A proprietary Esriformat that supports 32-bit integer and 32-bit floating-point raster grids. Grids are useful for representing geographic phenomena that vary continuously over space and for performing spatial modeling and analysis of flows, trends, and surfaces such as hydrology.

      color map file—extension *.cl
    • Extensible N-Dimensional Data Format(NDF)

      Format used for storing data representing n-dimensional arrays of numbers, such as images. Uses container files (directories containing files and directories) to manage the data objects.

      Directory—extension *.sdf
    • GDAL Virtual Format (VRT)

      This is a file format created by the Geospatial Data Abstraction Library (GDAL). It allows a virtual dataset to be derived from other datasets that GDAL can read.

      Single file—extension *.vrt
    • Tagged Image File Formats (TIFF)

      This format is associated with scanners. It saves the scanned images and reads them. TIFF can use run length and other image compression schemes. It is not limited to 256 colors like a GIF. Widespread use in the desktop publishing world. It serves as an interface to several scanners and graphic arts packages. TIFF supports black-and-white, grayscale, pseudo color, and true color images, all of which can be stored in a compressed or decompressed format.
      BigTIFF is supported.

      Single file — possible file extensions *.tif, *.tiff, and 	*.tff
      World file — extension *.tfw

      ArcCatalog only recognizes the .tif file extension by default. To add .tiff or .tff files to ArcMap without renaming them, add those file extensions to ArcCatalog or drag those files from Windows Explorer into your map.

    • Geo Tagged Image File Formats (GeoTIFF)

      TIFF variant enriched with GIS relevant metadata, As part of a header in a TIFF format it puts Lat/Long at the edges of the pixels. GeoTIFF driver supports reading, creation and update of internal overviews. Internal overviews can be created on GeoTIFF files opened in update mode (with gdaladdo for instance). If the GeoTIFF file is opened as read only, the creation of overviews will be done in an external .ovr file. Overview are only updated on request with the BuildOverviews() method. The GeoTIFF format is fully compliant with TIFF 6.0, so software incapable of reading and interpreting the specialized metadata will still be able to open a GeoTIFF format file.

    • Graphic Interchange Format (GIF)

      Graphic Interchange Format. A file format for image files, commonly used on the Internet. It is well-suited for images with sharp edges and relatively few gradations of color. A bitmap image format generally used for small images.

      Single file—extension *.gif
      World file—extension *.gfw
    • Digital Elevation Model (DEM)

      The representation of continuous elevation values over a topographic surface by a regular array of z-values, referenced to a common vertical datum. DEM is sometimes used as a generic term for DSMs and DTMs, only when DEM representing height information without any further definition about the surface.
      A DEM can be represented as a raster data(a grid of squares, also known as a heightmap when representing elevation) or as a vector-based triangular irregular network (TIN). When you look at a Digital Elevation Model (DEM) on a map, you don’t see a cell matrix. Instead, you see a layer symbolized by a color ramp.

      • Digital Elevation Models or DEM have two types of displays
        The first is 30-meter elevation data from 1:24,000 seven-and-a-half minute quadrangle map. The second is the 1:250,000 3 arc-second digital terrain data. DEMs are produced by the National Mapping Division of USGS.
      • Spatial Data Transfer Standard (SDTS)  digital elevation model (DEM)
        The Spatial Data Transfer Standard (SDTS) was created by the USGS. The purpose of this format was to transfer digital geospatial data between various computer systems in a compatible format that would not lose any information.
        Multiple files—extension *.ddf

        The actual elevation file that ArcGIS reads is named *CATD.DDF.

      • United States Geological Survey (USGS) digital elevation model (DEM)
        This format consists of a raster grid of regularly spaced elevation values derived from the USGS topographic map series. In their native format, they are written as ANSI-standard ASCII characters in fixed-block format.
        Single file—extension *.dem (need to change .dat extension to .dem)
    • RS Landsat

      Landsat satellite imagery and BIL information are used in RS Landsat.  In one format, using BIL, pixel values from each band are pulled out and combined. Programs that use this kind of information include IDRISI, GRASS, and MapFactory. It is fairly easy to exchange information from within these raster formats.

    • ArcInfo Grid

      An ArcInfo Grid does not have an individual file extension. Instead it is composed of two folders within a “workspace” which each contain multiple files. One of the two folders carries the name of the grid, and contains a number of various .adf files. The other folder is an “info” folder, which typically contains .dat and .nit files for all the coverages and grids in the workspace. The best way to manage (copy, move, delete, rename) ArcInfo Grids is with ArcCatalog or ArcInfo Workstation (command line).

    • Airborne Synthetic Aperture Radar (AIRSAR) Polarimetric

      AIRSAR is an instrument designed and managed by NASA’s Jet Propulsion Laboratory (JPL). ArcGIS supports the polarimetric AIRSAR data (POLSAR).

      Multiple files with an L, C, or P in the file name followed 	by .dat. For example: mission_l.dat (L-Band) and 	mission_c.dat (C-Band).


  • Bitmap (BMP), device-independent bitmap (DIB) format, or Microsoft Windows bitmap

    BMP files are Windows bitmap images. They are usually used to store pictures or clip art that can be moved between different applications on Windows platforms.

    Single file—extension *.bmp
    World file—extension *.bpw
  • BSB

    This is a compressed raster format used in the distribution of raster nautical charts by MapTech and NOAA

    Multiple files—extensions *.bsb, *.cap, and *.kap
  • Controlled Image Base (CIB)

    Panchromatic (grayscale) images that have been georeferenced and corrected for distortion due to topographic relief distributed by NGA. Thus, they are similar to digital orthophoto quads and have similar applications, such as serving as a base or backdrop for other data or as a simple map.

    File extension is based on specific product. You can specify which products you want ArcGIS to recognize (Customize>ArcMap 	Options>Raster>File Formats)
  • Digital Geographic Information Exchange Standard (DIGEST)

    DIGEST datasets are digital replicas of graphic products designed for seamless worldwide coverage. ASRP data is transformed into the ARC system and divides the earth’s surface into latitudinal zones. USRP data is referenced to UTM or UPS coordinate systems. Both are based on the WGS84 datum.

    Multiple files
    Main raster image—extension *.img
    General information file—extension *.gen
    Georeference file—extension *.ger
    Source file—extension *.sou
    Quality file—extension *.qal
    Transmission header file—extension *.thf
  • File geodatabase

    The geodatabase is the native data structure for ArcGIS and is the primary data format for representing and managing geographic information, such as feature classes, raster datasets, and attributes.

    Raster datasets stored within *.gdb folder
  • ENVI Header

    When ENVI works with a raster dataset it creates a header file containing the information the software requires. This header file can be created for multiple raster file formats.

    Header file—extension *.hdr
    Multiple data files—extension *.raw, *.img, *.dat, *.bsq, 	etc.
  • Golden Software Grid (.grd)

    There are three types of Golden Software Grids that are supported: Golden Software ASCII GRID (GSAG), Golden Software Binary Grid (GSBG), and Golden Software Surfer 7 Binary Grid (GS7BG).

    Single file—extension *.grd
  • GRIB

    The gridded binary format is used for the storage, transmission, and manipulation of meteorological archived data and forecast data. The World Meteorological Organization (WMO) is responsible for the design and maintenance of this format standard.

    Single file—extension *.grb
  • Hierarchical Data Format (HDF) 4

    A self-defining file format used for storing arrays of multidimensional data.

    Single file—extension *.h4 or *.hdf
  • HGT

    Raw SRTM height files containing elevation measured in meters above sea level, in a geographic projection (latitude and longitude array), with voids indicated using -32768.

    Single file—extension *.hgt
  • High Resolution Elevation (HRE)

    HRE data is intended for a wide variety of National Geospatial- Intelligence Agency (NGA) and National System for Geospatial Intelligence (NSG) partners and members, and customers external to the NSG, to access and exploit standardized data products. HRE data replaces the current non-standard High Resolution Terrain Elevation/Information (HRTE/HRTI) products and also replaces non- standard products referred to as DTED level 3 thru 6.
    This data format is similar to NITF.

    Multiple files
    Raw image—extension *.hr*
    Metadata—extension *.xml
  • Integrated Software for Imagers and Spectrometers (ISIS)

    ISIS Cube format as created by the United States Geological Survey (USGS) for the mapping of planetary imagery. Versions 2 and 3 are supported.

    Single file—extension *.cub
  • Shuttle Radar Topography Mission (SRTM)

    The HGT format is used to store elevation data from the Shuttle Radar Topography Mission (SRTM). SRTM-3 and SRTM-1 v2 files can be displayed.

    Single file—extension *.hgt
    
  • Terragen terrain

    The Terragen Terrain file was created by Planetside Software. It stores elevation data.

    Single file—possible file extensions *.ter, *.terrain
    
  • MAP

    PCRaster’s raster format.

    Single file—extension *.map
    
Exit mobile version
%%footer%%