Geoserver Importer Extension API – Upload and Publish Data

In our previous articles we went through how vector and raster data can be publish on Geoserver using stores. Here, in this article we would be discussing what is importer and how this extension can be used to upload and publish the data i.e with Geoserver Importer Extension API.  If you haven’t looked over how to install geoserver, here is the article to install geoserver in linux or install geoserver in windows.

Geoserver Importer Extension API – Upload and Publish Data

Install Importer Extension in GeoServer

As this an official extension, it can be downloaded from its website that is http://geoserver.org/release/stable/   link.

Follow the steps to install extension-

  1. Download the extension from given website according to your geoserver version.
  2. Extract the archive in WEB-INF/lib directory.
  3. After this, restart the Geoserver.
  4. To check the availability of extension, open the geoserver in browser and check the Data section and find import data.

Supported Data format by Importer Extension GeoServer

For spatial data it supports
  1.  Shapefile and
  2.  GeoTiff
For DataBases it supports
  1. PostGIS
  2. Oracle
  3. Microsoft SQL Server

Upload and Publish Data – Geoserver Importer Extension API

There are two simple steps to upload and publish data. To upload data you can click on browse and find the file to upload, select workspace and store then click to next . If data is successfully uploaded an import id is generated  with status pending. The status shows that data has been added but it is not published.

To publish data you can click on import id. New page will open. Here you can click on layer name to change any setting or style. 

To publish click on check box and hit import button. Now published data is available to you to view in layer preview and google earth. Select the desired option and click to go.

Publish Data using REST API-  Geoserver Importer Extension

To upload and import data we can also use REST API (Representational state transfer Application programming interface). For this you need to follow the code.

private function create_a_task($workspace)
 {
 $headers = ['Content-Type: application/json', 'accept: application/json'];
 $data['import']=array('targetWorkspace'=> array('workspace'=> array('name'=>$workspace)));
 $settings = [
 CURLOPT_HTTPHEADER => $headers,
 CURLOPT_USERPWD => $this->passwordString,
 CURLOPT_RETURNTRANSFER => TRUE,
 CURLOPT_POST => TRUE,
 CURLOPT_POSTFIELDS=> json_encode($data),
 ];

$endpoint = "rest/imports";
 $response = $this->call($endpoint, $settings);
 if($response)
 {
 return $response;
 }else{
 return FALSE;
 }
 }

Whether task has created or not, you can check by browsing http://localhost:8080/geoserver/rest/imports link. you will get the following output.

{"imports":[{"id":1,"href":"http://localhost:8080/geoserver/rest/imports/1","state":"PENDING"}]}

After creating a task you can publish the task by executing the given function.

private function upload_task_data($fileName,$id,$workspace)
 {
 $headers = ['Content-Type: multipart/form-data', 'accept: application/json'];
 $finfo = finfo_open(FILEINFO_MIME_TYPE);
 $finfo = finfo_file($finfo, $fileName);
 $cFile = new CURLFile($fileName, $finfo, basename($fileName));
 $data = array( "filedata" => $cFile, "filename" => $cFile->postname);
 $settings = [
 CURLOPT_HTTPHEADER => $headers,
 CURLOPT_USERPWD => $this->passwordString,
 CURLOPT_RETURNTRANSFER => TRUE,
 CURLOPT_POST => TRUE,
 CURLOPT_POSTFIELDS => $data,
 CURLOPT_INFILESIZE => filesize($fileName),
 ];

$endpoint = "rest/imports/".$id."/tasks";
 $response = $this->call($endpoint, $settings);
 if($response)
 {
 return $response;
 }else{
 return FALSE;
 }
 }

To check the output of code follow the link and get the output.

http://localhost:8080/geoserver/rest/imports/1/tasks

{"tasks":[{"id":0,"href":"http://localhost:8080/geoserver/rest/imports/1/tasks/0","state":"READY"}]
private function ready_imports($import_id,$workspace)
 {
 $headers = ['Content-Type: application/json', 'accept: application/json'];
 $settings = [
 CURLOPT_HTTPHEADER => $headers,
 CURLOPT_USERPWD => $this->passwordString,
 CURLOPT_RETURNTRANSFER => TRUE,
 CURLOPT_POST => TRUE,
 ];

$endpoint = "rest/imports/".$import_id;
 $response = $this->call($endpoint, $settings);
 if($response)
 {
 return $response;
 }else{
 return FALSE;
 }
 }

Output will be

{"import":{"id":1,"href":"http://localhost:8080/geoserver/rest/imports/1","state":"COMPLETE","archive":false,"targetWorkspace":{"workspace":{"name":"netcdf"}},"data":{"type":"file","format":"GeoTIFF","file":"area3.geotiff"},"tasks":[{"id":0,"href":"http://localhost:8080/geoserver/rest/imports/1/tasks/0","state":"COMPLETE"}]}}

After publishing your data, you can also look for how to sytle your raster layer in geoserver and how to style vector layer in geoserver. Simultaneously you can check the data on geoserver. In this way you can upload and publish the data on geoserver with importer api. For any help and suggestions you can comment us in given box.

Download Australia Administrative Boundary Shapefiles – States, Local Government Area, Postal Areas and more

Hello GIS enthusiasts, IGISMAP has now published the latest GIS vector data of Australia administrative levels. Links for downloading the shapefiles of the important administrative divisions of Australia are provided in the following. You can also download these data in KML, GeoJSON or CSV formats. 

Note:

  • All data available are in GCS datum EPSG:4326 WGS84 CRS (Coordinate Reference System).
  • You need to login for downloading the shapefile.

Download Free Shapefile Data of Australia

Australia is the sixth largest country of the world by total area. It is a continent surrounded by Indian and Pacific oceans. Australia as a continent also exist as country, where Australia Continent does have Australia,  partially Indonesia and Papua New Guinea. Australia is one of the world’s most highly urbanized countries. Major cities of Australia are Sydney, Melbourne, Brisbane, Perth, Adelaide. Canberra is its capital city, which can be seen in the shapefile downloadable from below links.

Australia National Boundary

Download Australia National Outline Boundary Shapefile

Download Australia States Shapefile Data

The states and territories are federated administrative divisions in Australia, ruled by regional governments that constitute the second level of governance between the federal government and local governments. The Federation of Australia constitutionally consists of six federated states and ten federal territories, out of which three are internal territories contiguous to the Australian mainland; and the other seven are external territories and other offshore dependent territories.

Australia State Boundaries

Download Australia State Boundaries Shapefile

Federal States

  • New South Wales
  • Queensland
  • South Australia
  • Tasmania
  • Victoria
  • Western Australia

Internal Territories

  • Australian Capital Territory
  • Jervis Bay Territory
  • Northern Territory

External Territories

  • Ashmore and Cartier Islands
  • Christmas Island
  • Cocos (Keeling) Islands
  • Coral Sea Islands
  • Heard Island and McDonald Islands
  • Norfolk Island
  • Australian Antarctic Territory

Download Australia Local Government Areas Shapefile Data

Local government is the third level of government in Australia, administered with limited autonomy under the states and territories, and in turn beneath the federal government. The Australian local government is generally run by a council, and its territory of public administration is referred to generically by the Australian Bureau of Statistics as the local government area or LGA, each of which encompasses multiple suburbs or localities often of different postcodes; however, stylized terms such as “city”, “borough” and “shire” also have a geographic or historical interpretation. As of August 2016, there were 547 local councils in Australia.

Australia LGA Boundaries

Download Australia LGA Boundaries Shapefile

This shapefile covers following shire or council listed below:

  • Inner West Council
  • Council of the City of Sydney
  • Burwood Council
  • Canterbury-Bankstown Council
  • City of Banyule
  • City of Darebin
  • City of Boroondara
  • City of Yarra
  • City of Melbourne
  • City of Port Phillip
  • City of Stonnington
  • City of Manningham
  • City of Whitehorse
  • City of Hobsons Bay
  • City of Wyndham
  • City of Greater Geelong
  • City of Monash
  • Northern Beaches Council
  • City of Adelaide
  • Borough of Queenscliffe
  • Surf Coast Shire
  • Golden Plains Shire
  • Shire of Colac Otway
  • Shire of Corangamite
  • Shire of Pyrenees
  • City of Ballarat
  • Shire of Moorabool
  • City of Melton
  • City of Brimbank
  • City of Hume
  • Shire of Macedon Ranges
  • City of Moreland
  • City of Whittlesea
  • Shire of Mitchell
  • Shire of Hepburn
  • City of Moonee Valley
  • City of Maribyrnong
  • Shire of Nillumbik
  • City of Glen Eira
  • Shire of Murrindindi
  • City of Bayside
  • City of Kingston
  • City of Greater Dandenong
  • City of Frankston
  • City of Casey
  • Shire of Mornington Peninsula
  • City of Knox
  • City of Maroondah
  • Shire of Yarra Ranges
  • Shire of Cardinia
  • Shire of Baw Baw
  • Shire of South Gippsland
  • Bass Coast Shire
  • Shire of Mount Alexander
  • City of Greater Bendigo
  • Shire of Loddon
  • Rural City of Mildura
  • Shire of West Wimmera
  • Shire of Hindmarsh
  • Shire of Yarriambiack
  • Shire of Buloke
  • Rural City of Swan Hill
  • Shire of Strathbogie
  • Shire of Campaspe
  • Rural City of Ararat
  • Shire of Moyne
  • City of Warrnambool
  • Shire of Northern Grampians
  • Shire of Southern Grampians
  • Shire of Mansfield
  • Shire of Central Goldfields
  • Shire of Wellington
  • Rural City of Wangaratta
  • Rural City of Benalla
  • Latrobe City
  • Shire of Glenelg
  • Rural City of Horsham
  • Shire of East Gippsland
  • Alpine Shire
  • Shire of Towong
  • Shire of Gannawarra
  • City of Greater Shepparton
  • Shire of Moira
  • Shire of Indigo
  • City of Wodonga
  • District Council of Grant
  • City of Mount Gambier
  • Albury City Council
  • Greater Hume Shire Council
  • Wattle Range Council
  • Victoria-Daly Region
  • City of Darwin
  • Bundaberg Region
  • Wentworth Shire Council
  • Central Darling Shire Council
  • Bourke Shire Council
  • Broken Hill City Council
  • Balranald Shire Council
  • Brewarrina Shire Council
  • Walgett Shire Council
  • Cobar Shire Council
  • Bogan Shire Council
  • Moree Plains Shire Council
  • Hay Shire Council
  • Carrathool Shire Council
  • Warren Shire Council
  • Lachlan Shire Council
  • Murray River Council
  • Queanbeyan-Palerang Regional Council
  • Edward River Council
  • Clarence Valley Council
  • Richmond Valley Council
  • Griffith City Council
  • Kyogle Council
  • Tenterfield Shire Council
  • Glen Innes Severn Council
  • Armidale Regional Council
  • Nambucca Shire Council
  • Bellingen Shire Council
  • Coffs Harbour City Council
  • Lismore City Council
  • Ballina Shire Council
  • Tweed Shire Council
  • Byron Shire Council
  • Kempsey Shire Council
  • Walcha Council
  • Port Macquarie-Hastings Council
  • Dungog Shire Council
  • Port Stephens Council
  • Upper Hunter Shire Council
  • Maitland City Council
  • Newcastle City Council
  • Cessnock City Council
  • Lake Macquarie City Council
  • Singleton Council
  • Inverell Shire Council
  • Central Coast Council
  • Randwick City Council
  • Waverley Council
  • Woollahra Municipal Council
  • Georges River Council
  • Sutherland Shire Council
  • Strathfield Municipal Council
  • Cumberland Council
  • Fairfield City Council
  • Liverpool City Council
  • City of Parramatta Council
  • City of Canada Bay Council
  • Blacktown City Council
  • Council of the City of Ryde
  • The Council of the Shire of Hornsby
  • The Hills Shire Council
  • Hawkesbury City Council
  • Ku-ring-gai Council
  • Willoughby City Council
  • Berrigan Shire Council
  • Murrumbidgee Council
  • Federation Council
  • Snowy Monaro Regional Council
  • Snowy Valleys Council
  • Eurobodalla Shire Council
  • Bega Valley Shire Council
  • Wagga Wagga City Council
  • Cootamundra-Gundagai Regional Council
  • Yass Valley Council
  • Mid-Coast Council
  • Junee Shire Council
  • Temora Shire Council
  • Hilltops Council
  • Bland Shire Council
  • Weddin Shire Council
  • Cowra Shire Council
  • Upper Lachlan Shire Council
  • Uralla Shire Council
  • Gwydir Shire Council
  • Gilgandra Shire Council
  • Dubbo Regional Council
  • Warrumbungle Shire Council
  • Mid-Western Regional Council
  • Cabonne Council
  • Parkes Shire Council
  • Narromine Shire Council
  • The Council of the Municipality of Hunters Hill
  • North Sydney Council
  • Lane Cove Municipal Council
  • Mosman Municipal Council
  • Penrith City Council
  • Wollondilly Shire Council
  • Camden Council
  • Campbelltown City Council
  • Lithgow City Council
  • Blue Mountains City Council
  • Wollongong City Council
  • Wingecarribee Shire Council
  • Shellharbour City Council
  • Oberon Council
  • Goulburn Mulwaree Council
  • The Council of the Municipality of Kiama
  • Shoalhaven City Council
  • Coolamon Shire Council
  • Narrandera Shire Council
  • Lockhart Shire Council
  • Bathurst Regional Council
  • Muswellbrook Shire Council
  • Liverpool Plains Shire Council
  • Tamworth Regional Council
  • Narrabri Shire Council
  • Gunnedah Shire Council
  • Leeton Shire Council
  • Forbes Shire Council
  • Blayney Shire Council
  • Orange City Council
  • Kangaroo Island Council
  • Yorke Peninsula Council
  • Renmark Paringa Council
  • District Council of Loxton Waikerie
  • Southern Mallee District Council
  • Tatiara District Council
  • Naracoorte Lucindale Council
  • District Council of Robe
  • Kingston District Council
  • Anangu Pitjantjatjara Yankunytjatjara Local Government Area
  • Maralinga Tjarutja
  • District Council of Coober Pedy
  • Municipal Council of Roxby Downs
  • Uia Riverland Local Government Area
  • Berri Barmera Council
  • Pastoral Unincorporated Area
  • Port Augusta City Council
  • Flinders Ranges Council
  • District Council of Orroroo Carrieton
  • District Council of Peterborough
  • Mid Murray Council
  • Unincorporated Area
  • Bayside Council
  • Coorong District Council
  • District Council of Karoonda East Murray
  • Rural City of Murray Bridge
  • District Council of Ceduna
  • District Council of Streaky Bay
  • Wudinna District Council
  • District Council of Elliston
  • Coonamble Shire Council
  • Alexandrina Council
  • City of Victor Harbor
  • District Council of Yankalilla
  • City of Onkaparinga
  • Mount Barker District Council
  • City of Swan
  • Bayswater
  • City of Belmont
  • Waverley Council

Download Australia Postal Areas Shapefile Data

There are over 2670 postal area boundaries in the following data

Australia Postal Area Boundaries

Download Australia Postal Area Boundaries Shapefile

Other Administrative Boundary Data:

Australia Demographic Data:

Download Free Shapefile for the following:

  1. World Countries Shapefile
  2. Australia
  3. Argentina
  4. Austria
  5. Belgium
  6. Brazil
  7. Canada
  8. Denmark
  9. Fiji
  10. Finland
  11. Germany
  12. Greece
  13. India
  14. Indonesia
  15. Ireland
  16. Italy
  17. Japan
  18. Kenya
  19. Lebanon
  20. Madagascar
  21. Malaysia
  22. Mexico
  23. Mongolia
  24. Netherlands
  25. New Zealand
  26. Nigeria
  27. Papua New Guinea
  28. Philippines
  29. Poland
  30. Russia
  31. Singapore
  32. South Africa
  33. South Korea
  34. Spain
  35. Switzerland
  36. Tunisia
  37. United Kingdom Shapefile
  38. United States of America
  39. Vietnam
  40. Croatia
  41. Chile
  42. Norway

Disclaimer : If you find any shapefile data of country provided is in correct do contact us or comment below, so that we will correct the same in our system as well we will try to correct the same in openstreetmap.

Mapzen Alternative – Build your server

In this post we are focusing on Mapzen Alternative. Recently an open source mapping company Mapzen announced it would shut down shortly with Its hosted APIs and support services going down too.

Mapzen Alternative – Build your own server

Mapzen tools help developers build wonderful interactive maps and equip them with search and routing services. This shut down created some serious issues for Mapzen user. Which includes many app developers, civic organisations and some government agencies etc. but here’s how everyone got saved. In Mapzen everything is open source and Mapzen only deals with open data from openstreetmap.

Now for Mapzen client’s, have only two options, i.e to switch to another hosted API that offers the similar functionality, or to Run their own servers with the open source projects powered by Mapzen services. 

Mapzen Server Setup with Open source projects

I recommend you guys to Build your own server as  Mapzen alternative. As Mapzen services are backed by open-source software projects and use open data. Now you can run open-source versions of Mapzen services.  Don’t worry guys if you don’t have any technical knowledge about how to configure the server, we are here to help. We can help you create your own server for your own business with every piece of functionality and service that Mapzen was providing.

If you want to Build your own server with Mapzen open source software as Mapzen alternative services, we are here to help you. We can help you achieve every functionality you want in your own new server.

Mapzen Alternative hosted API Programs:

Mapzen has a total list of Mapzen alternative hosted APIs which can fulfill the clients requirements like

  • Nextzen (A long-term support version of own Tilezen)
  • Mapbox and many.

We prefer using map server of our own or to hire services from GIS Experts, this would make a full control of your own system. Feel free to contact us If you need to build your server as Mapzen Alternative at Enginner Philosophy Web services Pvt. Ltd.

Please feel free to comment in given box for any help.


Insurance Management GIS Web/App Development – Cost, Time – Map Tool

In this blog post we describe a detailed overview of Insurance Management GIS Web/App Development tool’s Requirement, Time, Technology and functionality. Insurance Management GIS map tool provides you every location-based insight you need and It can also be used as Risk Manager as It uses smart maps, data analysis and all of the features for controlling risks and managing business strategies of Insurance companies.

Why one should Build Interactive Insurance Management GIS Map Tool:

  • For Understanding and Improving Key Performance of Insurance Business with GIS Tool:

    1. Risk Assessment : Insurance Management GIS Map Tool exposes the exact location of risk for the Insurance companies with the interactive maps and helps in target the limited capital to higher opportunity or areas of lower risk. Our tool provides you insights that supports data-driven decision-making and more effective business strategy.
    2. Comparing Business Measures : You can easily map business measures and compare them with the help of Insurance Management GIS Map Tool. It can validate various locations and  visualize loss patterns on an interactive and beautiful maps.
    3. Territory Management: Insurance Management GIS Map Tool helps companies in their territory management and our analysis shows how geography interacts with hazards and assets to help companies limit risk. Insurance Management GIS Map Tool helps you implanting and deploying the networks necessary to operate efficiently in your territory.

  • For Response Planning and management of Insurance with GIS Tool:

    1. Manage your Policyholders on interactive map :  You can manage your Policyholders on the maps according to their location. you can handle the location details, description, insured values and your client’s network as according to your strategy by using the tool.
    2. Disaster analysis: Our tool reduces your companies progressive risk loss with the interactive maps. As these maps, data analytics ensures that you understand risk and make effective management plans.
    3. Management: An Interactive Insurance Management GIS Map Tool’s maps and spatial data analysis exposes the risk nearness that helps in improving the risk score accuracy. when natural disasters happens and losses occur, Insurers needs to respond to incidents quickly and efficiently for the policyholders and for that this tool lets you quickly visualize events on the map with advanced analytics to prioritize response execution and plan for claims handling prior to catastrophic events.

Scope of Insurance Management GIS Web/App Development:

Insurance sector is facing broad changes driven by a convergence of of business and technology forces fuelled by innovation. Insurance companies have immense desires of data to make better decisions and to utilize the data for risk management, companies use strong geographic component. From managing the addresses of policyholders to the location of risk to the logistics of handling claims, GIS benefits the companies most.

In Insurance Management GIS Map Tool policyholders location decides the insured value and importance of claims and how it will be processed. GIS is used as a valuable tool in Insurance Industry. It’s all about predicting risk in the insurance industry. And insurance companies better manage risk with GIS tools which with real-time data helps improve decision-making at a quicker pace.

Insurance Management GIS Map Tool has the range of functions which allows the use of policyholders data and spatial analysis to effectively serve customers, triage claims, and monitor fraudulent activities by embracing location-based intelligence. This system allows you to integrate a large variety of data into one into one place i.e. Map, where you can analyze the incident reports with an infographic representation of policyholders, their insured values and description. This tool provides interactive maps, data analysis and all of the features for controlling risks and managing business strategies.

We provide simple and versatile Insurance Management GIS Map Tool which is backed up by live support. We upsurge your business with the sharpest technology and outstanding features.

Requirement Gathering for Insurance Management App:

        • What do client require for gis insurance tool with map?

          We have an precise idea of our client’s needs for this tool in their business, so here is a list of some main requirements we think that every client would want in their Insurance Management GIS Map Tool.

          • Proactively managing risk to improve resilience.
          • communicate data quickly and clearly.
          • Maps diversification for affordable coverage.
          • Express complex data simply and enhances understanding and comprehension.
          • Zone rating and pricing.
          • Understanding of patterns and trends over space and time.
          • Improve risk analysis, evaluation, and mitigation.
          • Summarized and interpretive conveying of statistical data
          • Identify high- and low-performing areas for sales optimization.
          • Analyze policy base to agent resources to create more effective sales territories.
          • Performing better market analysis with spatial analysis and powerful decision-making insight.
          • Visualize aggregated policyholder data at the district level and areas of high total insured value, they see locations of potential significant losses.
          • Getting professional work of captivating maps, reports and interactive web portal which distinguish you from competition.
        • Software Requirement for insurance gis map tool app:

          These are some software requirements for the implementation of the Insurance Management GIS Map Tool:

          • Server: We can use any server for this Website tool but we prefer these two servers to be precise that we will be working on:
          1. NGINX Server – Nginx is an open source web server which can handle a website with a huge amount of traffic. It is a high performance web server developed with an intention to handle websites with large number of users. Its speciality is that it can run on a minimal amount of resources and handle a large number of requests.
          2. Digital Ocean Server – Digital ocean server or ‘droplets’ is a cloud server which is designed to store and server massive amount of data while making it easy and cost effective. Digital ocean server use KVM as hyperviser and can be created in various sizes. It helps in build deploy and scale cloud application faster and more efficient

          We personally recommend using Digital Ocean Server, as it is much faster, easy and cost efficient.

          • Leaflet: With leaflet you can compute the features bounding box, create a layer group, remove or add as many marker or different layer as you want on a map. Adding vector layers, raster layers, adding wms or wfs layer (can be used to serve and render geoserver or map server layers), selecting and hovering over lat-long are some of the functionality which can be easily grabbed by leaflet js map library.
          • Database: We will be using this database for storing the Insurance Management GIS Map
            data :
          1. PostGIS/PostGreSQL : PostGIS is an open source software. It adds support for geographic objects to the PostgreSQL database. PostGIS follows the simple features for SQL specification from the Open Geospatial Consortium (OGC).
          • Mapping Systems: This is the main software component of the Insurance Management GIS Map Tool. This whole system is dependent on the web mapping of the data. For mapping the data we can use any of these two Mapping systems.
          1. Google Maps: Google Maps is the tool which is used to display geographical information on a map which is in a widely accepted standard format for digital maps.
          2. OSM (Open Street Map): OSM is the software that creates and distributes the open source graphic data of the world. OSM has no restriction of technical or legal type. It allows free access to its map images and underlying map data. All the Insurance Management data locations can be found here with the nearby entities as well.

Features of Insurance Management GIS Web/App:

      • Easy data uploading in gis tool :

        We are providing a direct interface for uploading the spatial data to generate the interactive maps. You can just upload the Policyholders locations or any disaster spatial data into the database which will present the infographic representation of the data i.e. maps. You can upload any type of data and if you have data in spreadsheet you can open our other tool IgisMap Converter and convert your data into the spatial data format and then upload it.

      • Generating Maps and Reports from insurance app :

        New maps can be generated from the maps that were customized or edited in whatever way the you wants them to be. Company can style the map according to their wishes or the client. In styling the color, popup details, markers can be changed or customized and altogether generates a new Map. Specific areas of City/County/colony can be filtered with the help of Polygon and then the Insurance Management data will be presented. You also can generate and download the pdf file or spreadsheet document data of newly generated maps representing all the data of Insurance or Disaster Management. Doing so will ensure that your teams and their clients have the most accurate and timely data in their hands.

      • Proximity Analysis from insurance management app:

        Companies can use proximity analysis to compare and determine the relationship between selected office and the area covered by policyholders near it. Proximity analysis gives the company, the ability to more easily showcase the total no. of policyholders in the area, their premium related descriptions and advantages with risk analysis to its location.  You can visualize aggregated policyholder data at the district level and areas of high total insured value and see locations of potential significant losses. You can visualize aggregated policyholder data at the district level and areas of high total insured value and see locations of potential significant losses. You can shift your strategy to provide new, compelling, and original information to your policyholders which can pay off in many ways. Analytics reports can be generated in any format and you can download it to use it further. Proximity analysis is a crucial tool for business marketing and site selection.

Cost:

Contact us at our mail or put a comment below to discuss the expected cost.

Interactive Real Estate Web/App Development – Cost, Time – GIS Tool

In this blog post we describe a detailed overview of Real Estate Web App GIS tool’s Requirement, Time, Technology and functionality. All of the required features and requirements of Real Estate web app GIS tools are going to be described in this post in details.

Why one should Build Interactive Real Estate Web App GIS tool:

  • For showing properties and features of your site to client:
    1. 3D Map Designs: In this digital era of the century, the Real Estate Web App GIS tool showcase your real estate properties in rich map visualization and 3D designs to your client with an interactive website to help you stand out from the crowed. Now, with 3D maps of buildings and 2D maps of interior spaces or floor plans, your client can easily access its facility information and get impressed. The 3D designs can be very helpful in enhancing communication across clients and the property which helps you get to profit the business.
    2. Amenities and Nearby places visualization -attracts customers  : Real Estate Web App GIS Tool helps in showing the amenities and nearby places of the real estates property to the clients. The Client can see and get all the information about the nearby schools, hotels, subway locations and the amenities provided at the campus in the maps.  Your best properties with map visualizations and persuasive location-based collateral helps creating the compelling marketing strategy for the clients that helps in closing the deal without even taking to real location.
    3. Digital Marketing: Real Estate Web App GIS Tool has features that provides the direct link to available location that client asked for via text, whatsapp or any social network.
  • For Real Estate Employer and Employees:
    1. Manage your properties on interactive map :  You can manage your properties on the maps according to your wish. you can handle the location details, description, availability and rates of every site/property as according to your strategy by using the tool.
    2. Market analysis: An Interactive Real Estate web app GIS tool’s maps and spatial data analysis exposes the marketing patterns that helps in improving the execution strategy of corporate deals. It lets you find the obscure insights and use that knowledge to delight your customers and maximize return on investment. With market analysis you can turn your understanding of competition, supply and demand into profits. This tool helps you to identify market gaps and its spatial data analysis help identifying investment properties which bring the best return for the client.

Scope:

Sites, Buildings, Plots etc these are the entities that makes Real Estate but there is only one thing that matters in each one of them i.e. ‘Location’. Location is always one of the determining factors influencing property value in Real Estate Business. They say to get success in Real Estate you should know how to apply both of your financial and geographic expertise.

As of Real Estate, location is the origin of geographic data for GIS users. The accuracy of location decides the value and importance of data and how it will be used. As we see location is the common focus point for both, GIS can be used as a valuable tool in many different conventions of real estate. And here we have the perfect tool which allows you to use insight, creativity and objectivity to work out the best deal for the company and their clients and take marketing and profits to the next level.

Real Estate Web App GIS tool has the range of functions which allows the use of psychographic data and spatial analysis to deliver clients the highest possible return on their site selection strategy. This system allows you to integrate a large variety of data into one into one place i.e. Map, where you can present your clients with an infographic (visual representation of information that use designs to display information content) representation affecting the desirability and value of a property can give a far more accurate picture of a property’s suitability to their needs.

We provide simple and versatile Real Estate Web App GIS tool which is backed up by live support. We upsurge your business with the sharpest technology and outstanding features.

Now you can have more time with your client then sitting in front of a computer.

Requirement Gathering:

        • What do client require?

          We have an absolute idea of our client’s needs for the Website tool in their business, so here is a list of some main requirements we think that every client would want in their Real Estate Web App GIS tool.

          • Communicate assessment information with maps
          • communicate data quickly and clearly
          • express complex data simply and enhances understanding and comprehension
          • self-contained summery of sites that the client needs or value
          • presenting cause and effect insights in impactful ways
          • summarized and interpretive conveying of statistical data
          • Logically grouping of quantitative sales data and presenting them as structured information through charts/reports/maps.
          • Escalating market knowledge with the location based data to help better understands factors that drive growth for the business and uncovering hidden opportunities for a competitive advantage.
          • More accurately estimating the impact of location on property value
          • Performing better market analysis with spatial analysis and powerful decision-making insight.
          • With location-based data transforming the reports into data-driven decisions that expands marketing and site selections.
          • Getting professional work of captivating maps, reports and interactive web portal which distinguish us from competition.
        • Software Requirement:

          These are some software requirements for the implementation of the Real Estate Web App GIS tool:

          • Server: We can use any server for this Website tool but we prefer these two servers to be precise that we will be working on:
          1. NGINX Server – Nginx is an open source web server which can handle a website with a huge amount of traffic. It is a high performance web server developed with an intention to handle websites with large number of users. Its speciality is that it can run on a minimal amount of resources and handle a large number of requests.
          2. Digital Ocean Server – Digital ocean server or ‘droplets’ is a cloud server which is designed to store and server massive amount of data while making it easy and cost effective. Digital ocean server use KVM as hyperviser and can be created in various sizes. It helps in build deploy and scale cloud application faster and more efficient

          We personally recommend using Digital Ocean Server, as it is much faster, easy and cost efficient.

          • Converter: Converter can be used to convert the information data file of one format to another format. There are many converters available online you can use any one of them but we prefer IgisMap Converter which converts any type of raster or vector data file into another format.
          • Leaflet: With leaflet you can compute the features bounding box, create a layer group, remove or add as many marker or different layer as you want on a map. Adding vector layers, raster layers, adding wms or wfs layer (can be used to serve and render geoserver or map server layers), selecting and hovering over lat-long are some of the functionality which can be easily grabbed by leaflet js map library.
          • Database: We will be using this database for storing the Real Estate data :
          1. PostGIS/PostGreSQL : PostGIS is an open source software program that adds support for geographic objects to the PostgreSQL object-relational database. PostGIS follows the Simple Features for SQL specification from the Open Geospatial Consortium (OGC).
          • Mapping Systems: This is the main software component of the Real Estate Web App GIS tool. This whole system is dependent on the web mapping of the data. For mapping the data we can use any of these two Mapping systems.
          1. Google Maps: Google Maps is the tool which is used to display geographical information on a map which is in a widely accepted standard format for digital maps.
          2. OSM (Open Street Map): OSM is the software that creates and distributes the open source graphic data of the world. OSM has no restriction of technical or legal type. It allows free access to its map images and underlying map data. All the Real estate data locations can be found here with the nearby entities as well.

Features:

      • Easy data uploading:

        We are providing a direct interface for uploading the spatial data to generate the maps. You can just upload the real estate locations spatial data into the database which will present the infographic representation of the data i.e. maps. You can upload any type of data and if you have data in spreadsheet you can open our other tool IgisMap Converter and convert your data into the spatial data format and then upload it.

      • Web Mapping:

        Real Estate Web App GIS tool represents the real estate location spatial data as infographic data/web maps via leaflet. The company can present data from all over the world with as much properties into the map. Real estate professionals can target properties to match exact specifications and deliver the answers needed to make the most intelligent choices with the web maps. This data facilitates better decision making and tells a compelling story that illustrates the ways in which the proposed development will be an attractive investment for both the developer and the neighborhood residents.

      • Customizing Maps:

        The maps can be customized in whatever way the client wants them to be. Company can style the map according to their wishes or the client. In styling the color, popup details, markers can be changed or customized. Specific areas of City/County/colony can be filtered with the help of Polygon and then the real estate data will be presented. Think about how companies handle their customer relationship management (CRM) data. Managing or customizing your location data map requires a similar approach if you want to leverage its value. Doing so will ensure that your teams and their clients have the most accurate and timely data in their hands.

      • Web 3D Map:

        Map with third dimension on Web gives you a new way to visualize reality. Isn’t that cool if you get to know building level detail, analyze the surface by getting elevation detail and get the actual visualization to some extent even without visiting the area. Adding third dimension to a map is an add-on for geographers, government bodies and to every individual for proper understanding the geographic area. Real Estate can take advantage of Web 3D Map with existing GIS database knowledge. As it can get their clients introduced to a new place or building before taking a tour to an unknown area.

      • Analytic reports:

        Companies or Builders can use analysis to compare the desirability of locations can help ensure fair and equitable valuation of property. Spatial analysis gives the client, and ultimately the seller, the ability to more easily showcase the subject property’s characteristics and advantages with respect to its location. As the ability to see a property overlaid by school districts, aerial photography, shopping access, and utility services gives the Client an immediate sense of place for their possible new home. You can shift your strategy to provide new, compelling, and original information to your clients which can pay off in many ways. Better analytics, efficient data management, and relevant information products result in real return on investment. Analytics reports can be generated in any format and you can download it to use it further.

Cost:

Contact us at our mail or put a comment below to discuss the expected cost.

Convert HDF5 to Geotiff

In this article we are discussing about converting HDF5 to Geotiff file format. The question may arise in your mind that why would anyone convert HDF5 data into geotiff. The answer is simple, not every server or software support HDF5 data so for that you need to install some plug-ins that may take time in your analysis process.

Online Tool to Convert HDF5 to GeoTiff

Convert HDF5 to Geotiff

HDF5 (Hierarchical Data Format) file is Multi-Dimensional data that contains data in hierarchical format. That means in one file we have multiple bands and that bands also contains sub bands. That can defines as a tree type structure. You may look over details in multidimensional HDF5 Data.

Convert HDF5 to Geotiff using GDAL utility-

Here we have used GDAL Utility that is gdal_translate. For using this utility you need to add GDAL in your system. please follow the given command

To check the availability you can type ogr2ogr in command prompt and get the following result.

After setting the GDAL utility in system, you can run the conversion command for HDF5 file, which is

–> gdal_translate -a_srs EPSG:4326 HDF5:File_name.hdf5:BAND_Name -of ‘Gtiff’ Output_FileName.geotiff

Gdal_translate has some options, which can be seen by typing gdal_translate in your command prompt.

Here, in the command we have -a_srs to assign SRS (spatial reference system) , specify the HDF5 file with band. the option -of ‘Gtiff’ shows the output file format.

You may also look for other conversion to GeoTiff i.e from NetCDF to GeoTIFF or from Grib to GeoTIFF file.

Output In QGIS software- Convert HDF5 to Geotiff

Please let us know, if you face any problem or require any help in conversion by commenting in given comment box.

Convert NetCDF to Geotiff

In this article we are going you discuss conversion process of NetCDF to geoTIFF file. Here this conversion is required because many of servers does not directly support NetCDF. You need to install some plug-ins to publish and view the Netcdf data. So it would be better to convert the Netcdf data in geotiff for particular bands so that you do not have to install plugins.

Online Tool to Convert NetCDF to GeoTiff

Convert NetCDF to Geotiff

NetCDF data is a multi-Dimensional data to store large number of bands in one file. There can be various dimensional such as space (Latitude, Longitude and Altitude) and time. In bands you can have information about pressure, temperature, wind direction etc. You can look over in detail of multidimensional data of NetCDF file.

Convert NetCDF into GeoTiff using gdal utility

For using Gdal utility you need to add gdal in your system. For that you can follow the given commands

To check the availability of ogr2ogr in system, you can type the command ogr2ogr and get following response

Now you can follow the given command to convert NetCDF in GeoTiff

–> gdal_translate -a_srs EPSG:4326 NETCDF:File_Name.nc:Band_Name  -of ‘Gtiff’ Output_FileName.geotiff

Here we have used gdal_translate utility of GDAL. It has following options

Here -a_srs srs_def defines the assignment of SRS (Spatial Reference system) to output file. we have selected EPSG (European Petroleum Survey Group)  4326. You can choose your file’s SRS. The next option is NetCDF file name with a band which needed to be convert in geotiff. The option -of is the Output file format. Here ‘Gtiff’  is geotiff driver in gdal. After this specify the output file name with .geotiff or .tiff extension.

Output Geotiff file- Convert NetCDF to Geotiff

The generated output tiff file can be viewd in QGIS software.

The output shows one of the band converted into geotiff. It has multiple bands. Similarly you can can convert other file in geotiff like HDF5 to GeoTIFF or Grib to GeoTIFF.

For more information or any help you can comment in given box. We are always available for your help.

Convert GRIB to Geotiff

In this tutorial, we will find out how a can we convert GRIB to GeoTIFF file format. First of all the question is what is GRIB file and why anyone would convert the GRIB file in Geotiff format.

Here is the online Tool to Convert GRIB To GeoTiff

Convert GRIB to GeoTIFF

Before taking to conversion of GRIB and GeoTIFF, lets first understand what is GRIB and What is GeoTIFF.

GRIB (General Regularly-distributed Information in Binary) files are multidimensional files. These files are used to store Meteorological data. The data is store in image mosaic format. That measn all the raster bands ate mosaic together to store in one file. You may also look over details of GRIB Multi dimensional data.

Convert GRIB file in Geotiff using GDAL utility-

Here GDAL Utility (gdal_translate) is used . For using this utility you need to add GDAL in your system. please follow the given command

To check the presence of this library, you can type ogr2ogr in command prompt and get the following output.

Now follow the command to convert GRIB in geotiff.

–> gdal_translate -b 354 -a_srs EPSG:4326 GRIB_Filename.grb2 -of Gtiff’ Output_tiffname.geotiff

The options available in gdal_translate utility can be viewed by executing command gdal_translate on command prompt.

Here, in the command we have -a_srs to assign SRS (spatial reference system) , specify the GRIB file. The option -of ‘Gtiff’ shows the output file format.

Output in QGIS software

Here we have more conversion as Netcdf to geotiff, HDF5 to geotiff etc., which can follow to convert your data.

Please feel free to comment in given box for any help.

QGIS2Web – Create Web Maps

Web Mapping  is a service through which the consumers will choose what they want to show on the map. It is a great way to publish your Geographical information system data to their web and make it accessible by the other consumers. web mapping is tightly related to programming and it has a learning curve. GIS users are typically aren’t web programmers and it presents a challenge when one needs to create a web map that is of the same quality as a map creating in a GIS. In this post we will learn how can we use QGIS2Web for creating the web map.

We make maps because we want to send out a message. The great advantage here is when you put your spatial data on a web map as opposed to an offline map, your map is to be seen and you get your message sent to much wider audience. You can just spread out the URL of your web map and have people explore your beautiful maps.

QGIS2Web – Create Web Maps

QGIS2Web is a tool that turns QGIS layers into HTML, JavaScript, and CSS files. QGIS2Web can create an interactive web map that pops up information for the user.

Using Qgis2web is no big deal and it is really very is to use. Let’s start it how and what we can do with Qgis2web.

Creating Map in QGIS – QGIS2Web

    • Go to your QGIS application and click add vector layer, Now browse the Layer from your downloaded project.
    • Now lets just create a map in QGIS. here in this map when a user clicks on a state we would want it to popup the information about it. the information is already present in the attribute table of this layer. Right click on the layer and select properties.
    • For the different attributes present in the layer. Switch to the Fields tab. Some of these aren’t relevant to us for web map, so we can choose to hide these. We will keep admin, region, postal, woe_label, name, longitude, latitude and type fields and hide the others fields. Click on Text Edit button under the Edit widget column for adm1_code field.
    • In the Edit Widget Properties dialog, choose Hidden as the type. Click OK. Do the with all the others.
    • We can also use the Alias column to indicate an alternate name for the fields without actually changing the underlying data table. This is useful to give more user-friendly field names to the users of our map. Add aliases as per your choices and click Ok.
    • Now if we want to show only specific data or area in our web map, Switch to General tab.
    • In General tab now we will build a query in Query builder in Provider feature filter for filtering the data we want to show to the map. So click to Query Builder and then select field by which you want to filter that data and insert the filter value. You can also test your query by clicking Test  button there. Then click OK on both windows.
    • Back in the main QGIS window, choose the Identify tool and click on any point. The Identify Results panel will display the nicely formatted attributes with the newly added aliases. You will notice that the hidden fields do not appear in the results.
    • Now let’s style our layer to be more visually appealing and informative. Right-click the layer and select Properties. Switch to the Style tab. Choose Categorized style and our field Name as the Column. Click Classify.
    • We need to label each State. Switch to the Labels tab in the Properties dialog. Select Show labels for this layer and choose name as the value for Label with. We will also set Rendering option so that the labels only appear when the user is sufficiently zoomed in. Check Scale-based visibility under Label options. Enter 1 as the Minimum scale and 10000000 as the maximum scale. This setting will render the labels only after the user has zoomed in more than 1:10000000 scale and will be visible till 1:1 scale.
    • The map is ready now. Time to save our work go to Project > Save. Enter name of the project you want to give.

    QGIS2WEB Web Mapping

    • Now as our Map is completed and saved. We will use Qgis2web which is a plugin of the QGIS software. You should first install the Qgis2web plugin from inside QGIS. To do that, In QGIS and go to Plugins > Manage and Install Plugins… Then search for qgis2web and click Install plugin.
    • Our QGIS map is now ready to be converted into a HTML map with qgis2web. Qgis2web reads QGIS layers and their style and converts them into HTML, Javascript, and CSS files that can be viewed from the browser.
    •  Once the plugin is installed, we will create a web map, go to Web > qgis2web > Create a web map.
    • In the Export web map dialog, select how you want the popups to be labelled in the web map in upper panel.
    • In the Export to web map dialog, Select Expanded or Collapsed in Add layers list in the bottom panel under the Appearance section. Also select the field for Label search whatever you like to see in your web map. Check the Show popups on hover to allow display of info-windows on hover. We can also set a basemap so the users have more context when looking at the layer. Select OSM B&W to use a black-and-white themed basemap create using OpenStreetMap data. You also have an option to choose from either OpenLayers or Leaflet as the web mapping library. We will restrict this tutorial to use the OpenLayers library. Click Update Preview` to see how your exported map will look like. Before we do the actual export, we need to set the Export folder. You can select a folder of your choice and click Export.
    • Once the export is complete, the default browser for your computer will open and show the interactive web map.
    • OpenLayes and Leaflet libraries ha many functions and operations that we can apply in Qgis2web  but Qgis2web also has some limitations. Here In this post we created a template with Qgis2web by which you can customize the web map. Qgis2web plugin saves a lot of valuable time in web mapping.  The output created from this process can be readily changed to suit your requirement.

    Pressing the Export button in QGIS2Web generates an index.html file and three folders with associated Javascript and CSS files. If you want to publish this map online, you would need to get a web hosting account and simply upload the index.html file and the three associated folders to the main public html directory. Visiting the URL of your website would then show the map in the browser.

ArcGIS FAQs – ArcGIS Interview Question

ArcGIS provides an infrastructure for making maps and geographic information available throughout an organization, across a community, and openly on the Web. Applying location-based analysis to business practices are some of the unique set of capabilities offered by ArcGIS. Here in this post we will check FAQs of ArcGIS and Common Question asked during Interview Question.

ArcGIS Interview Question – Frequently Asked Question ArcGIS

Que. What is ArcGIS?
Ans. ArcGIS is a geographic information system (GIS) for working with maps and geographic information. It is used for creating and using maps, compiling geographic data, analyzing mapped information, sharing and discovering geographic information, using maps and geographic information in a range of applications, and managing geographic information in a database. ArcGIS software—Create and Share Maps, Analytics, and Data.

Que. What is open source software?
Ans. An open source application by definition is software that you can freely access and modify the source code for.
name few open source GIS software
QGIS,gVSIG, Whitebox GAT, SAGA GIS, GRASS GIS, MapWindow, ILWIS, GeoDa, uDig and OpenJump

Que. What is geocoding?
Ans. Geocoding is the process of transforming a description of a location—such as a pair of coordinates, an address, or a name of a place—to a location on the earth’s surface.

Que. What is geodatabase?
Ans. an ArcGIS geodatabase is a collection of geographic datasets of various types held in a common file system folder, a Microsoft Access database, or a multiuser relational DBMS (such as Oracle, Microsoft SQL Server, PostgreSQL, Informix, or IBM DB2).

Que. What is database server?
Ans. A database server is a computer program that provides database services to other computer programs or to computers, as defined by the client–server model.

Que. What is georefrencing ?
Ans. Georeferencing means to associate something with locations in physical space. The term is commonly used in the geographic information systems field to describe the process of associating a physical map or raster image of a map with spatial locations.

Que. What is the purpose of georefrencing?
Ans. The purpose of georeferencing is to turn nonspatial imagery, such as historical air photos or maps, into spatial raster data for use in a variety of circumstances. Spatialized air photos, for example, can be used for GIS land cover analysis or to use as a baselayer on a mobile device While in the field.

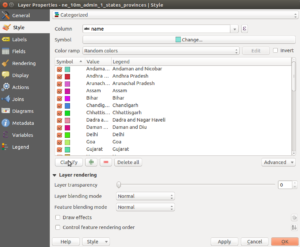
Que. What is the use of arcmap?
Ans. ArcMap is the main component of Esri’s ArcGIS suite of geospatial processing programs, and is used primarily to view, edit, create, and analyze geospatial data.ArcMap allows the user to explore data within a data set, symbolize features accordingly, and create maps.

Que. What is shape file?
Ans. The shapefile format is a popular geospatial vector data format for geographic information system (GIS) software. It is developed and regulated by Esri as a (mostly) open specification for data interoperability among Esri and other GIS software products.

Que. What are the extensions of shape file?
Ans. The extensions of shapeFiles are as follows:

.shp is a mandatory Esri file that gives features their geometry. Every shapefile has its own .shp file that represent spatial vector data. For example, it could be points, lines and polygons in a map.

.shx are mandatory Esri and AutoCAD shape index position. This type of file is used to search forward and backwards.

.dbf is a standard database file used to store attribute data and object IDs. A .dbf file is mandatory for shape files. You can open .DBF files in Microsoft Access or Excel.

.prj is an optional file that contains the metadata associated with the shapefiles coordinate and projection system. If this file does not exist, you will get the error “unknown coordinate system”. If you want to fix this error, you have to use the “define projection” tool Which generates .prj files.

.xml file types contains the metadata associated with the shapefile. If you delete this file, you essentially delete your metadata. You can open and edit this optional file type (.xml) in any text editor.

.sbn is an optional spatial index file that optimizes spatial queries. This file type is saved together with a .sbx file. These two files make up a shape index to speed up spatial queries.

.sbx are similar to .sbn files in Which they speed up loading times. It works with .sbn files to optimize spatial queries. We tested .sbn and .sbx extensions and found that there were faster load times When these files existed. It was 6 seconds faster (27.3 sec versus 33.3 sec) compared with/without .sbn and .sbx files.

.cpg are optional plain text files that describes the encoding applied to create the shapefile. If your shapefile doesn’t have a cpg file, then it has the system default encoding.

Que. What extensions does raster file uses?
Ans. there are three files as img, aux and rrd. Img is the image file, aux is auxiliary (AUX or AUX.XML) file accompanies the raster in the same location and stores any auxiliary information that cannot be stored in the raster file itself. And rrd is reduced resolution dataset file created When zooming is required.

Que. What is GIS premitives?
Ans. point, line and polygon.

Que. What is pixel?
Ans. The smallest unit of information in an image or raster map, usually square or rectangular. Pixel is often used synonymously with cell.

Que. What is overlay analysis?
Ans. Overlay is a GIS operation that superimposes multiple data sets (representing different themes) together for the purpose of identifying relationships between them. An overlay creates a composite map by combining the geometry and attributes of the input data sets. Tools are available in most GIS software for overlaying both Vector or raster data.

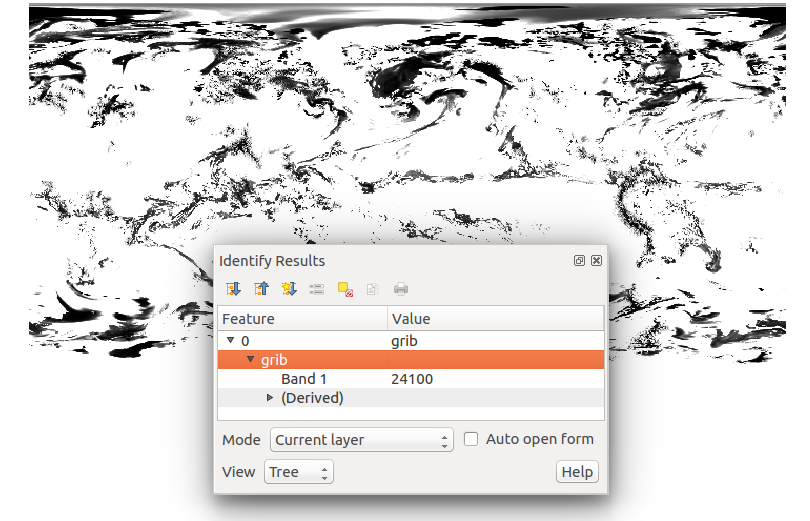
Que. can we see each pixel value in arcmap software?
Ans. The Pixel Inspector tool is used to view the pixel values of your raster dataset When displayed in ArcMap. 

Que. Name commonly used tools in arcmap for analysis purpose.
Ans. Overlay analysis, Proximity analysis, Table analysis and management, Surface creation and analysis and Selecting and Extracting data.

Que. What extract tool does?
Ans. The Extract tools let you select features and attributes in a feature class or table based on a query (SQL expression) or spatial extraction. The output features and attributes are stored in a feature class or table.

Que. Why we use overlay tool?
Ans. The Overlay toolset contains tools to overlay multiple feature classes to combine, erase, modify, or update spatial features, resulting in a new feature class.

Que. What is feature class?
Ans. In ArcGIS, a collection of geographic features with the same geometry type (such as point, line, or polygon), the same attributes, and the same spatial reference. Featureclasses can be stored in geodatabases, shapefiles, coverages, or other data formats.

Que. Why we use proximity tool?
Ans. The Proximity toolset contains tools that are used to determine the proximity of features within one or more feature classes or between two feature classes. 

Que. Why we use statistics tool?
Ans. The Statistics toolset contains tools that perform standard statistical analysis (such as mean, minimum, maximum, and standard deviation) on attribute data as well as tools that calculate area, length, and count statistics for overlapping and neighboring features.

Que. Why we use conversion tool?
Ans. The Conversion toolbox contains tools that convert data between various formats.

Que. What is iteration?
Ans. repetition of a mathematical or computational procedure applied to the result of a previous application, typically as a means of obtaining successively closer approximations to the solution of a problem.

Que. What to do When a task need to repeat multiple time?
Ans. we can use modelBuilder tool.

Que. What is modelBiulder?
Ans. In ModelBuilder, you can iterate the entire model or just an individual process using Iterators.

Que. Explain spatial statistics toolbox.
Ans. The Spatial Statistics toolbox contains statistical tools for analyzing spatial distributions, patterns, processes, and relationships. 

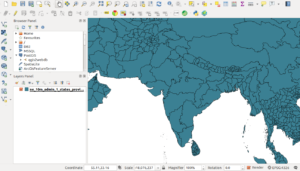
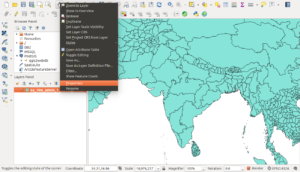
Que. can we edit shapefile in arcmap.
Ans. yes by enabling editing option.

Que. Explain editing tool.
Ans. The Editing tools allow you to apply bulk editing to all (or selected) features in a feature class.

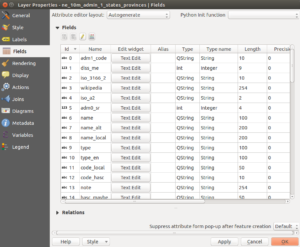
Que. What is attribute?
Ans. Non-spatial information about a geographic feature in a GIS, usually stored in a table and linked to the feature by a unique identifier.

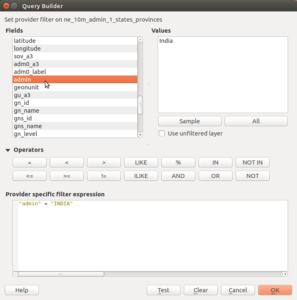
Que. What is attribute query?
Ans. An attribute query is the process of searching and retrieving records of features in a database based on desired attribute values.

Que. Define two type for query in arcmap?
Ans. select by attribute and select by location.

Que. What is spatial query?
Ans. A spatial query is a special type of database query supported by geo databases and spatial databases.

Que. What are the type of attribute in GIS
Ans. Attribute data can be store as one of five different field types in a table or database: character, integer, floating, date, and BLOB.

Que. What is pyramid?
Ans. Pyramids are used to improve performance. They are a downsampled version of the original raster dataset and can contain many downsampled layers. Each successive layer of the pyramid is downsampled at a scale of 2:1. 

Que. What is raster compression?
Ans. The primary benefit of compressing your data is to reduce the size of the file to help save disk space. An added benefit is greatly improved performance over a network, because you are transferring a reduced amount of the data being read from disk and transferred to the server or direct read application. 

Que. What is coverage?
Ans. A coverage is a georelational data model that stores vector data—it contains both the spatial (location) and attribute (descriptive) data for geographic features. Coverages use a set of feature classes to represent geographic features.

Que. What is TIN?
Ans. Triangular irregular networks (TIN) have been used by the GIS community for many years and are a digital means to represent surface morphology. TINs are a form of vector-based digital geographic data and are constructed by triangulating a set of vertices (points).

Que. What is topology?
Ans. Topology is the arrangement for how point, line, and polygon features share geometry.

Que. What is terrain?
Ans. A terrain dataset is a multiresolution, TIN-based surface built from measurements stored as features in a geodatabase. They’re typically made from lidar, sonar, and photogrammetric sources. Terrains reside in the geodatabase, inside feature datasets with the features used to construct them.

Que. What is KML?
Ans. Keyhole Markup Language (KML) is an XML-based format for storing geographic data and associated content and is an official Open Geospatial Consortium (OGC) standard. KML is a common format for sharing geographic data with non-GIS users as it can be easily delivered on the Internet and viewed in a number of free applications, including Google Earth and ArcGIS Explorer. KML files have either a .kml or .kmz (for compressed or zipped KML files) file extension.

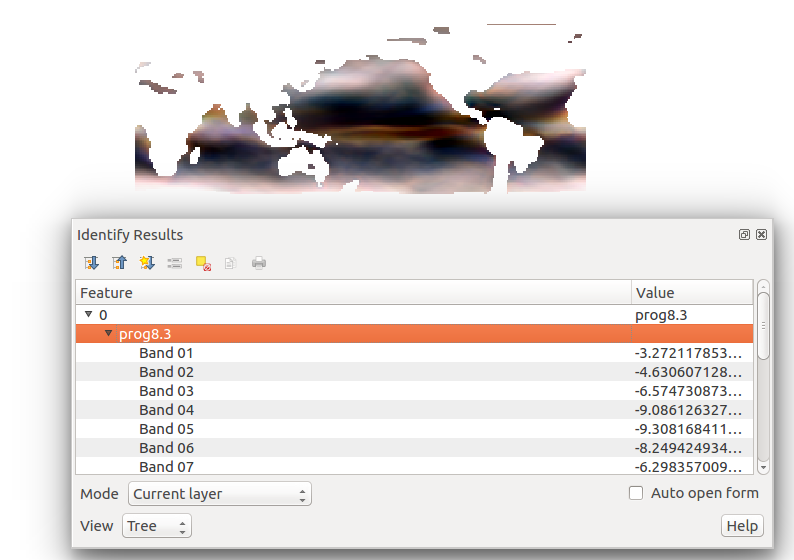
Que. What is netCDF?
Ans. NetCDF (network Common Data Form) is a file format for storing multidimensional scientific data (variables) such as temperature, humidity, pressure, wind speed, and direction. Each of these variables can be displayed through a dimension (such as time) in ArcGIS by making a layer or table view from the netCDF file.

Que. What is dimension?
Ans. Dimensions are a special kind of geodatabase annotation for showing specific lengths or distances on a map. A dimension may indicate the length of a side of a building or land parcel or the distance between two features such as a fire hydrant and the corner of a building.

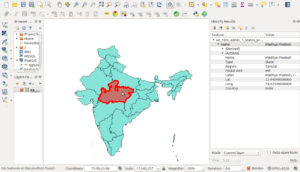
Que. What is arcmap?
Ans. ArcMap represents geographic information as a collection of layers and other elements in a map. Common map elements include the data frame containing map layers for a given extent plus a scale bar, north arrow, title, descriptive text, a symbol legend, and so on.

Que. What is report in arcgis?
Ans. Reports present the facts and figures behind your analysis and are invaluable companions to the maps you are creating. 

Que. What is geoprocessing?
Ans. Geoprocessing provides a large suite of tools for performing GIS tasks that range from simple buffers and polygon overlays to complex regression analysis and image classification.

Que. What is arcpy?
Ans. ArcPy is a site package that builds on (and is a successor to) the successful arcgisscripting module. Its goal is to create the cornerstone for a useful and productive way to perform geographic data analysis, data conversion, data management, and map automation with Python.

Que. can we create tool in arcMap?
Ans. yes, using arcpy we can create tool.

Que. What is color balancing?
Ans. Color balancing attempts to remove trends across images to make them look more seamless. Statistics must exist for the rasters within a mosaic dataset When using color balancing.

Que. What is data view?
Ans. In ArcMap data view, the map is the data frame. The active data frame is presented as a geographic window in Which map layers are displayed and used. 

Que. What is layout view?
Ans. The Layout view is used to design and author a map for printing, exporting, or publishing. You can manage map elements within the page space (typically, in inches or centimeters), add new map elements, and preview What your map will look like before exporting or printing it. Common map elements include data frames with map layers, scale bars, north arrows, symbol legends, map titles, text, and other graphic elements.

Que. Explain page layout.
Ans. A page layout is the arrangement of map elements and their overall design on a printed page or a digital map display. It is one of the primary display views that you work with in ArcMap—primarily to create maps for printing or for export and sharing using PDF.
arcPy
arcGIS+python

Que. Explain geoid.
Ans. The geoid is defined as the surface of the earth’s gravity field, Which is approximately the same as mean sea level. It is perpendicular to the direction of gravity pull. Since the mass of the earth is not uniform at all points, and the direction of gravity changes, the shape of the geoid is irregular.

Que. Explain spheroid?
Ans. A spheroid is a three-dimensional shape created from a two-dimensional ellipse. The ellipse is an oval, with a major axis (the longer axis) and a minor axis (the shorter axis). If you rotate the ellipse, the shape of the rotated figure is the spheroid.

Que. Explain datum?
Ans. A datum is built on top of the selected spheroid and can incorporate local variations in elevation. With the spheroid, the rotation of the ellipse creates a totally smooth surface across the world. Because this doesn’t reflect reality very well, a local datum can incorporate local variations in elevation.

Que. Explain geometric datum?
Ans. An earth-centred, or geocentric, datum uses the earth’s centre of mass as the origin. The most recently developed and widely used datum is WGS 1984.

Que. Explain local datum?
Ans. A local datum aligns its spheroid to closely fit the earth’s surface in a particular area. A point on the surface of the spheroid is matched to a particular position on the surface of the earth. This point is known as the origin point of the datum. The coordinates of the origin point are fixed, and all other points are calculated from it.

Que. What is projected coordinated system?
Ans. A projected coordinate system is defined on a flat, two-dimensional surface. Unlike a geographic coordinate system, a projected coordinate system has constant lengths, angles, and areas across the two dimensions. A projected coordinate system is always based on a geographic coordinate system that is based on a sphere or spheroid.

Que. What are the projection types are?
Ans. conic, cylinderical and planar

Que. Explain false easting?
Ans. False easting is a linear value applied to the origin of the x-coordinates. False northing is a linear value applied to the origin of the y-coordinates

Que. Define scale factor?
Ans. scale factor is a unitless value applied to the center point or line of a map projection.

Que. Define vertical coordinate system?
Ans. A vertical coordinate system defines the origin for height or depth values. Like a horizontal coordinate system, most of the information in a vertical coordinate system is not needed unless you want to display or combine a dataset with other data that uses a different vertical coordinate system.

Que. What is z value in gis?
Ans. One z-value is shown for the height-based mean sea level system. Any point that falls below the mean sea level line but is referenced to it will have a negative z-value. 

Que. What is vertical datum?
Ans. A vertical coordinate system (VCS) can be referenced to two different types of surfaces: spheroidal (ellipsoidal) or gravity-related (geoidal). Most vertical coordinate systems are gravity-related.

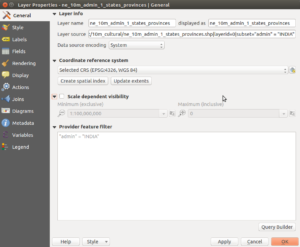
Que. What is geographic coordinate system
Ans. A geographic coordinate system uses a three-dimensional spherical surface to define locations on the earth. It includes an angular unit of measure, a prime meridian, and a datum (based on a spheroid). In a geographic coordinate system, a point is referenced by its longitude and latitude values.

Que. What is line referencing?
Ans. Linear referencing is the method of storing geographic locations by using relative positions along a measured linear feature. 

Que. What is data segmentation?
Ans. Dynamic segmentation is the process of computing the map locations of events stored and managed in an event table using a linear referencing measurement system and displaying them on a map. The term dynamic segmentation is derived from the concept that line features need not be split (in other words, “segmented”) each time an attribute value changes; you can “dynamically” locate the segment.

Que. What is arcpro?
Ans. ArcGIS Pro is the new application for creating and working with spatial data on your desktop. It provides tools to visualize, analyze, compile, and share your data, in both 2D and 3D environments.

Que. Define animation in GIS?
Ans. An animation is a visualisation of the changes to the properties of one object (such as a layer) or a set of objects (such as multiple layers). Animations make your documents come alive by storing actions so they can be replayed as you choose. 

I hope this Question answer might have helped you in understanding ArcGIS and in clearing the Basics interview question of ArcGIS. Let us know if you have any other list of questions answer available in ArcGIS by commenting below in the space provided.

Exit mobile version
%%footer%%