Geographic Information System is a system intends to capture, Store, manage, manipulate, analyze the data.
 In Geographic Information Systems (GIS), converting data from one format to another is crucial for ensuring compatibility across different platforms. CSV is a simple format for tabular data, while KMZ is a compressed version of KML, used to represent geographic data in applications like Google Earth and Google Maps. Converting CSV to KMZ allows you to visualize and share your data.
What is CSV File?
A CSV file (Comma-Separated Values) is a simple text file that stores data in a table format. Each line represents a row, and the values in each row are separated by commas, making it easy to organize and share information like a spreadsheet.
Key Concept for Conversion CSV to KMZ
The MAPOG Converter Tool is designed to make data conversion between various formats seamless and user-friendly. Below is a guide on how to convert CSV files to KMZ format using MAPOG.
Step-by-Step Guide to Converting CSV to KMZ
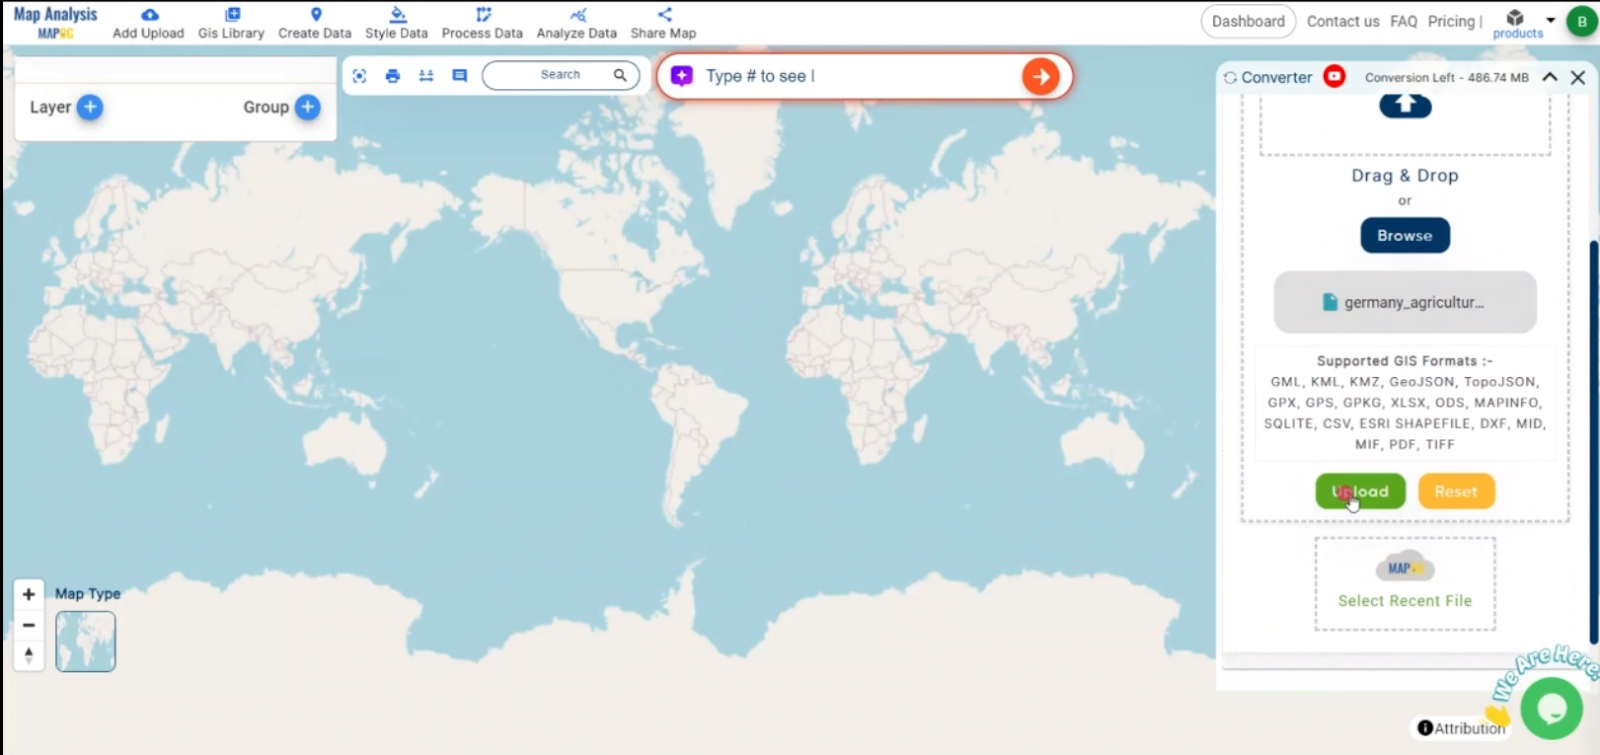
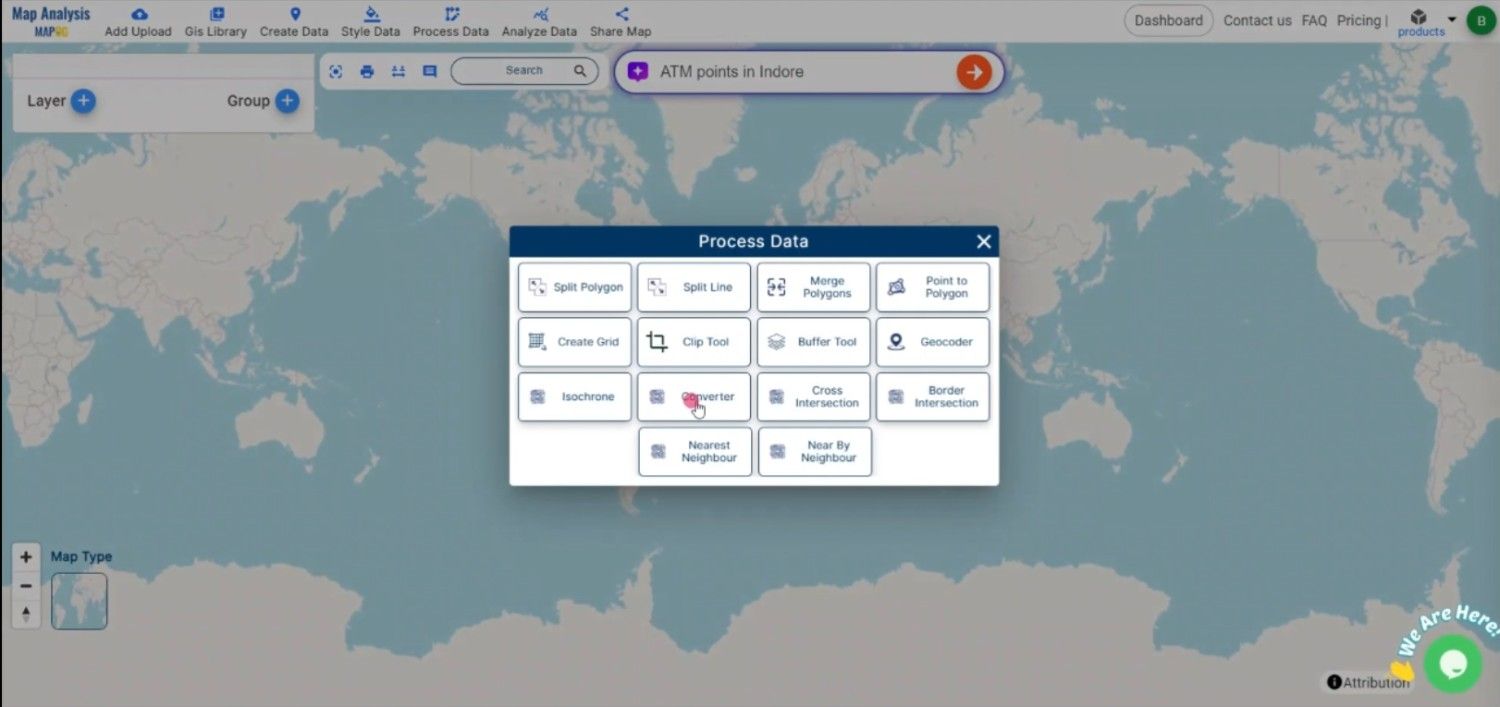
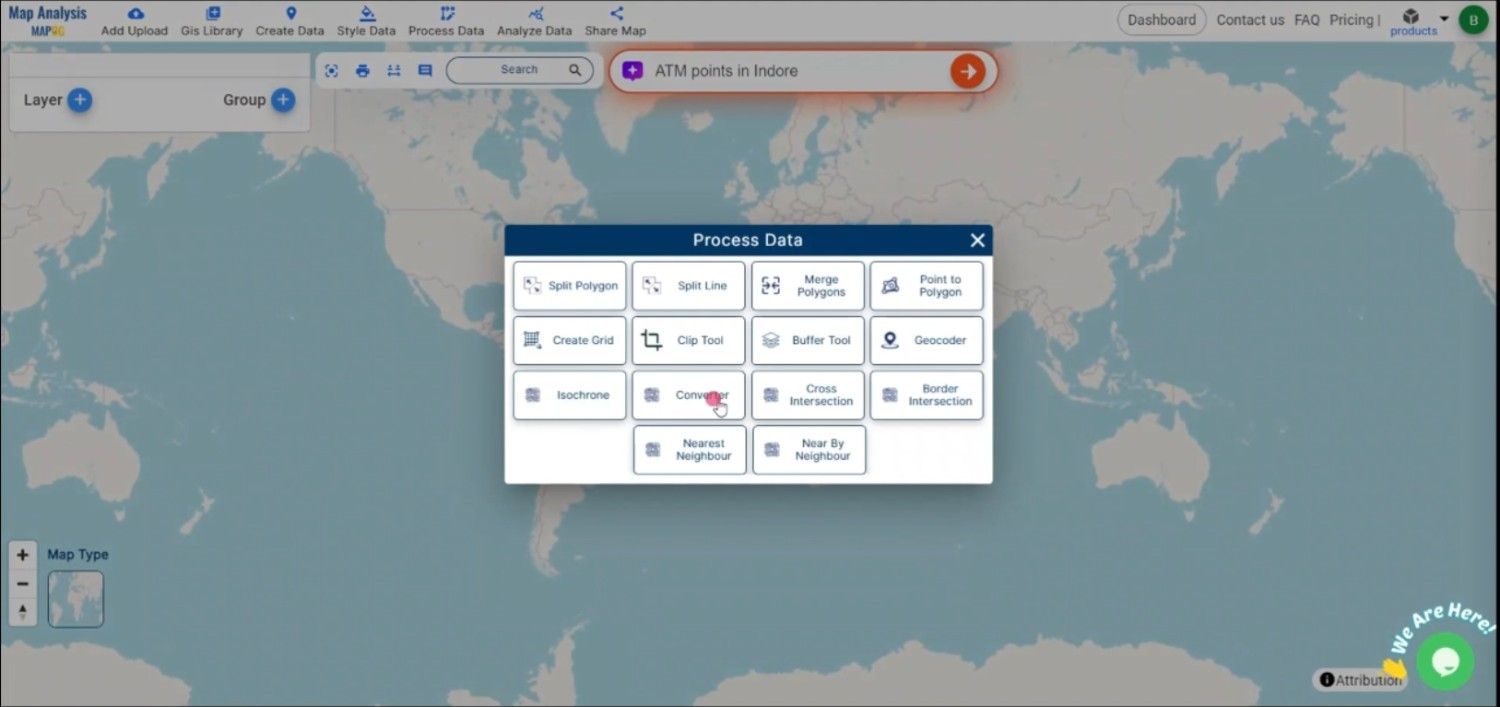
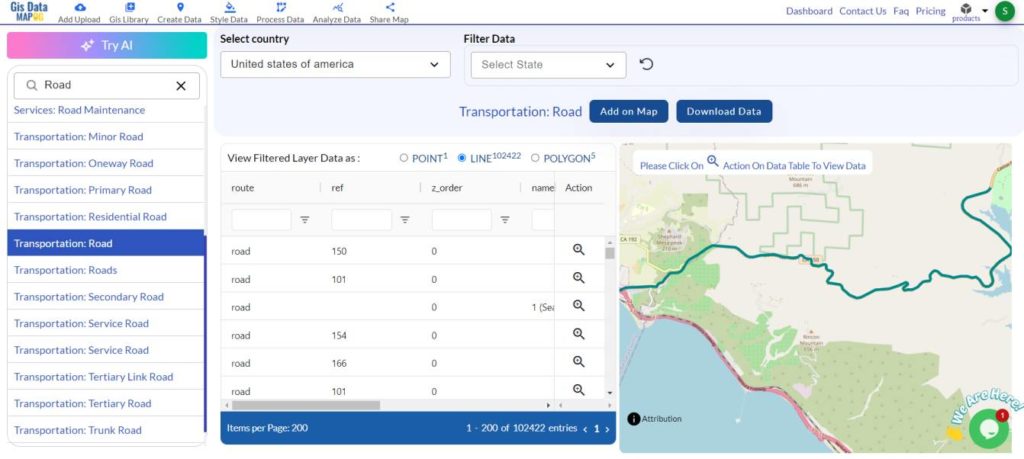
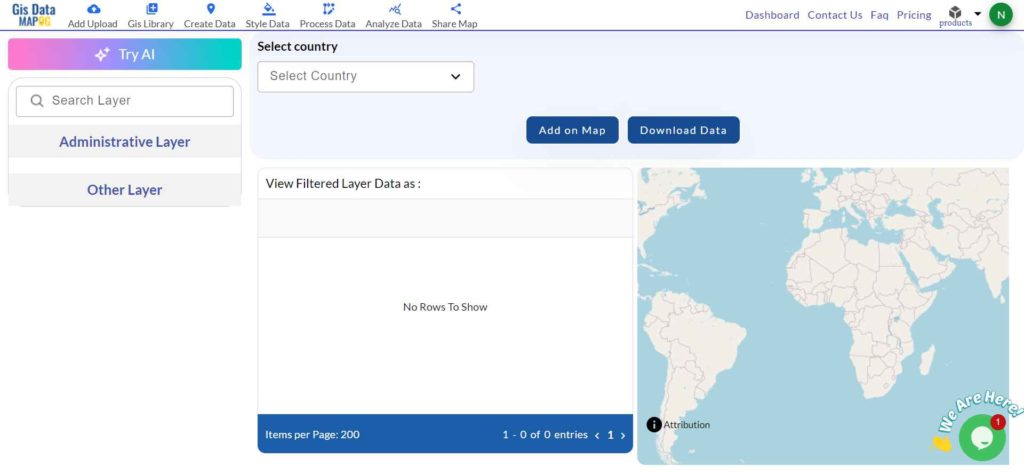
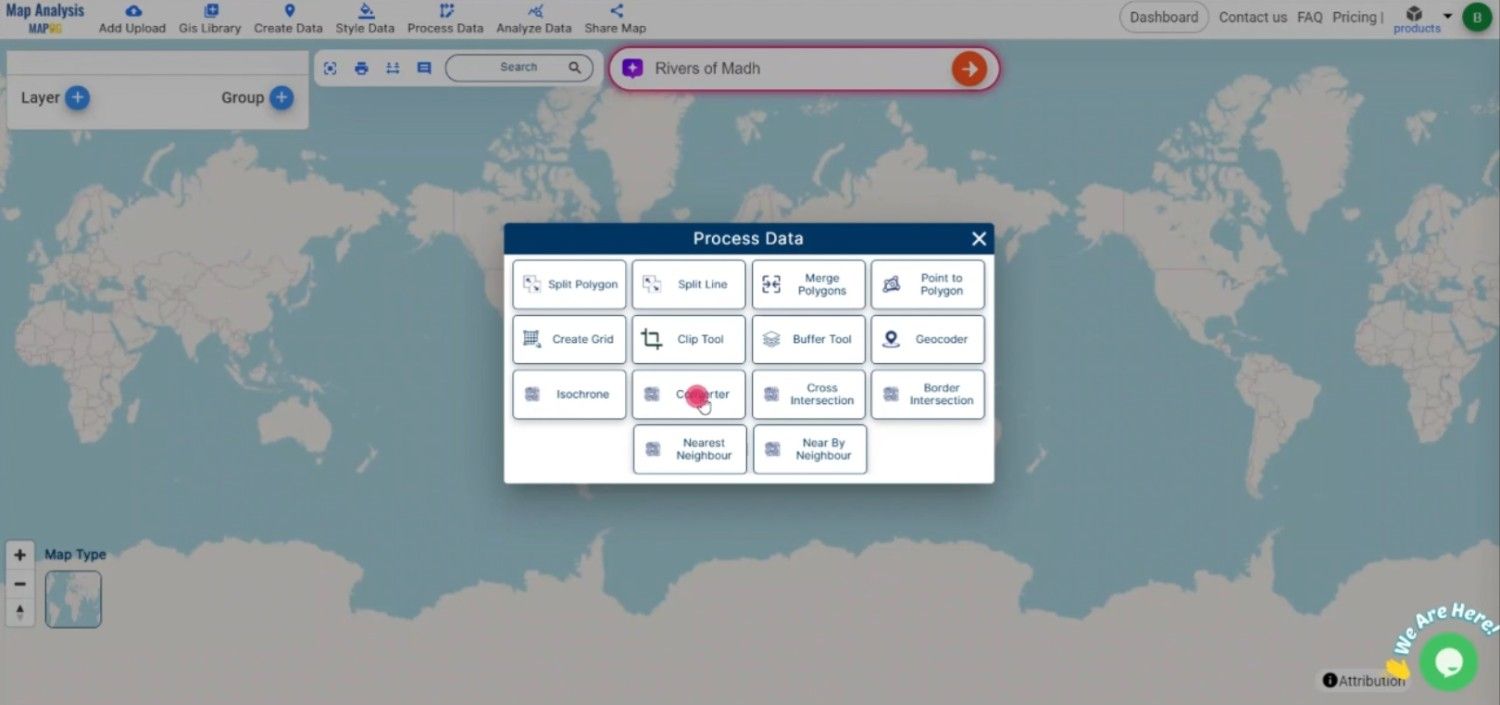
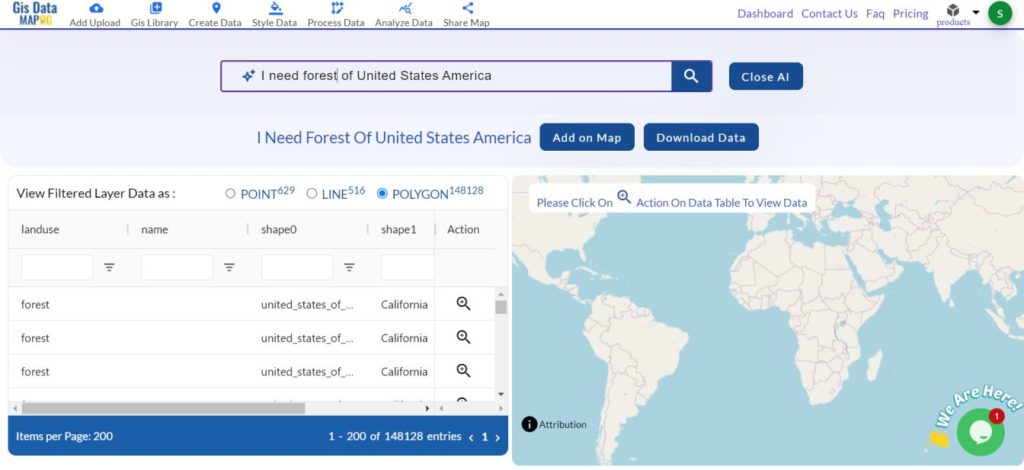
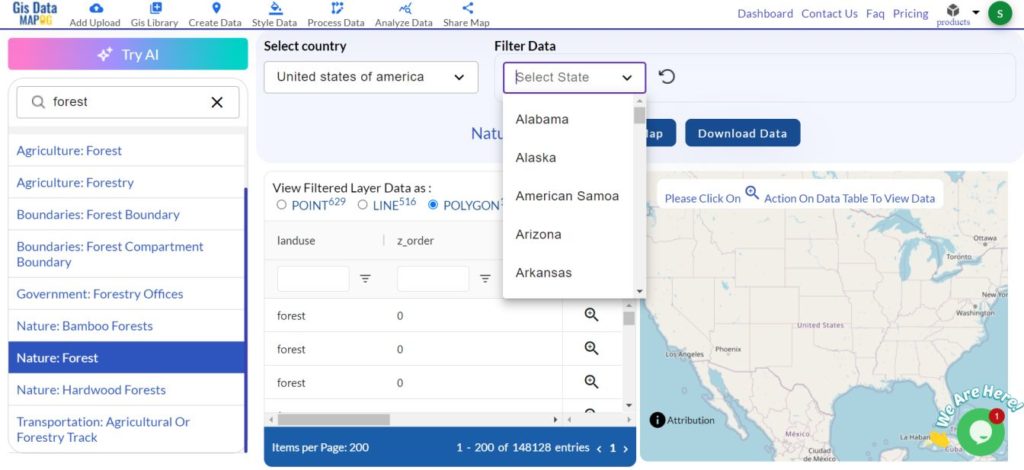
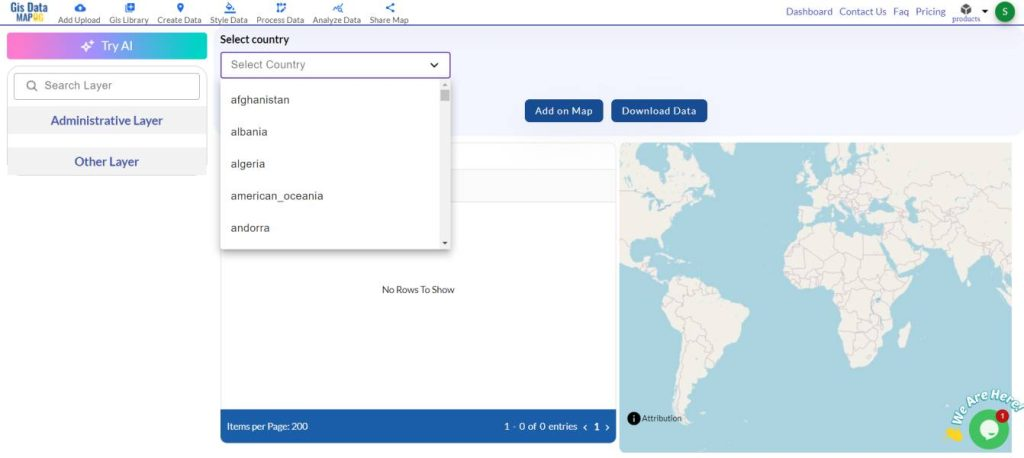
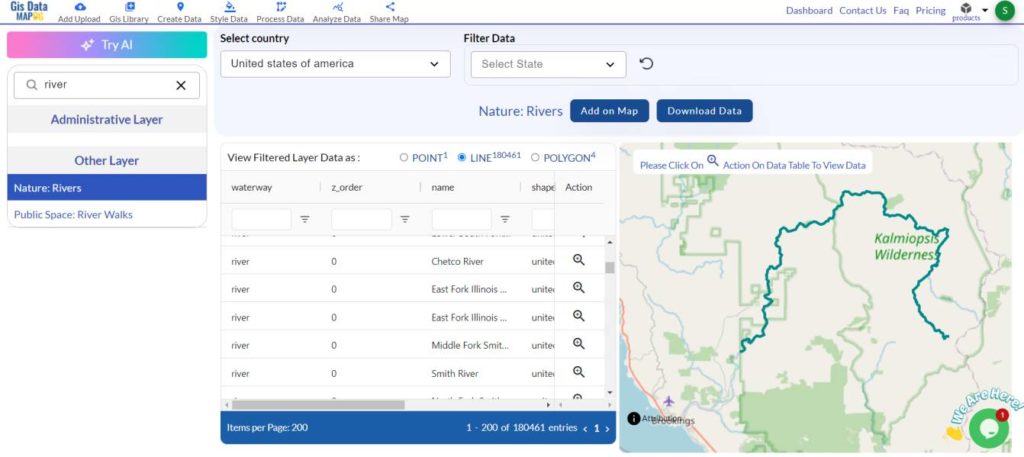
Step 1: Upload Your CSV Data
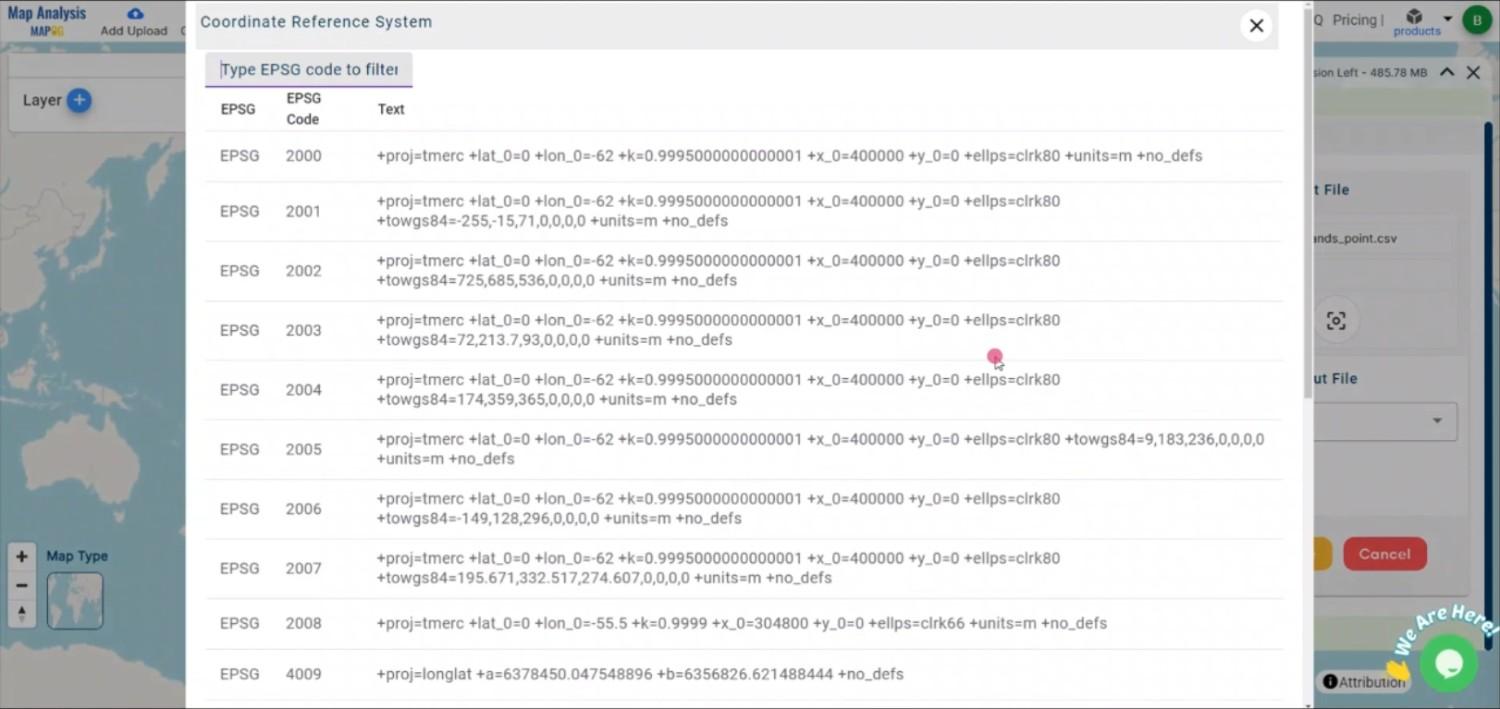
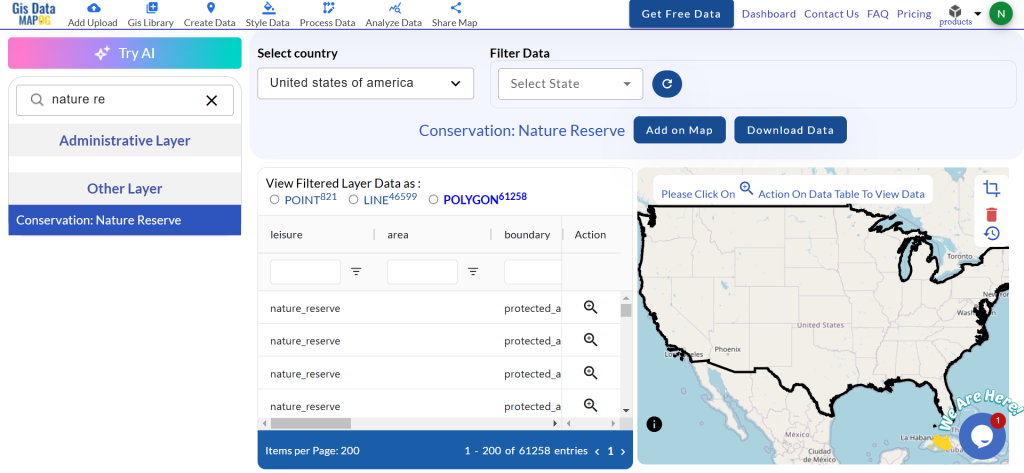
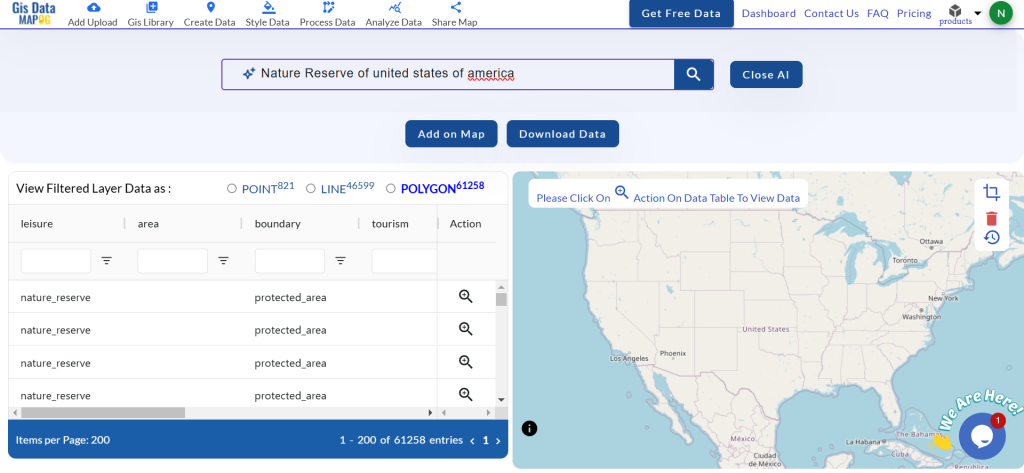
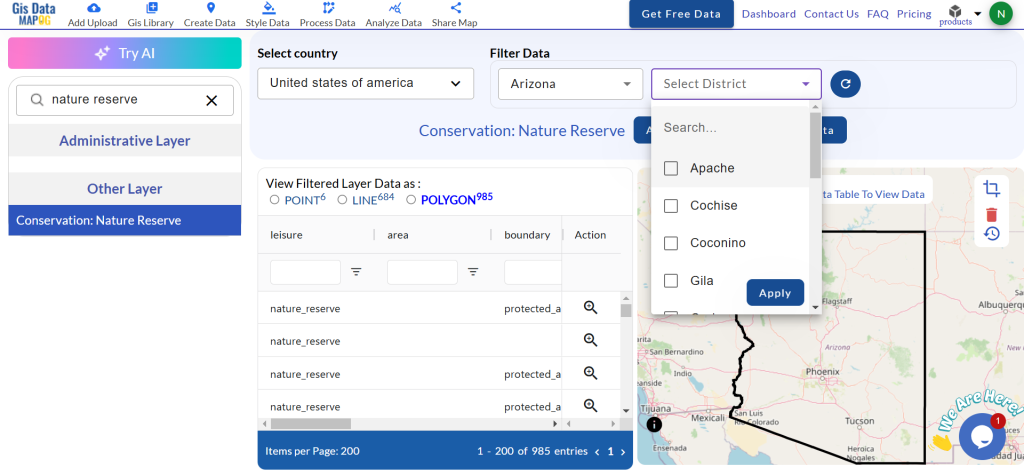
First, navigate to the “Process Data” section in MAPOG MapAnalysis and select the “Converter Tool” option. Ensure your CSV file is properly organized, with columns representing the necessary attributes such as coordinates and any additional data fields.
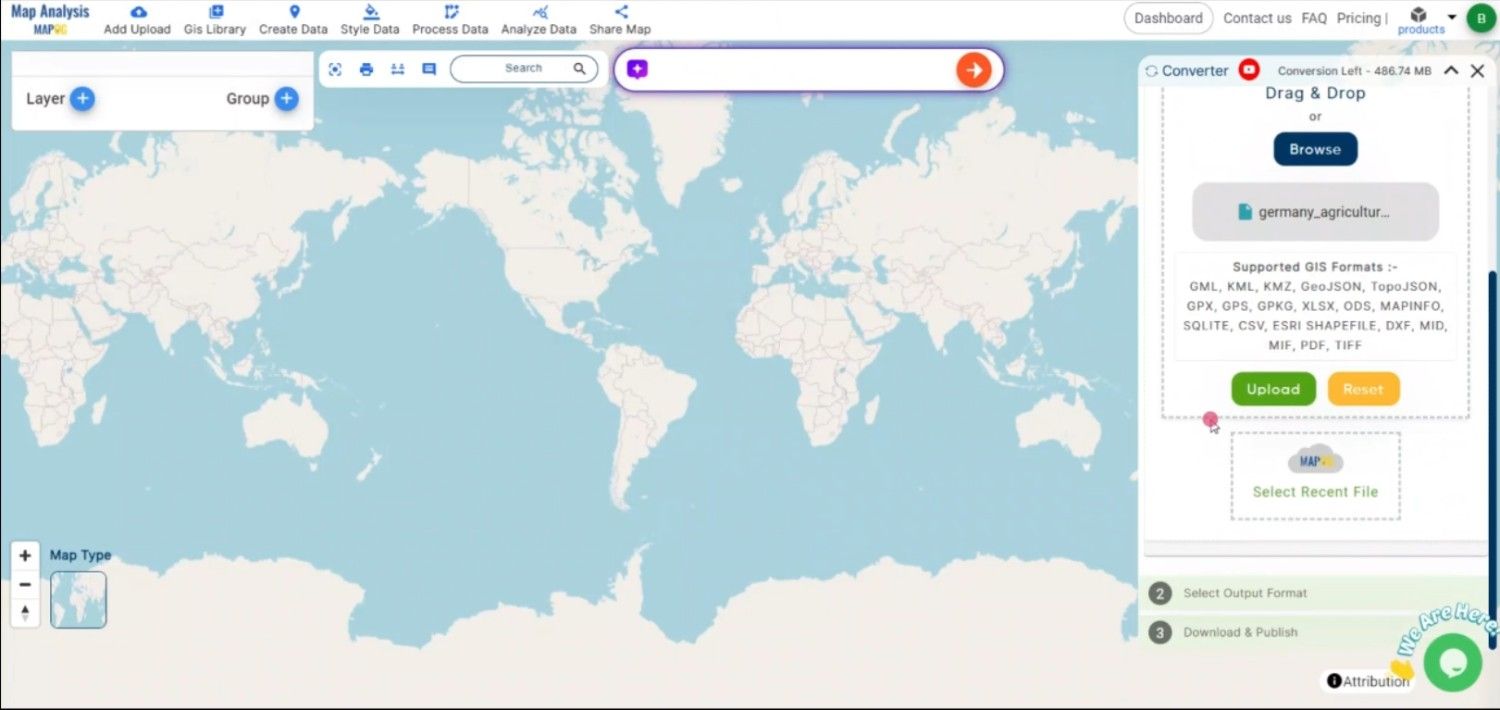
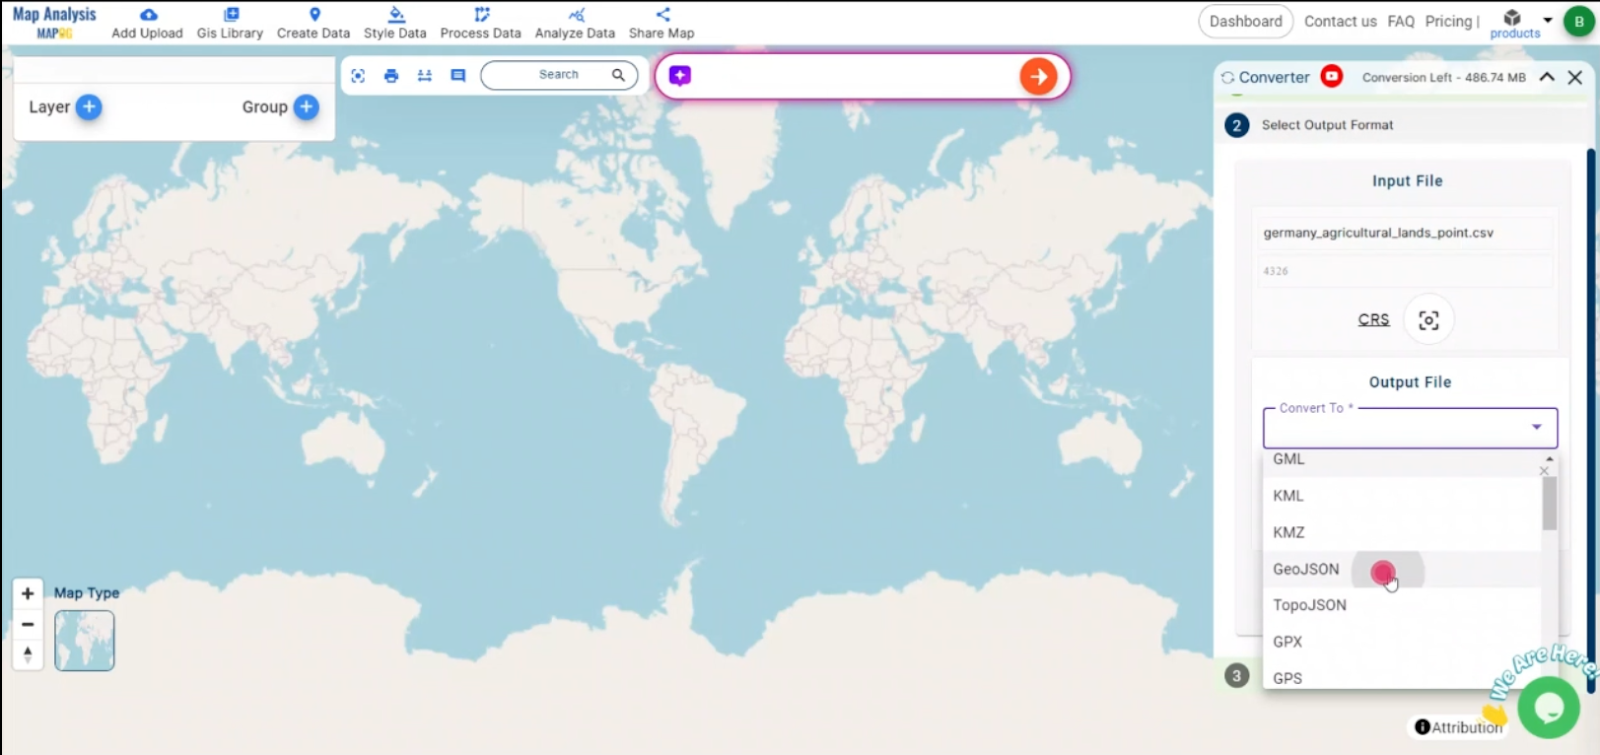
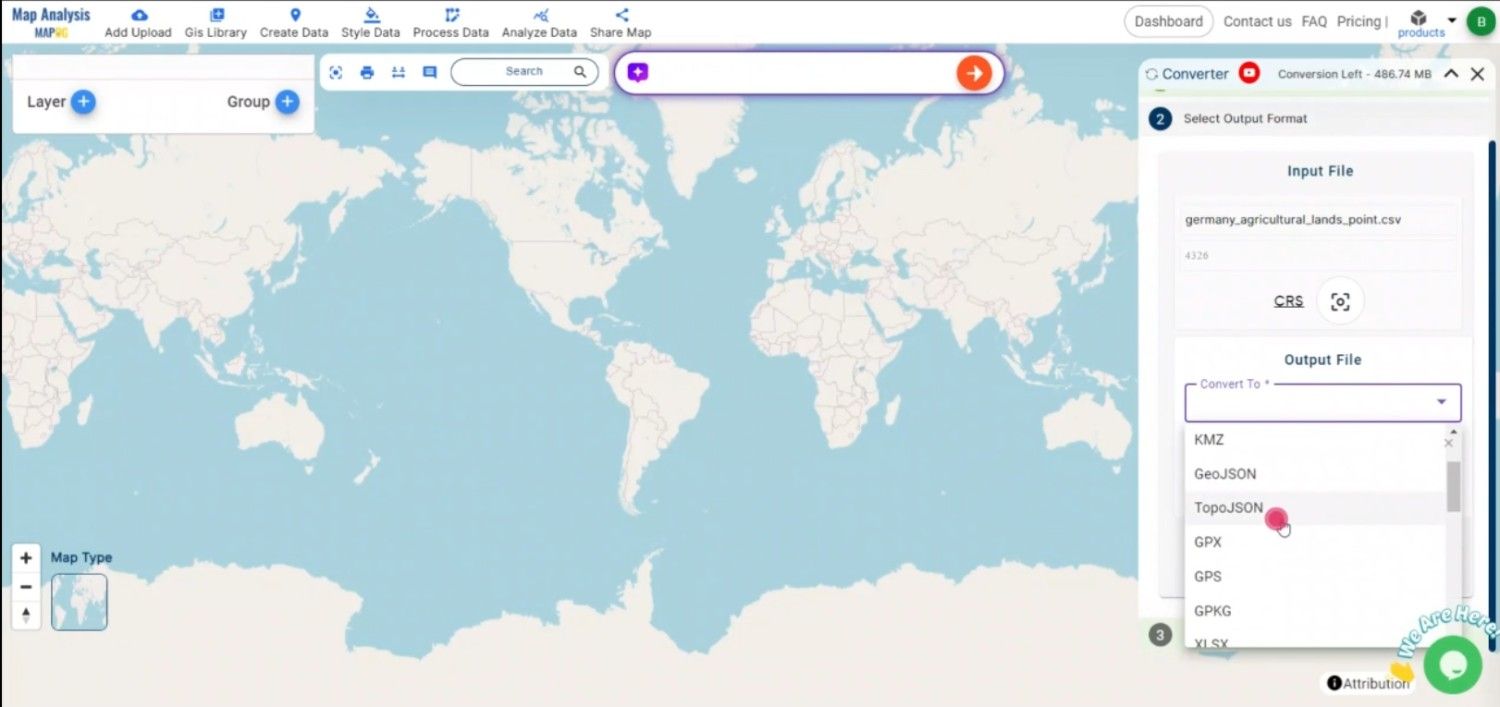
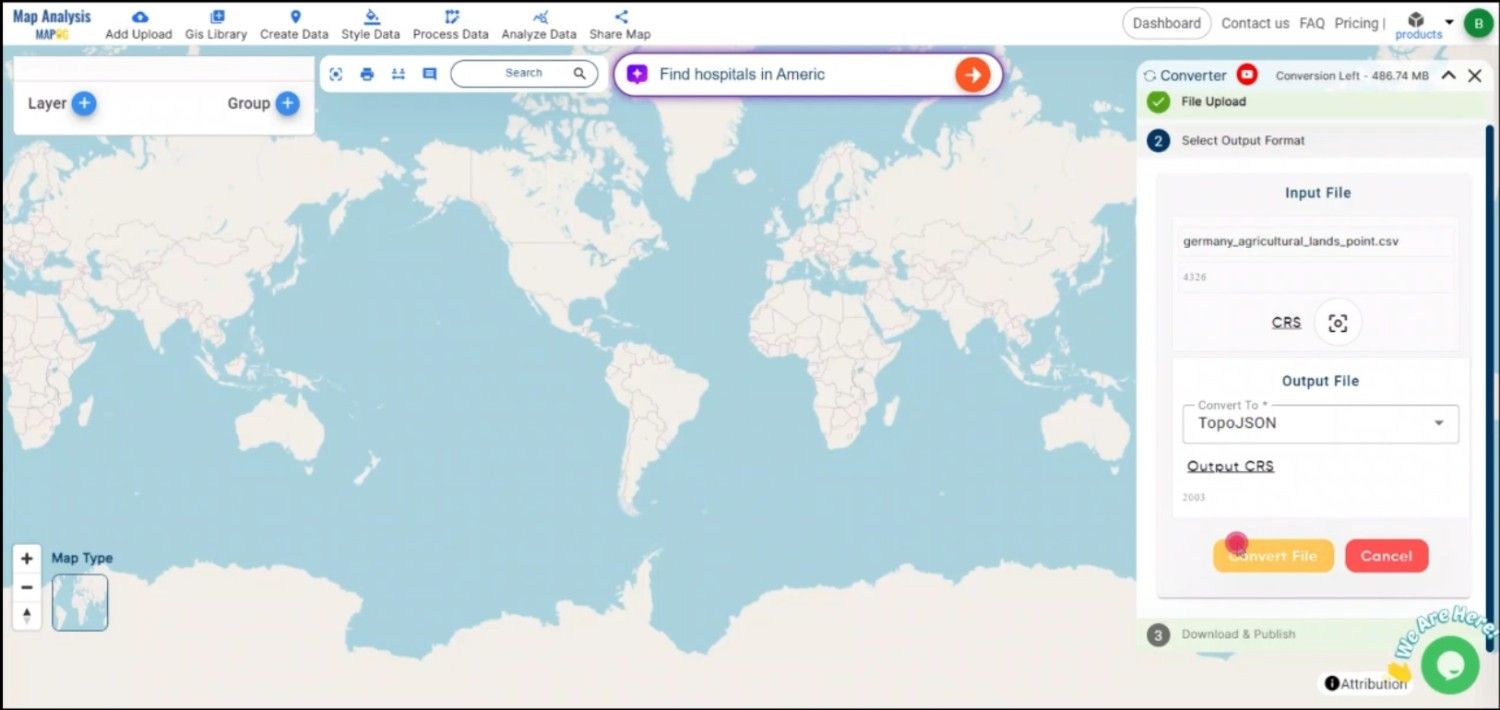
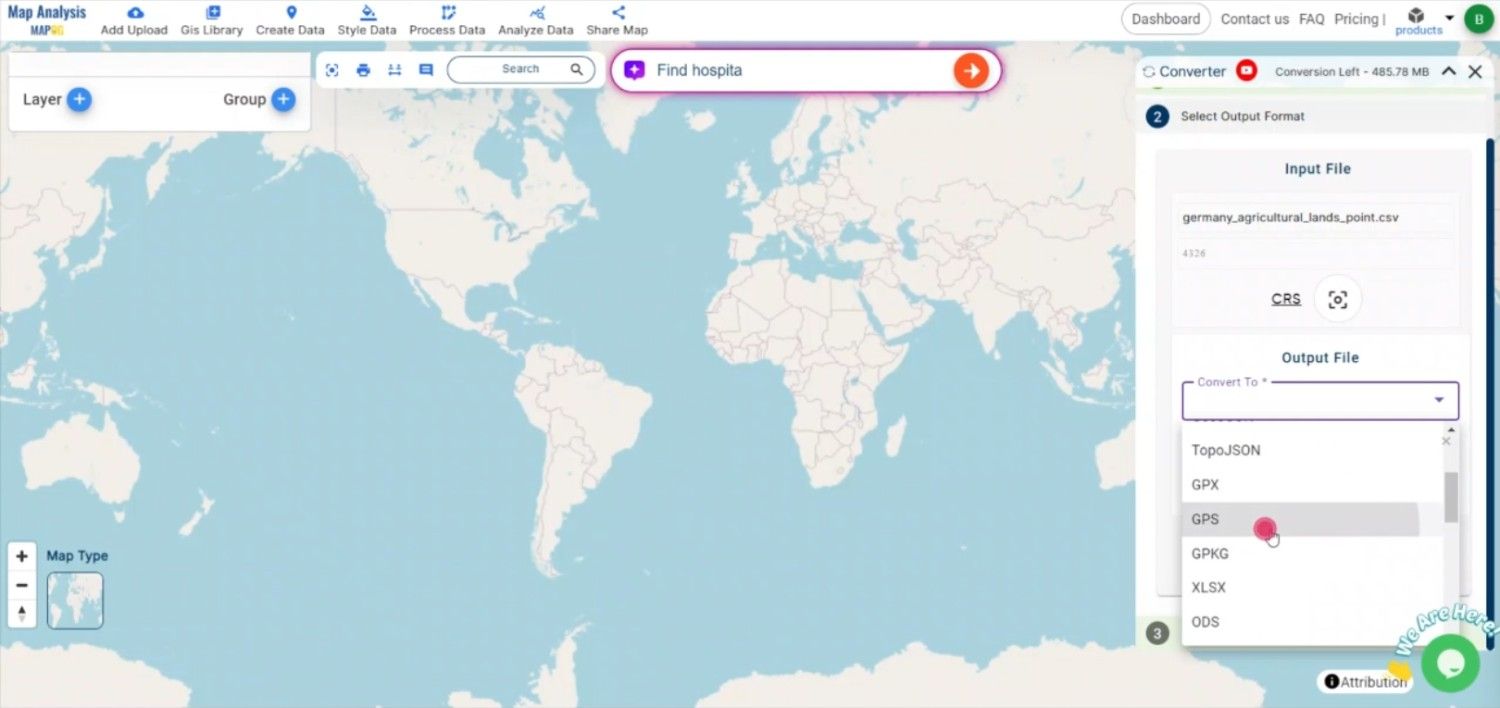
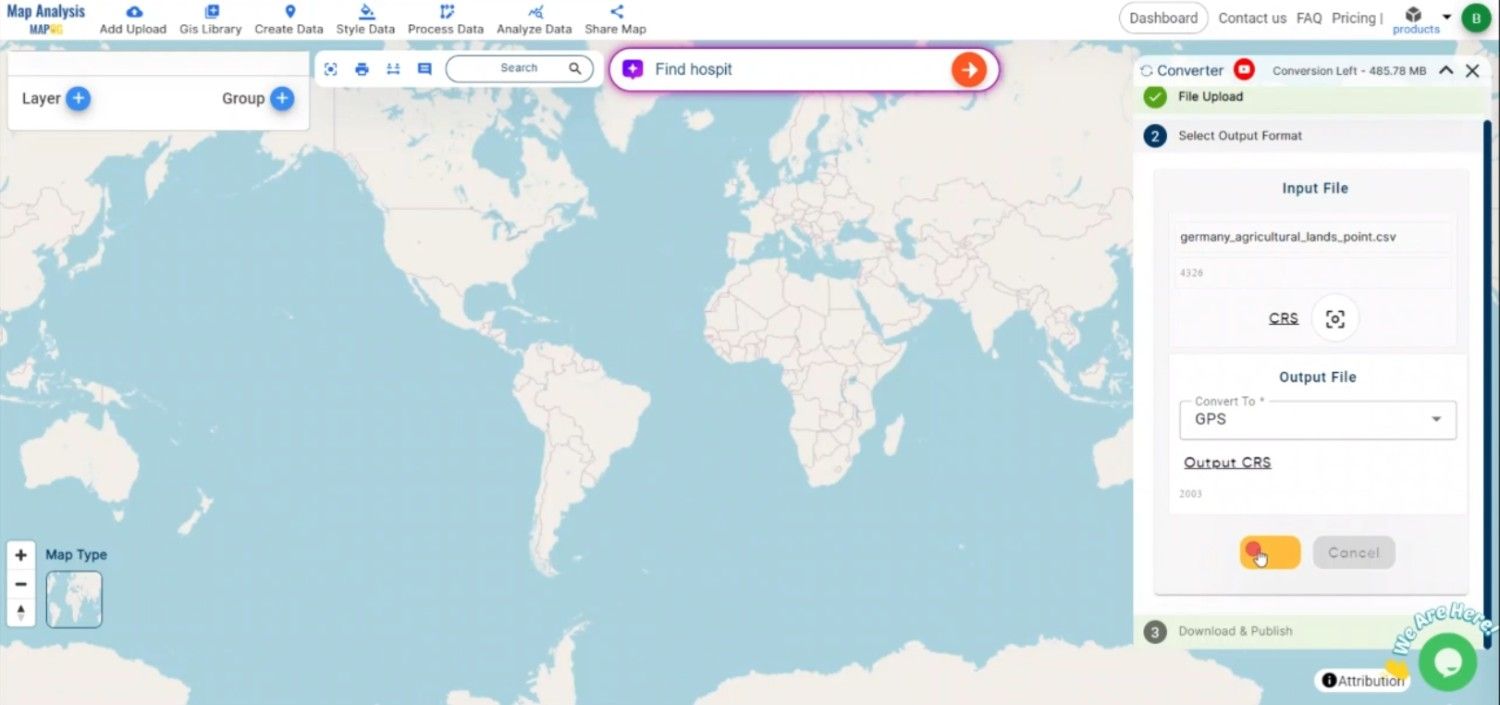
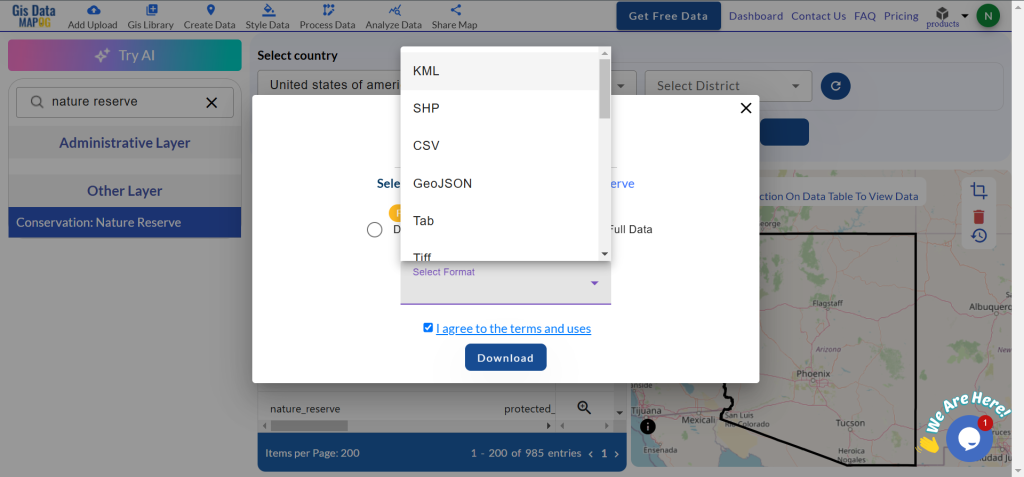
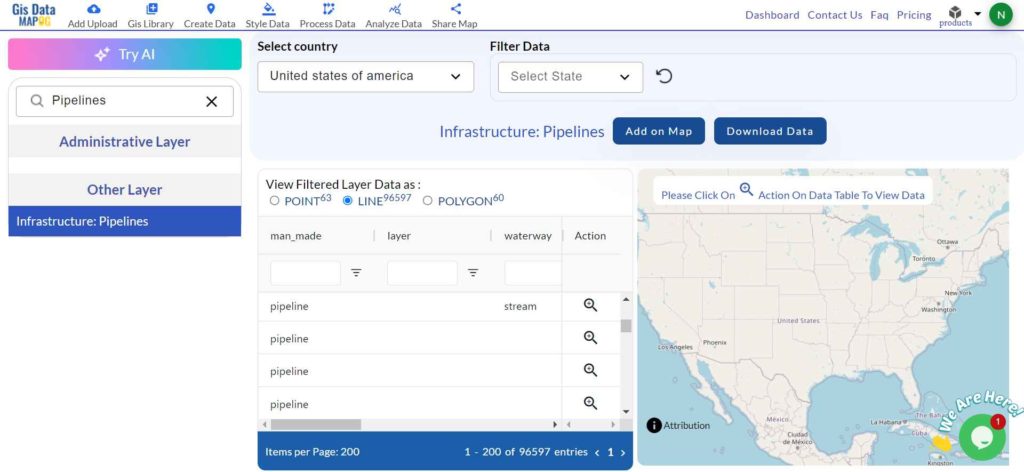
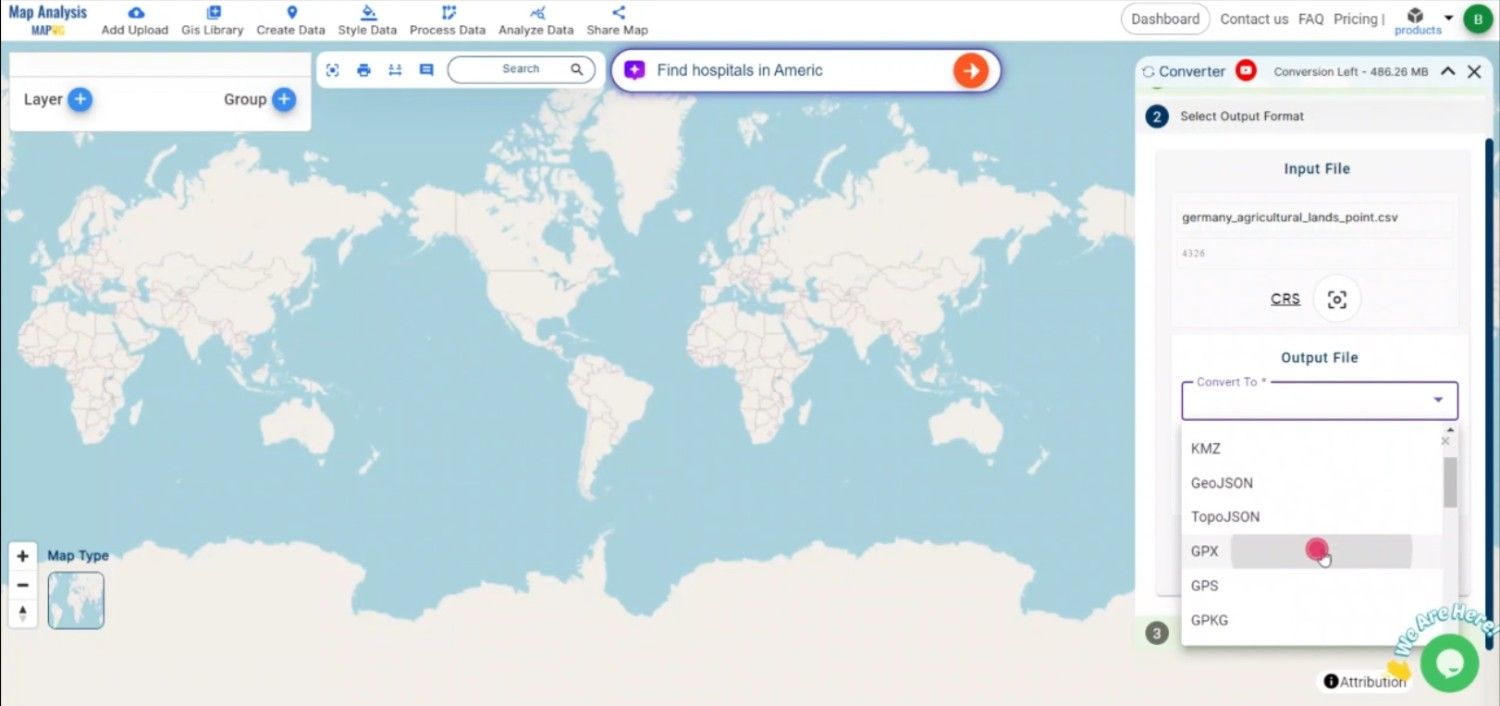
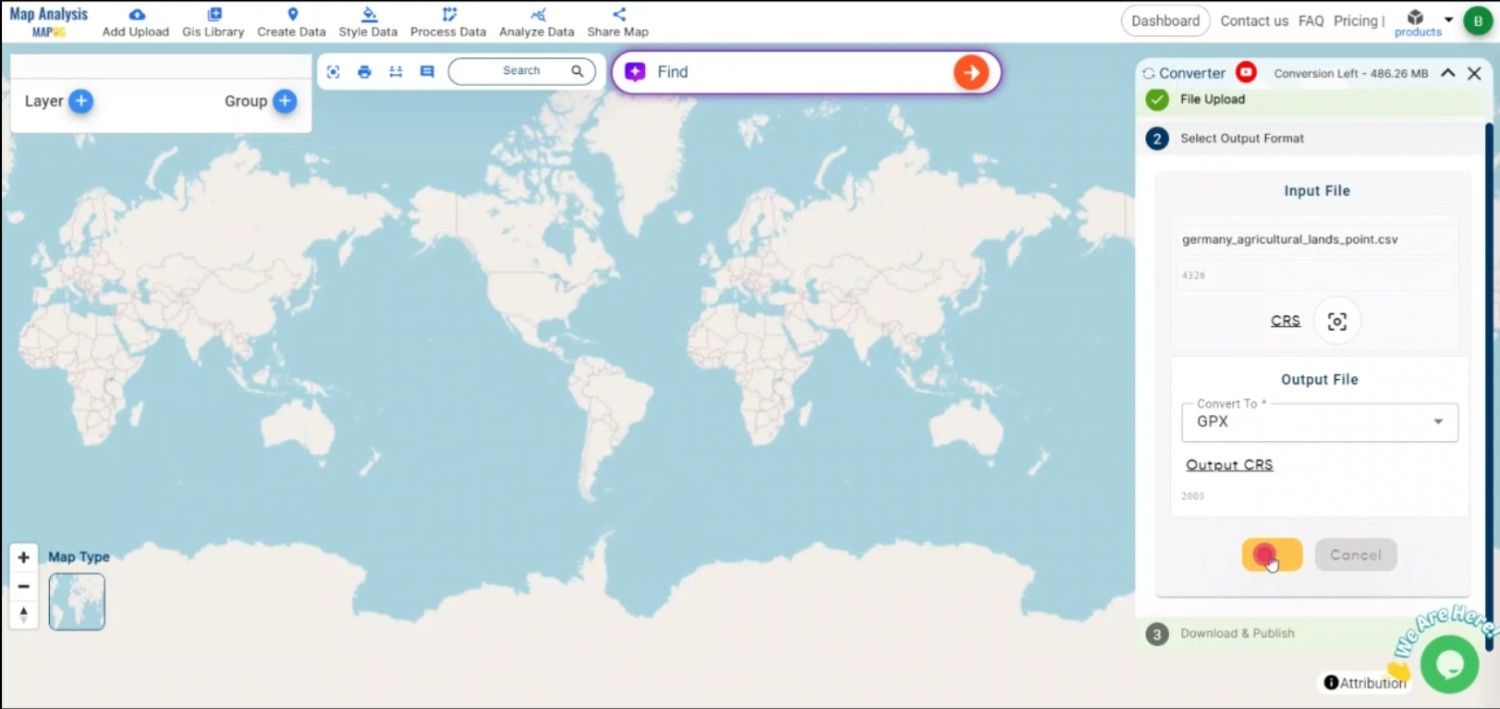
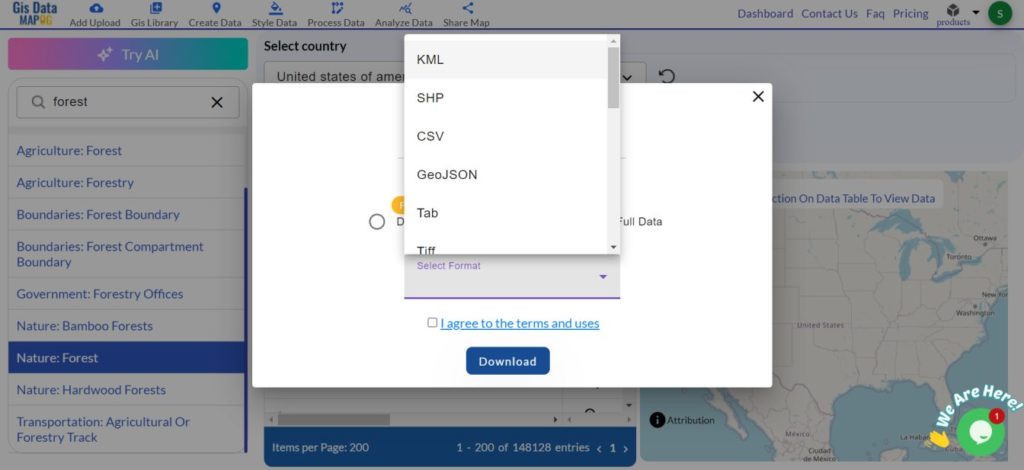
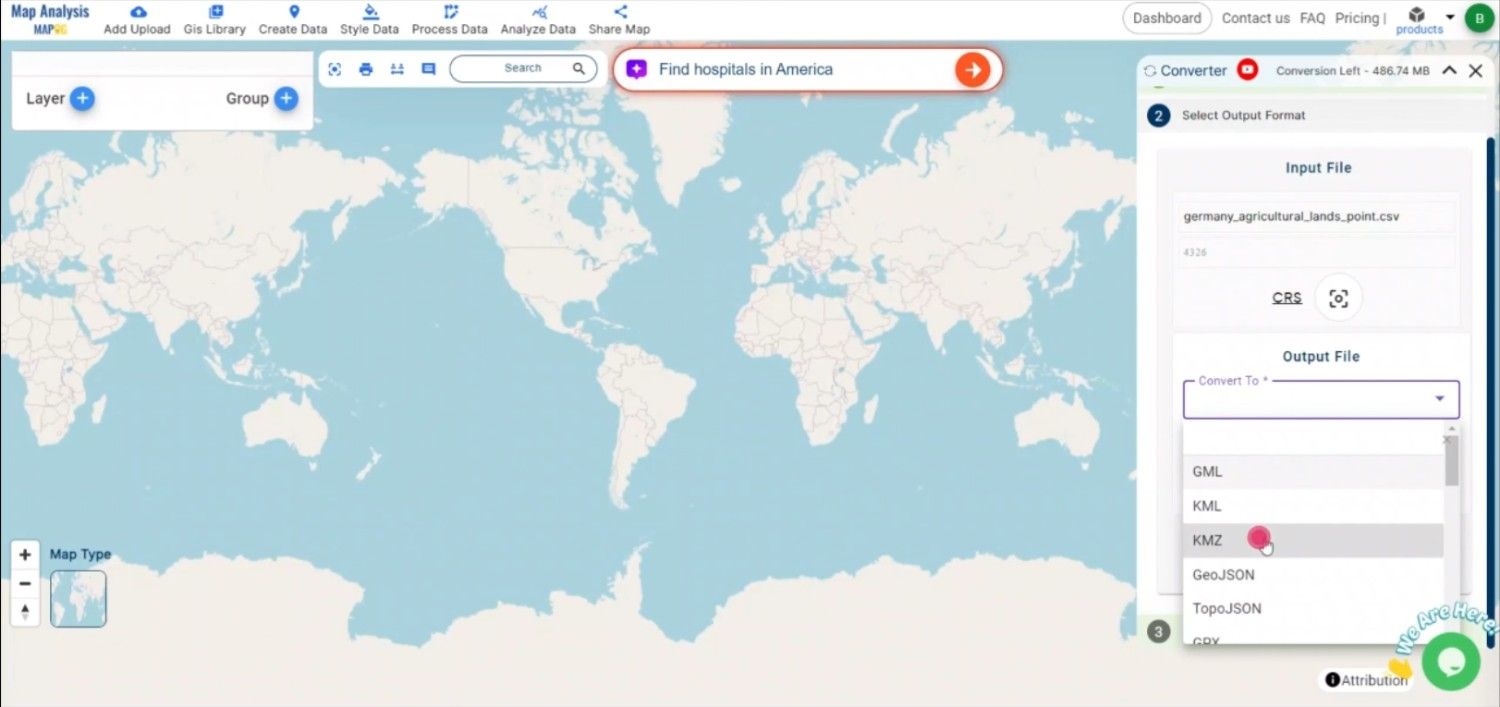
Step 2: Choose KMZ as the Output Format
From the list of available formats, select KMZ as the output. KMZ is ideal for compressing your geographic data into a single, portable file that can be easily shared and opened in Google Earth and similar platforms.
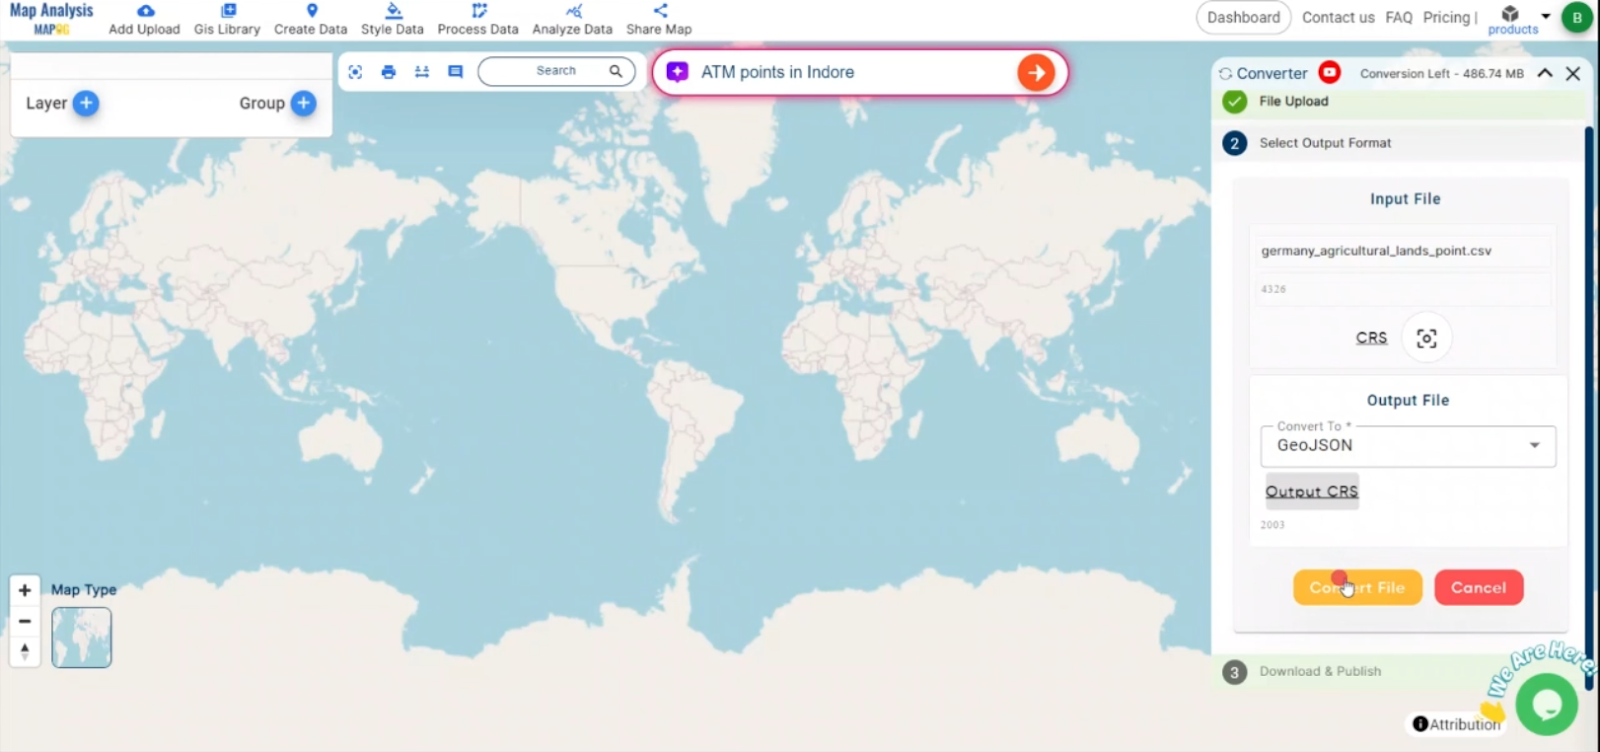
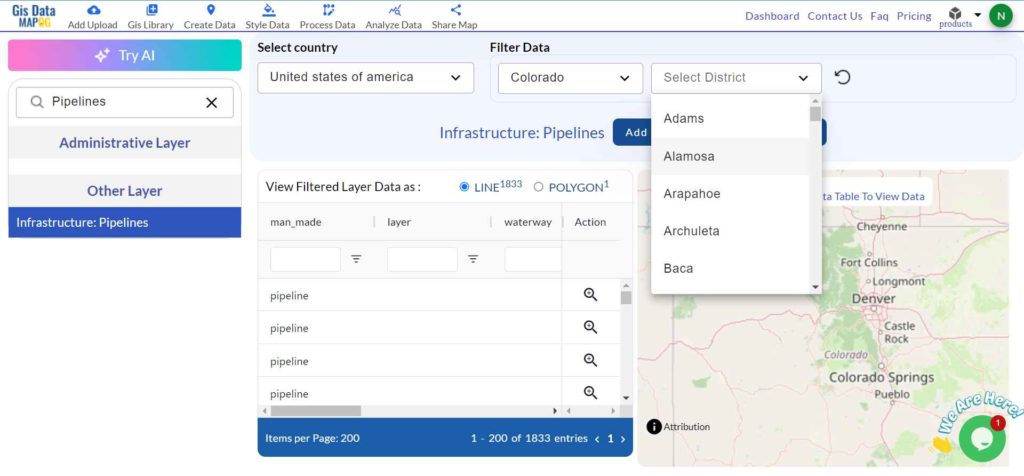
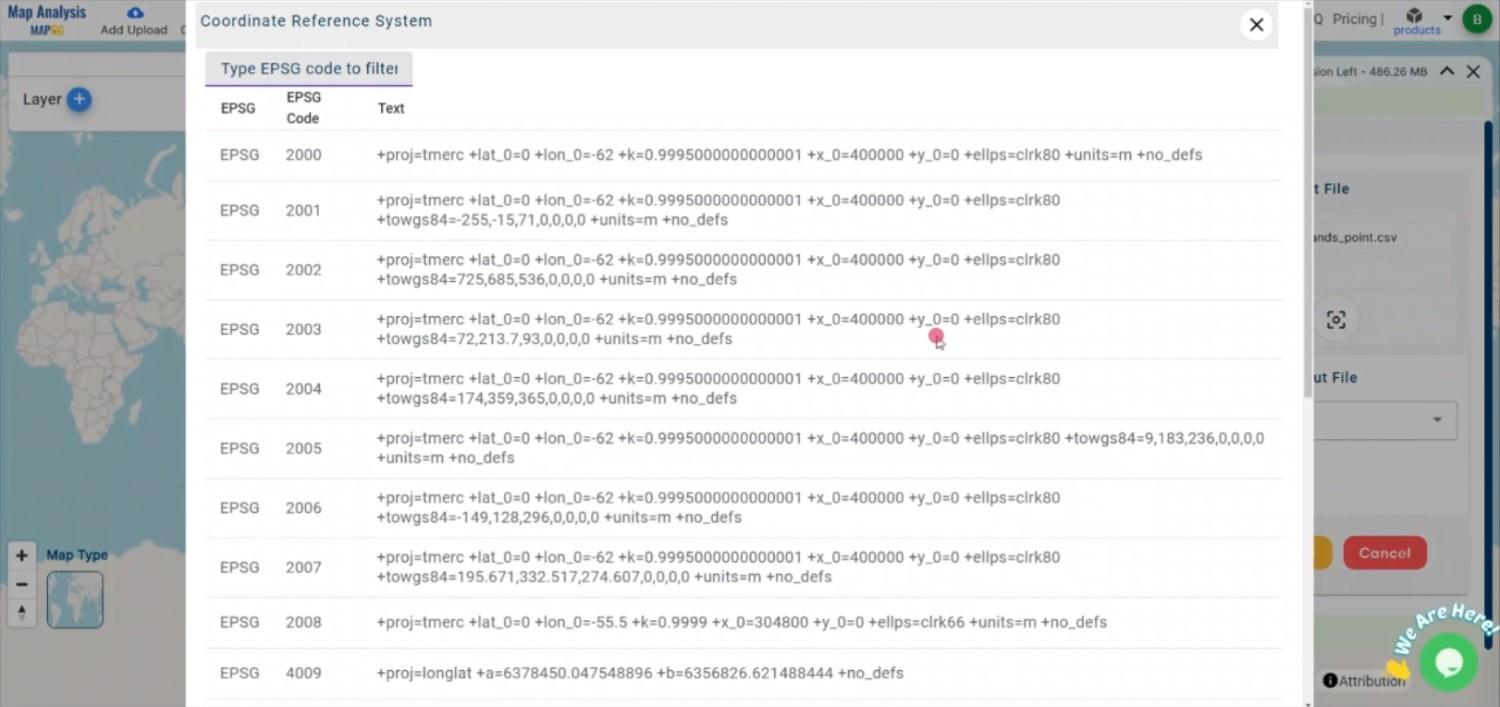
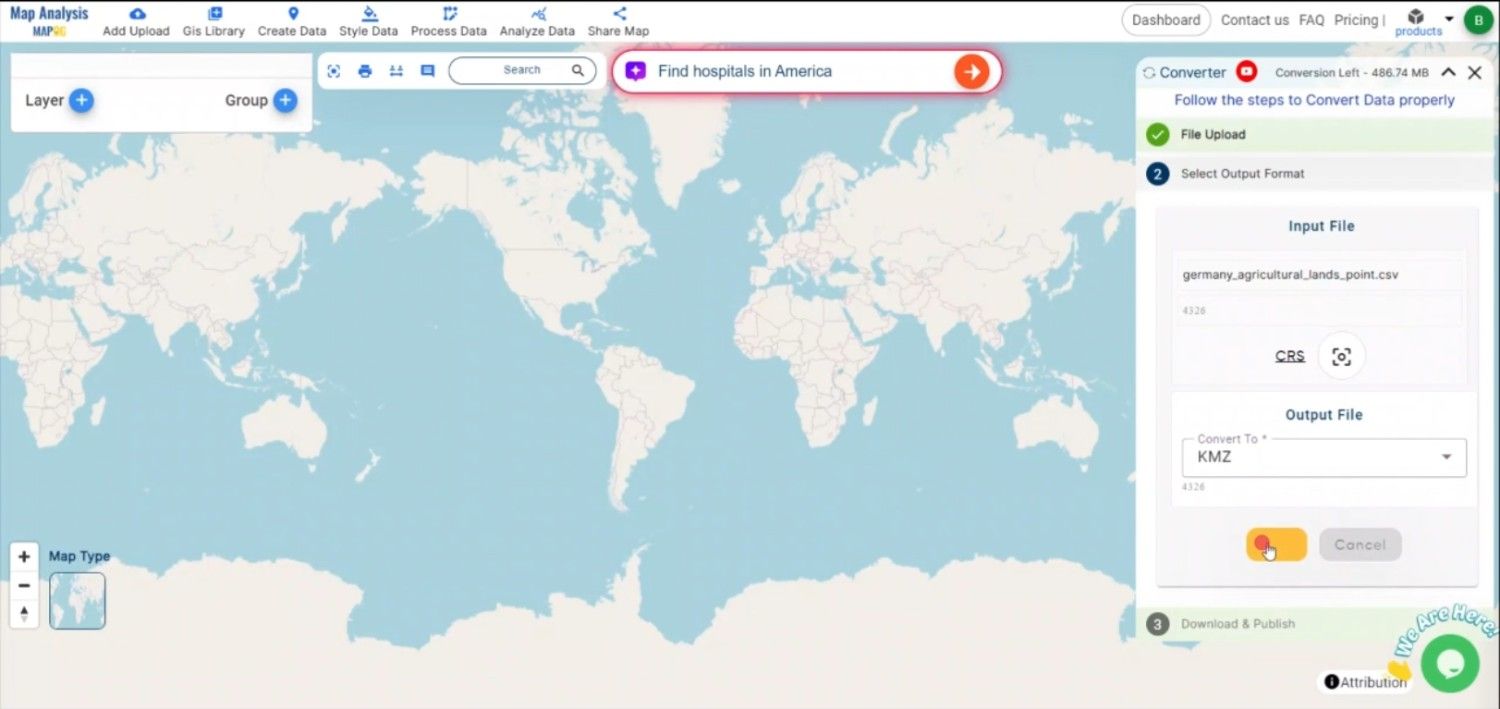
Step3: Execute the Conversion
Once you’ve selected KMZ as the output format and configured any additional settings, initiate the conversion by clicking the “Convert” button. The MAPOG tool will process your CSV file and generate a KMZ file that accurately represents the geographic data in a compressed format.
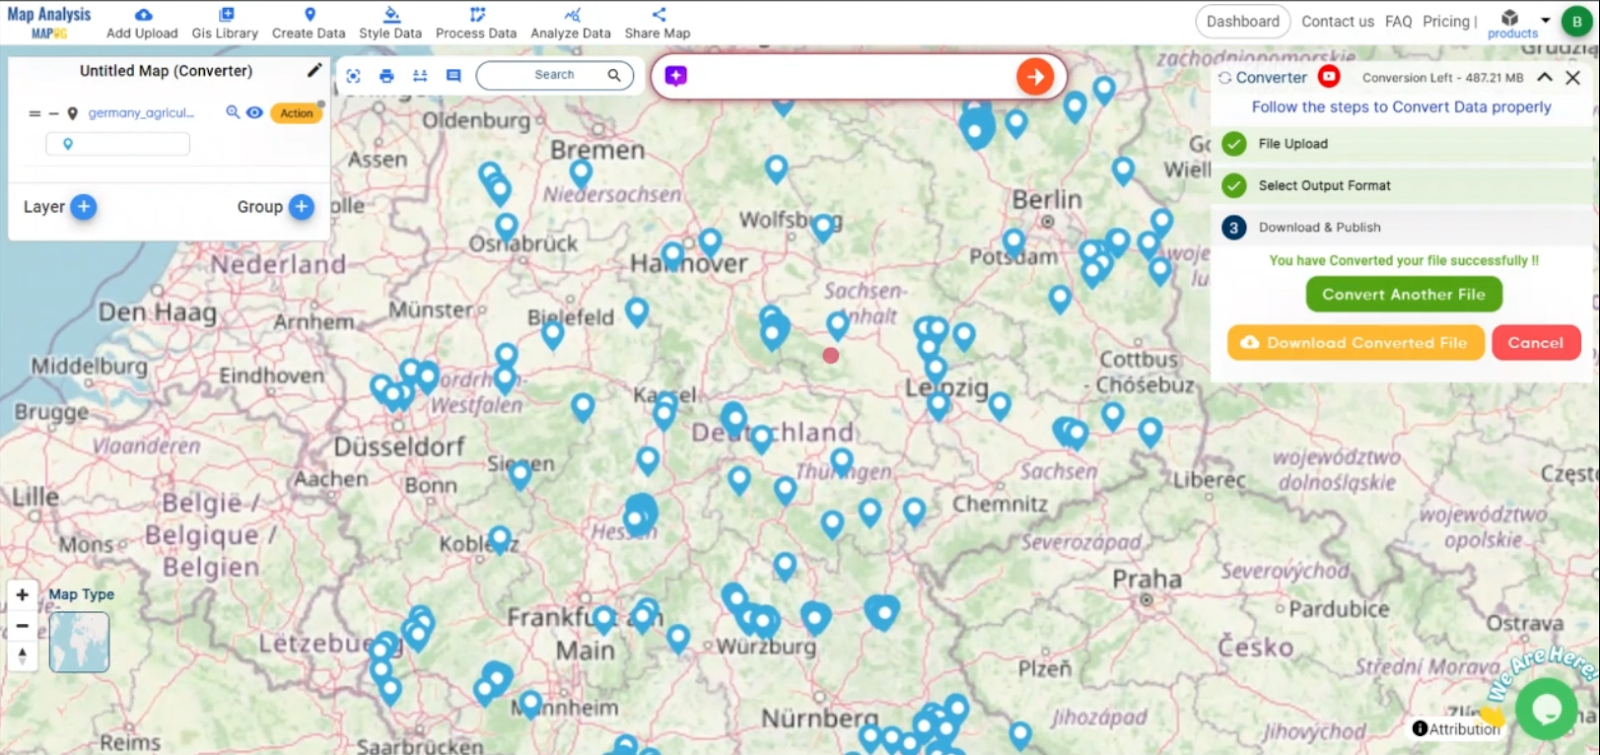
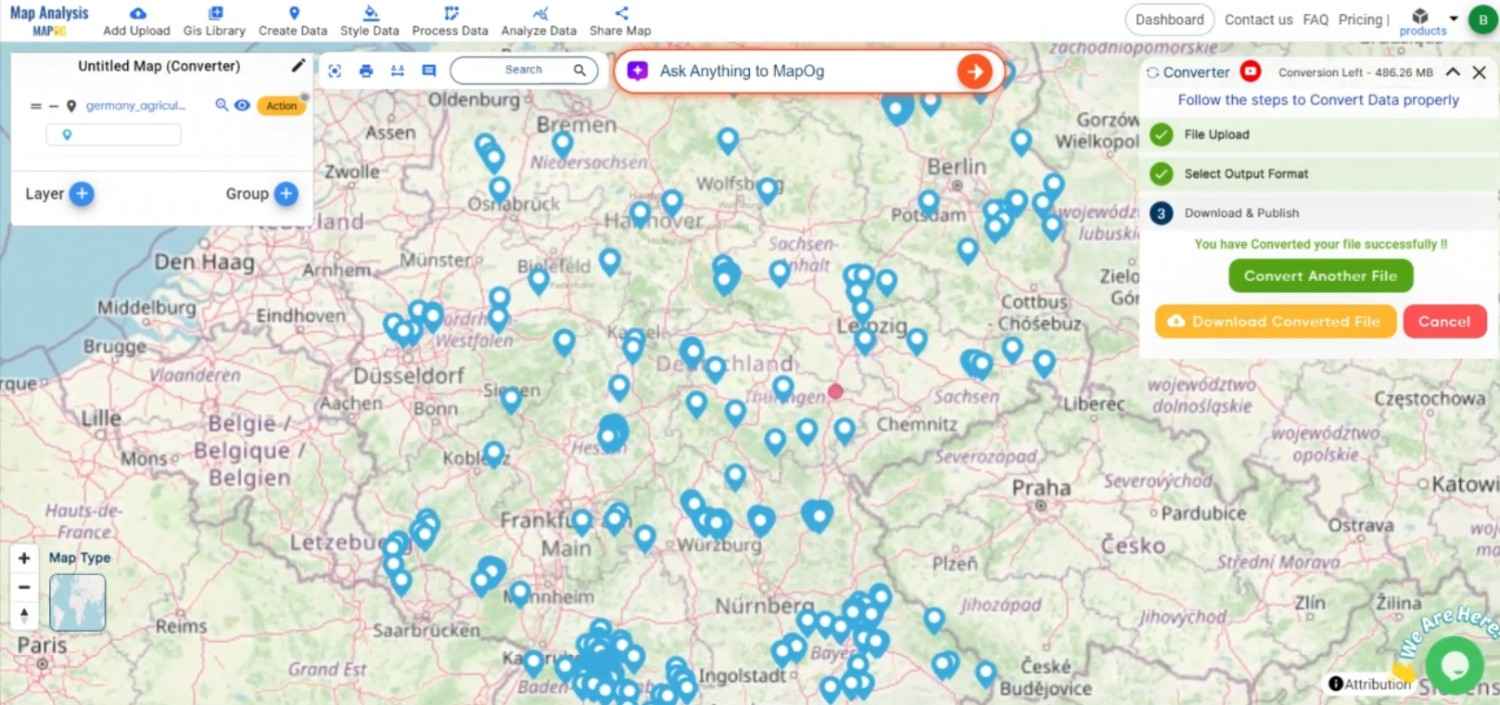
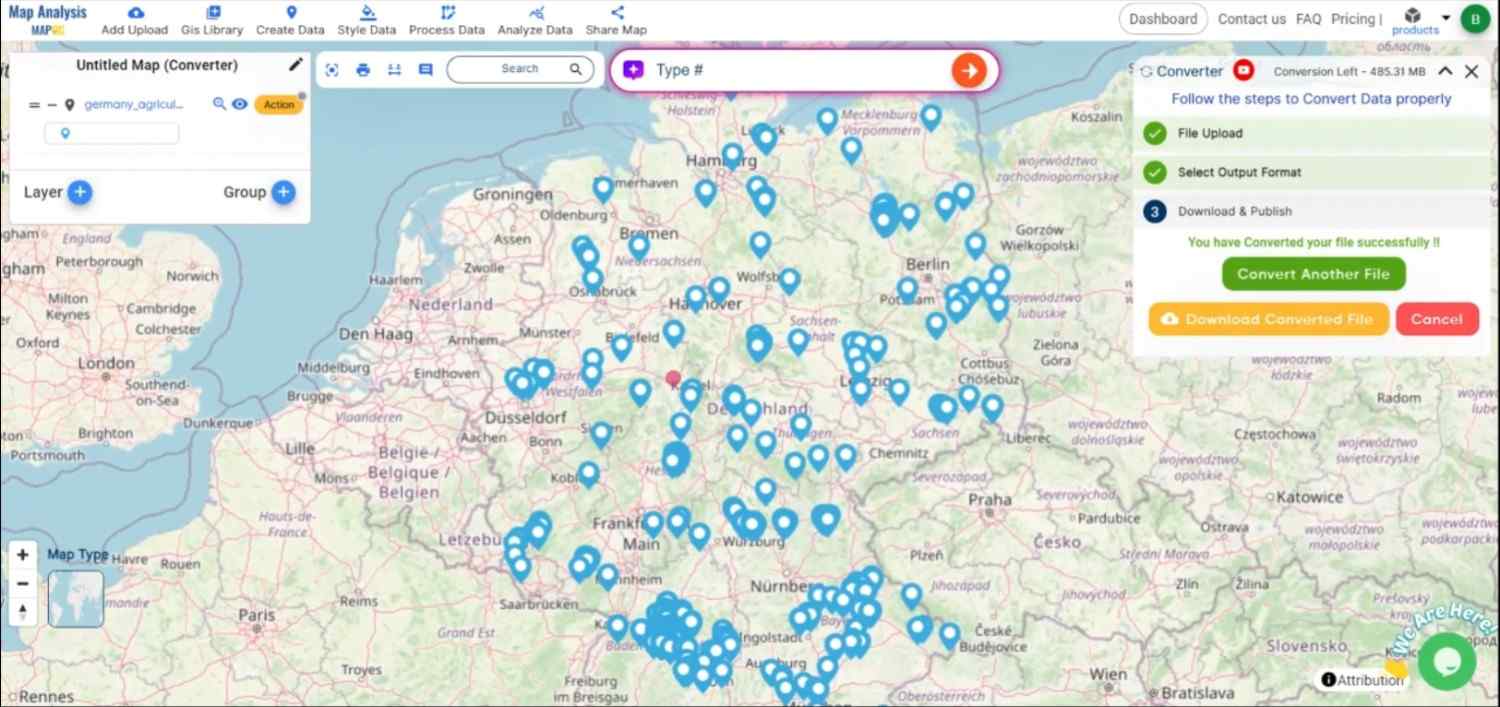
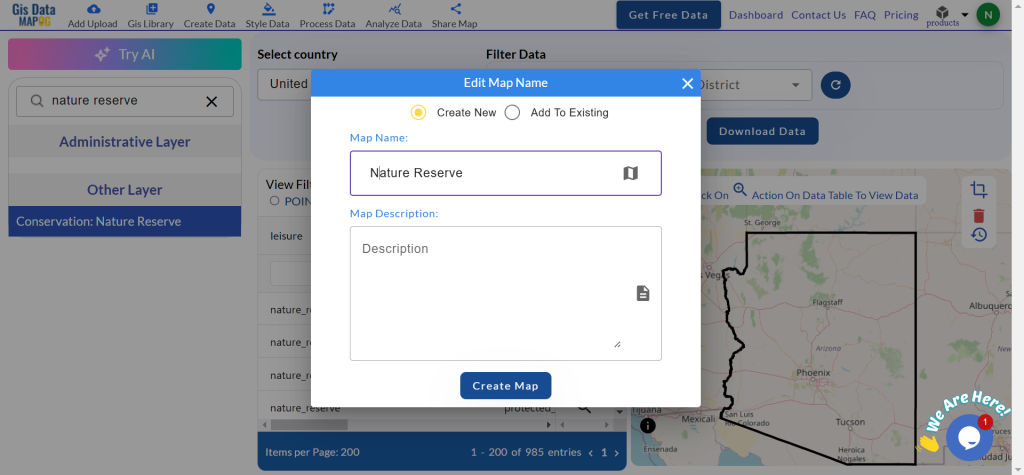
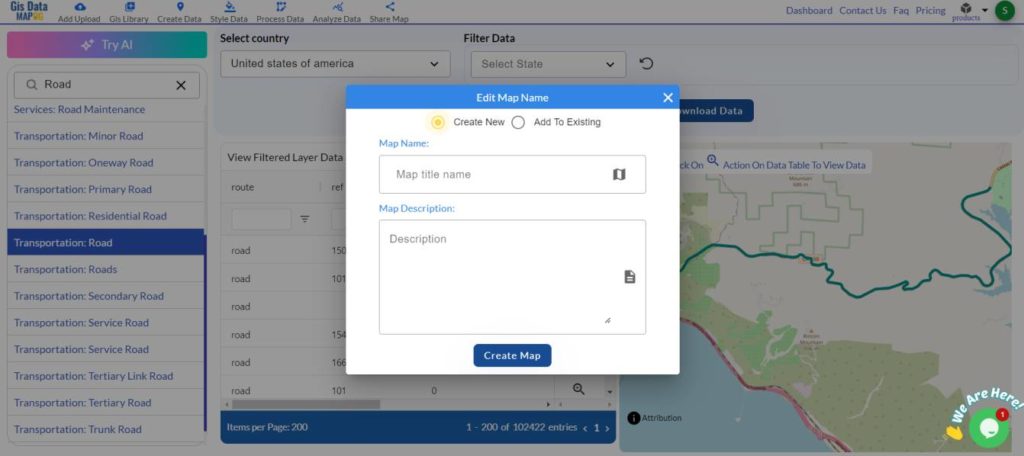
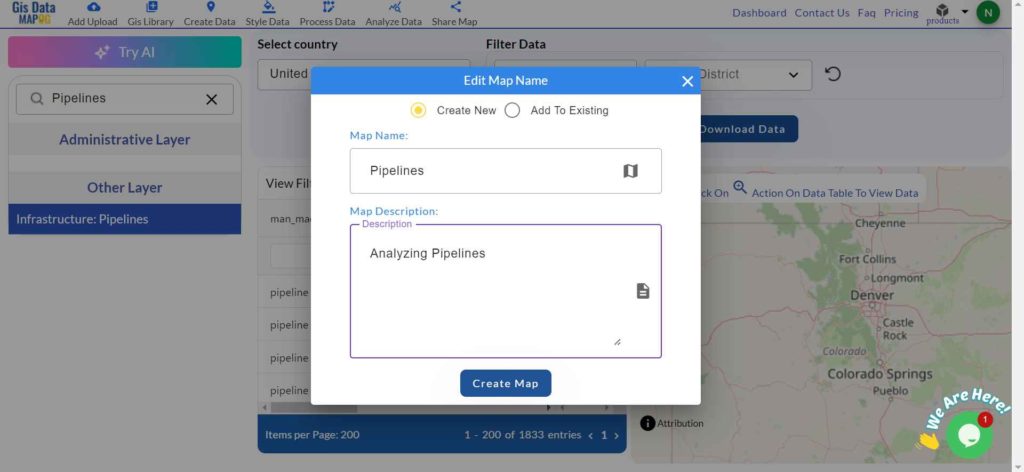
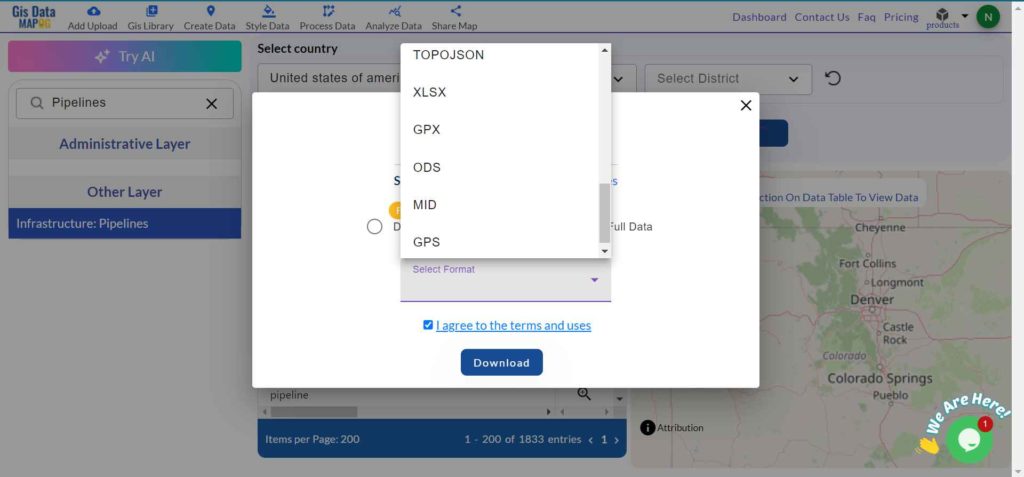
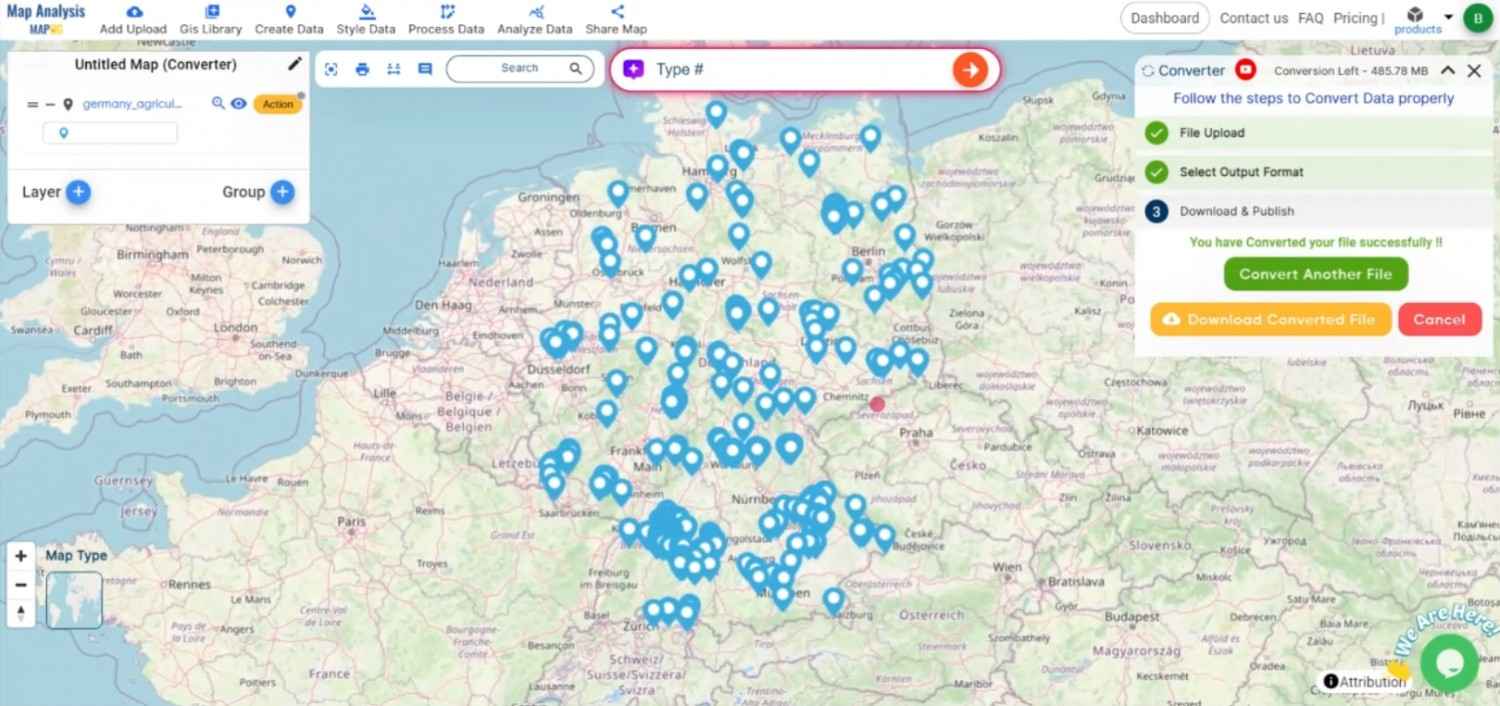
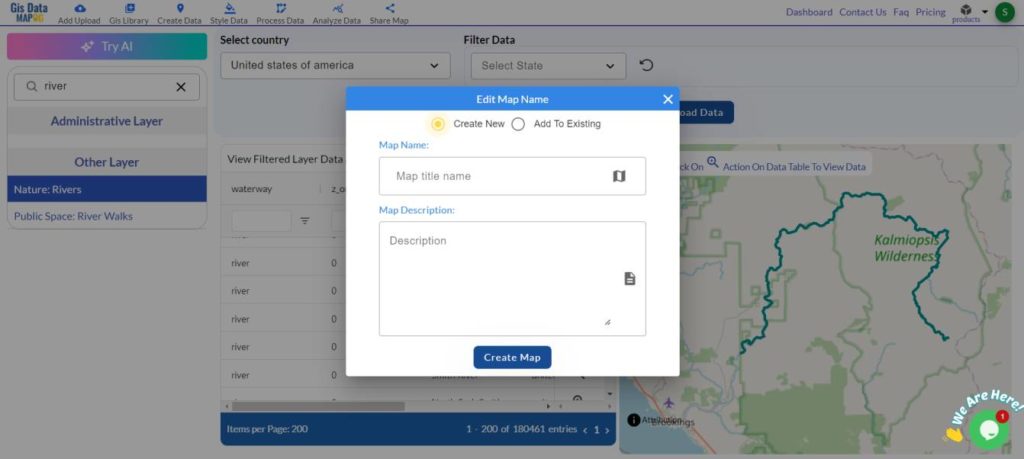
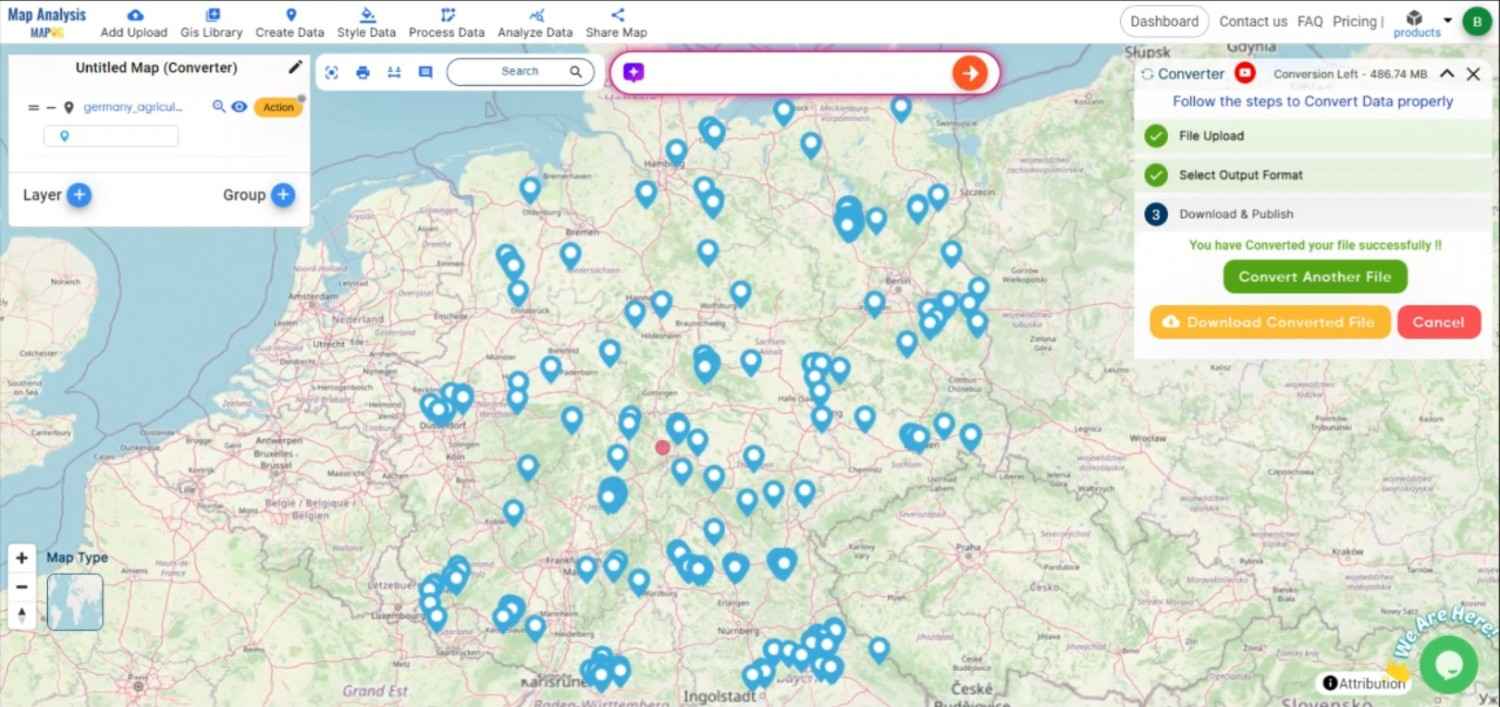
Step 4: Review and Download the KMZ File
After the conversion is complete, review the KMZ file to ensure all data has been correctly transformed and compressed. Once satisfied, download the KMZ file. It is now ready to be used in Google Earth, Google Maps, or any other platform that supports KMZ.
Conclusion:
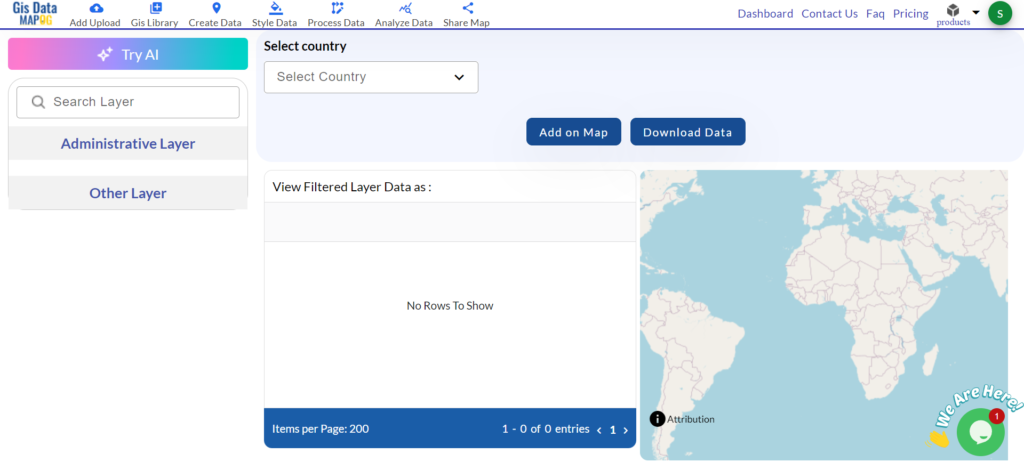
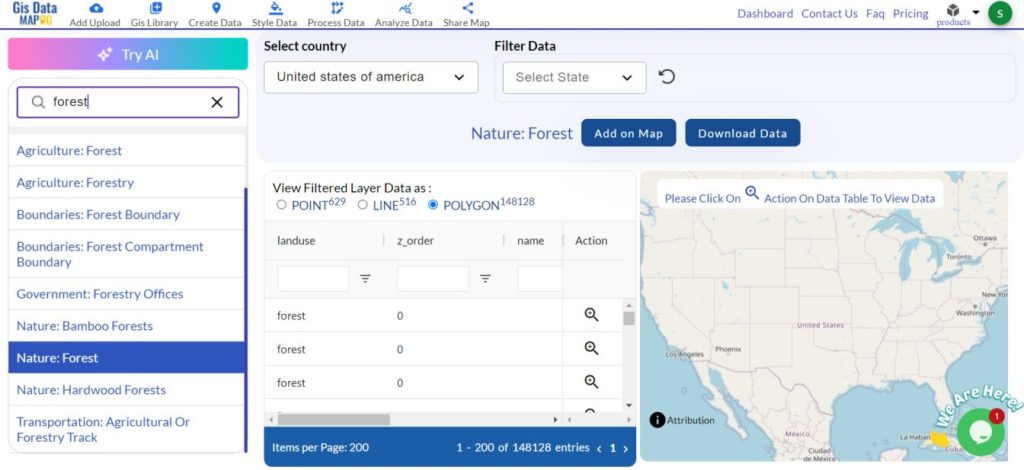
The MAPOG Converter Tool is an invaluable resource for GIS professionals and enthusiasts, simplifying the process of converting data into various geospatial formats. By following these steps, you can efficiently convert CSV files to KMZ format, making your data ready for visualization, sharing, and distribution in a compressed, portable form. If you need to download any data file in CSV or in any other formats like SHP, DXF. visit GIS DATA. Here we have 900+ data layers for 200+ countries.
Feature Tool:
- Create Polyline Data
- Isochrone
- Nearest Neighbour
- Cross Intersection
Story by MAPOG:
MAPOG is an engaging tool that brings geographical data to life through interactive maps and narratives. Imagine combining detailed maps with photos, videos, and text to tell captivating stories about places, events, or trends. Whether you’re showcasing beautiful landscapes, tracking environmental changes, or exploring cultural sites, Story by MAPOG makes it easy to guide viewers through a visual journey. It’s perfect for educators, travel enthusiasts, or anyone who wants to make their data-driven stories interactive and visually compelling.
Here are some other blogs you might be interested in:
- Convert Online Gis data : KML to PDF file
- Converting KML to GeoTIFF , Online Gis Data Converter
- Converting KMZ to SHP : Online GIS Data Conversion
- Converting TopoJSON to SHP Online : GIS Data Converter
- Converting GeoJSON to TopoJSON with MAPOG
- Converting GeoJSON to CSV with MAPOG
- Converting KMZ to KML with MAPOG
- Converting GML to KML with MAPOG
- Convert KMZ to TopoJSON Online
- Converting KMZ to GeoJSON Online
- Convert KML to MID Online
- Online Conversion KML to MIF
- Convert KML to GML Online
- Convert KML to GPKG Online
- Convert KML to KMZ Online
- Convert GML to SHP Online
- Convert KML to GML Online
- Convert KML to GeoJSON file online
- Convert KML to TopoJSON Online
- GeoJSON to GeoTIFF – Vector to Raster Conversion
- SHP to GPX / GPS
- Convert GeoJSON to KML
- Convert Geojson to MIF MapInfo file
- GeoJSON to Shapefile
- Convert GML to CSV
- Convert KMZ to GPX