Geographic Information System is a system intends to capture, Store, manage, manipulate, analyze the data.
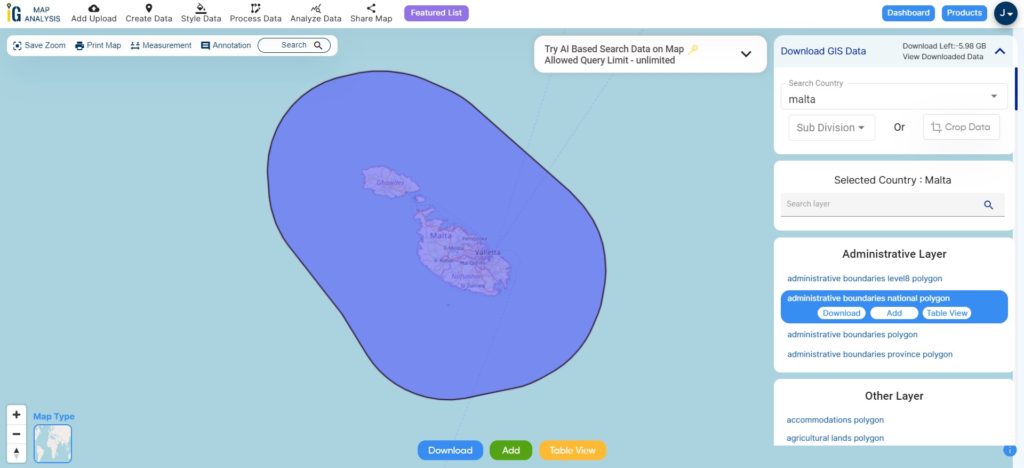
 Attention to all who are passionate about GIS! Exciting tidings are coming your way from MAPOG. We are thrilled to unveil our impeccably curated GIS data, finely crafted for the distinctive landscape of Malta. This dataset holds the key to unveiling intricate geographical insights and precise administrative boundaries. Whether your focus lies in local projects or ambitious national mapping endeavors, our premium resources are poised to amplify your efforts. Seamlessly accessible in a variety of formats, including ESRI Shapefile, KML, GeoJSON, and CSV, integrating this data into your projects is smoother than ever. Seize this remarkable moment to enrich your mapping pursuits with the freshest GIS data tailored for Malta’s essence. Embark on your exploration today!
With MAPOG’s versatile toolkit, you can effortlessly upload vector, add WMS (Web Map Service) layers, upload Excel or CSV data, incorporate existing files, perform polygon splitting and merging, generate new polygon and polyline data, use the converter for various formats, conduct buffer analysis, create grids, transform points into polygons, calculate isochrones, and utilize the geocoder for precise location information.
We offer an extensive array of data formats, including KML, SHP, CSV, GeoJSON, Tab, SQL, Tiff, GML, KMZ, GPKZ, SQLITE, Dxf, MIF, TOPOJSON, XLSX, GPX, ODS, MID, and GPS, ensuring compatibility and accessibility for various applications and analyses.
Note:
- All data available are in GCS datum EPSG:4326 WGS84 CRS (Coordinate Reference System).
- You need to login for downloading the shapefile.
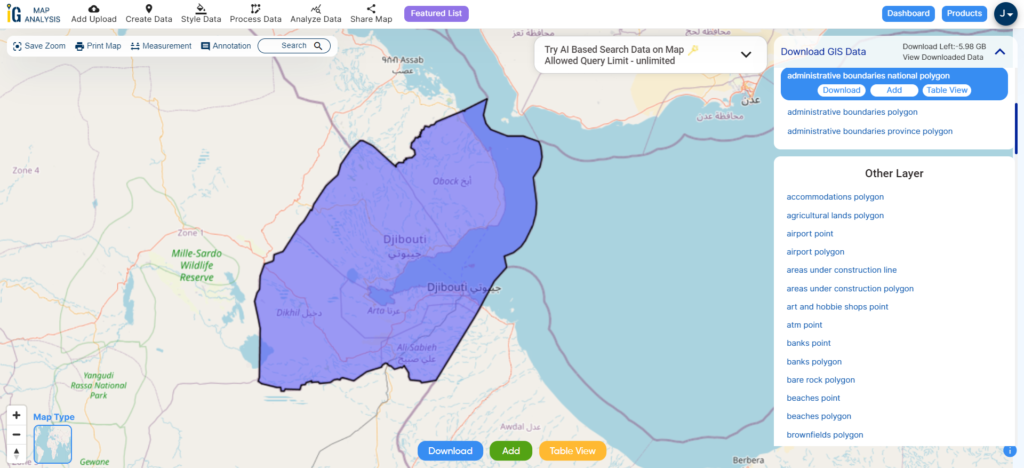
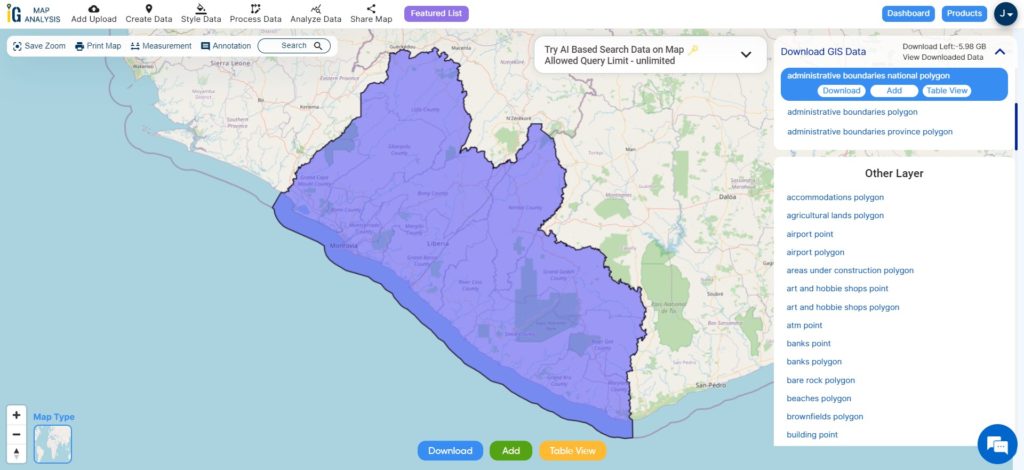
Download Shapefile Data of Malta
Malta is a captivating island nation situated in Southern Europe within the Mediterranean Sea. It forms an archipelago positioned between Italy and Libya. Notably, it rests 80 km south of Sicily (Italy), 284 km east of Tunisia, and 333 km north of Libya. The official languages are Maltese and English, and a striking 66% of the population is proficient in Italian.
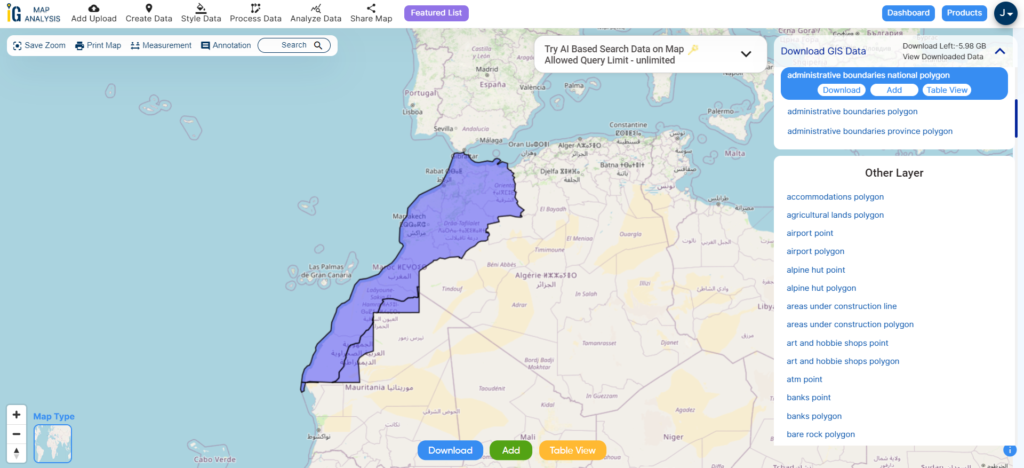
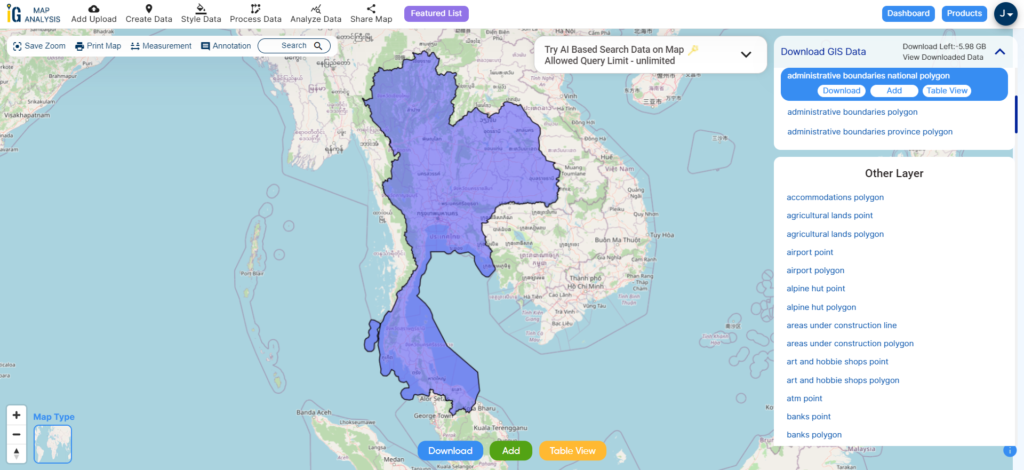
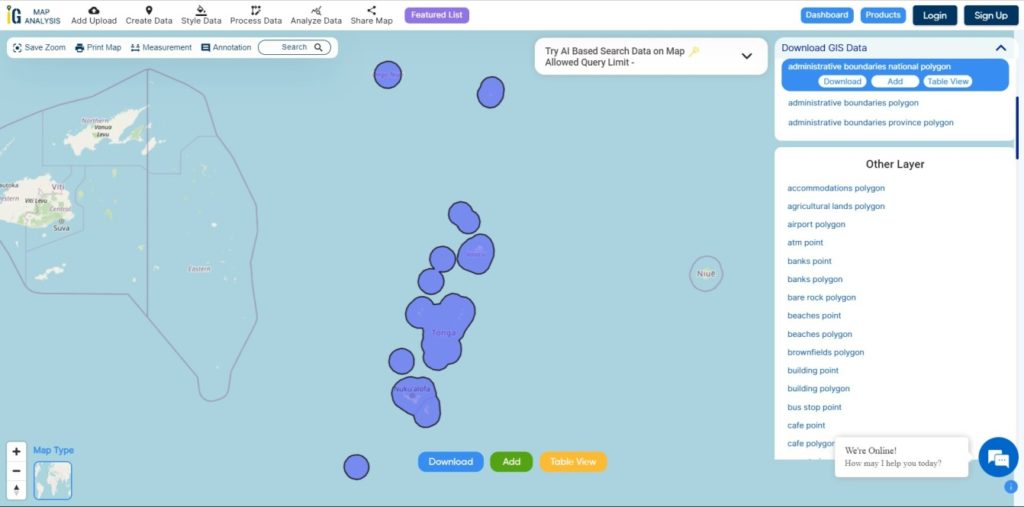
Download Malta National Boundary Shapefile
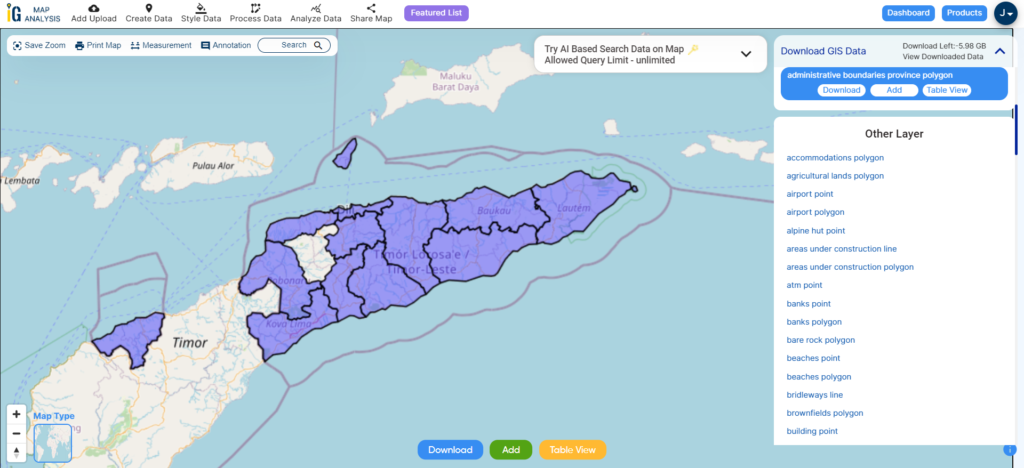
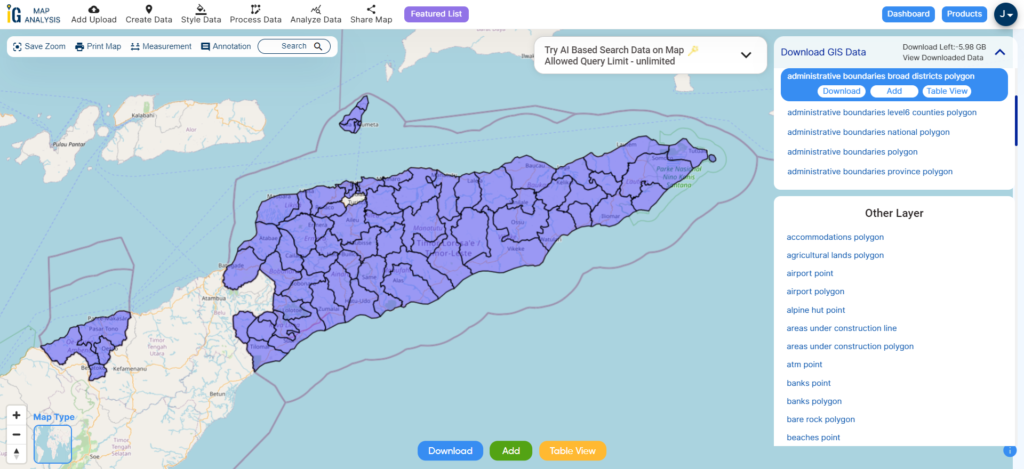
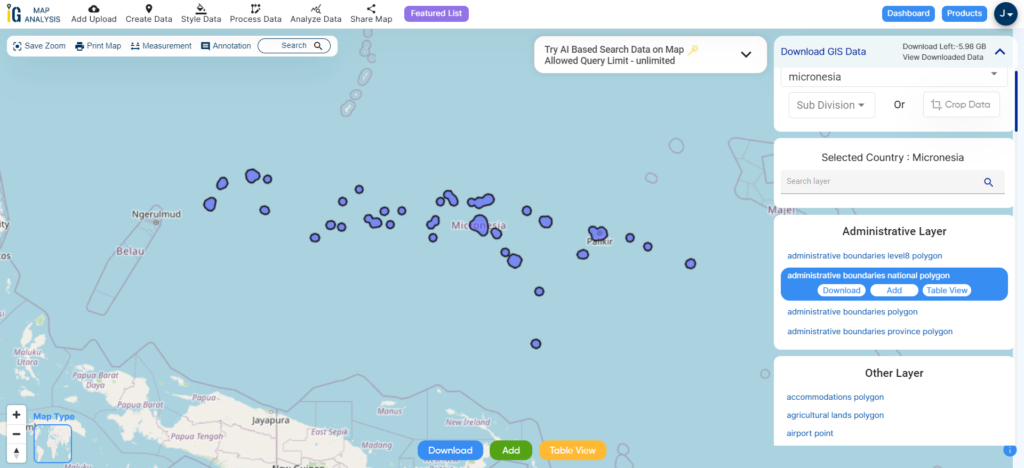
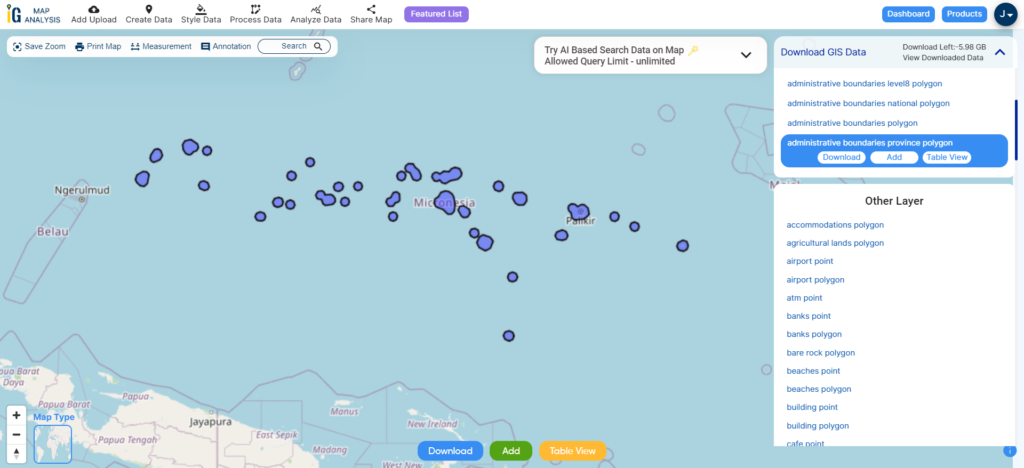
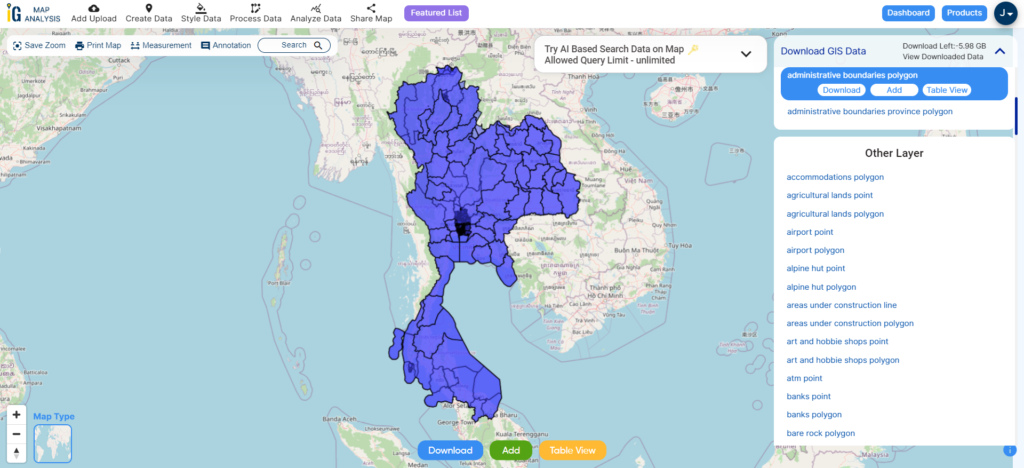
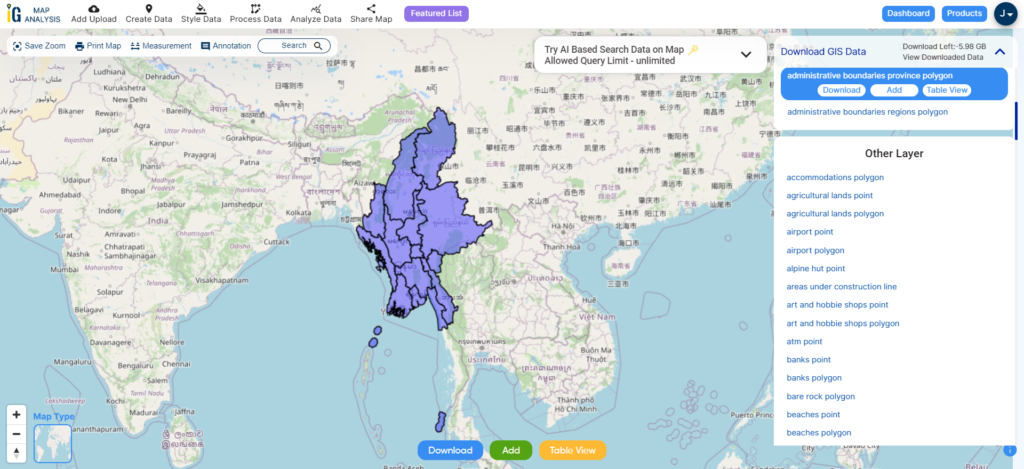
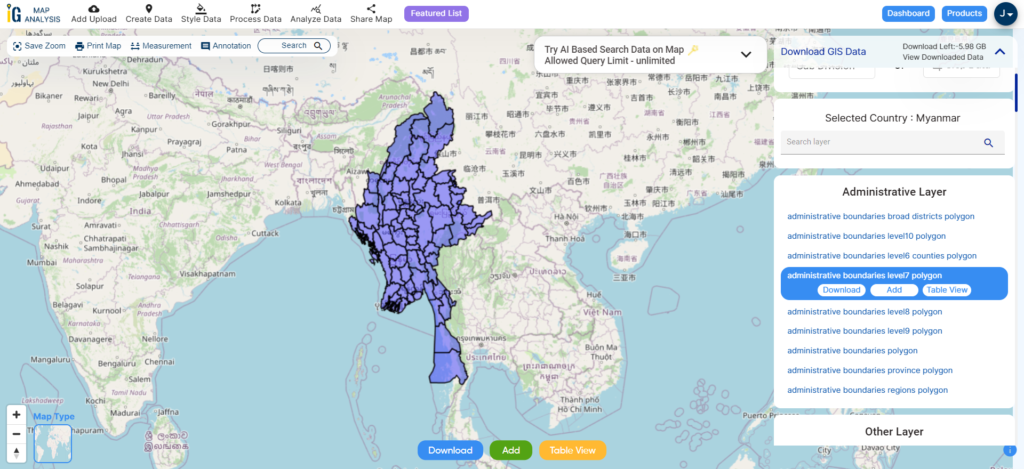
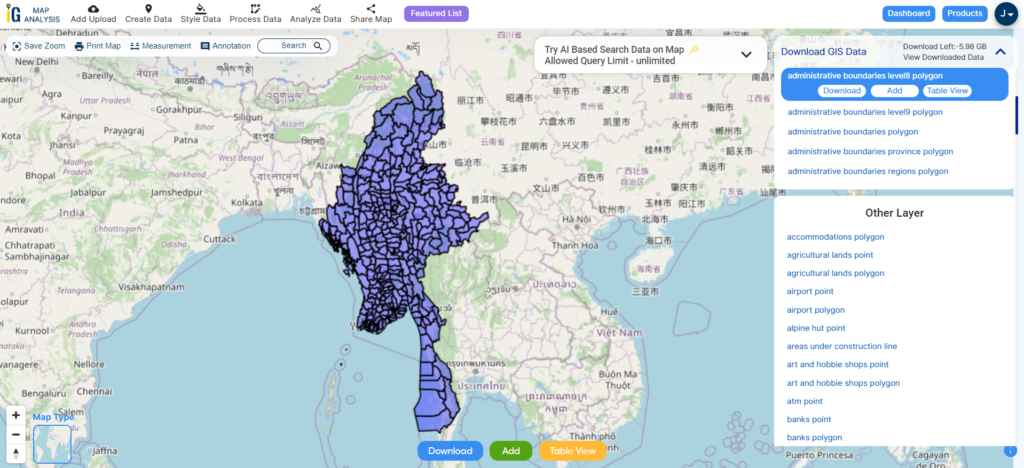
After successfully logging in with a legitimate email address, select the country you want to work with. Next, choose the specific layer you need and click on the download option. Once that’s done, pick the desired format to acquire the essential GIS data. Before proceeding with the data download, make sure to review the data table for any relevant information.
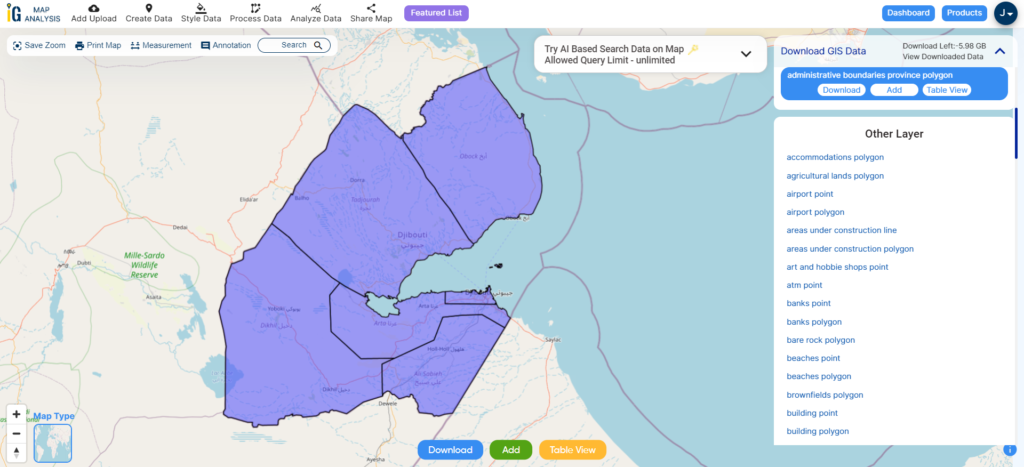
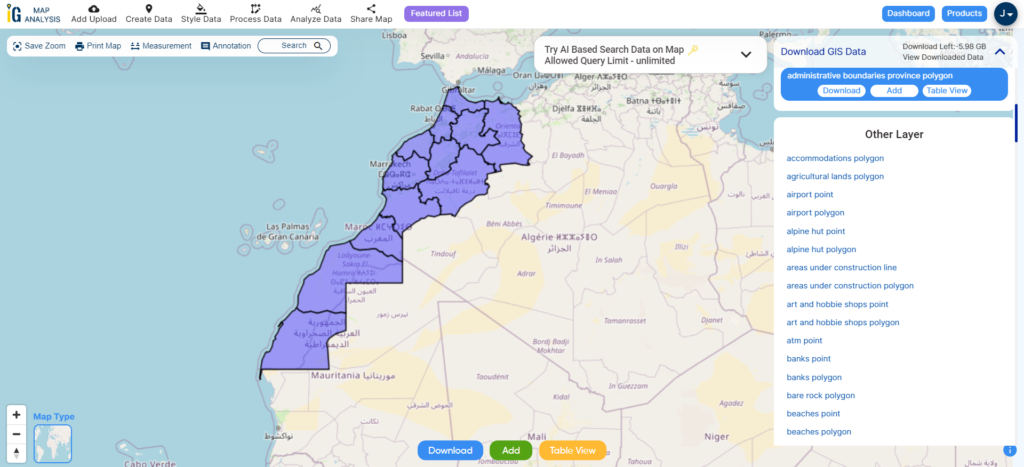
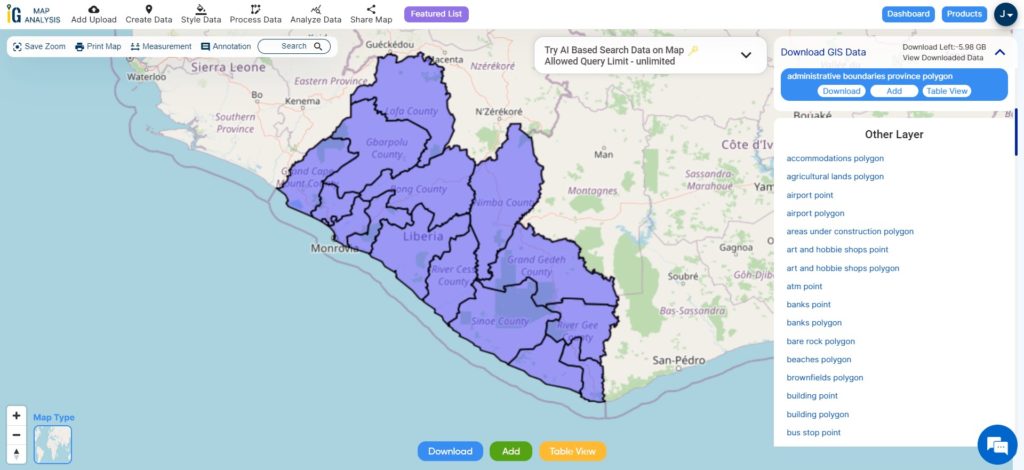
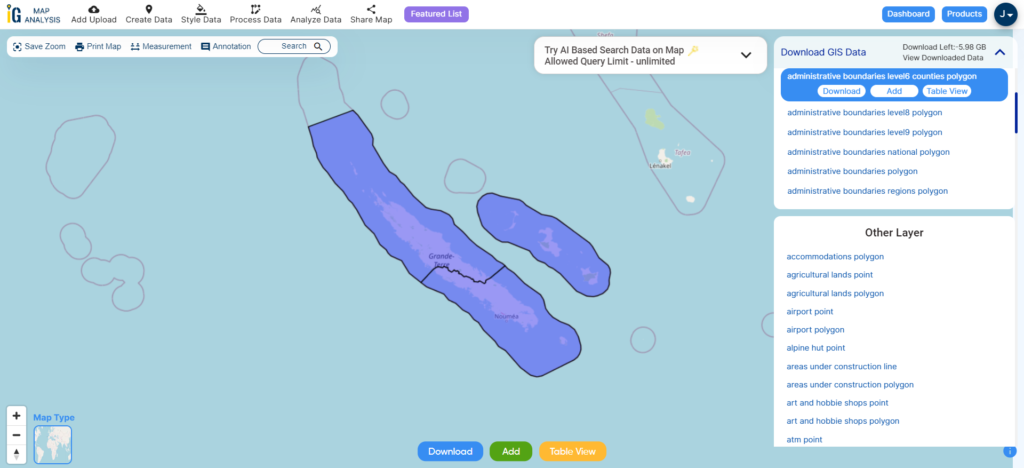
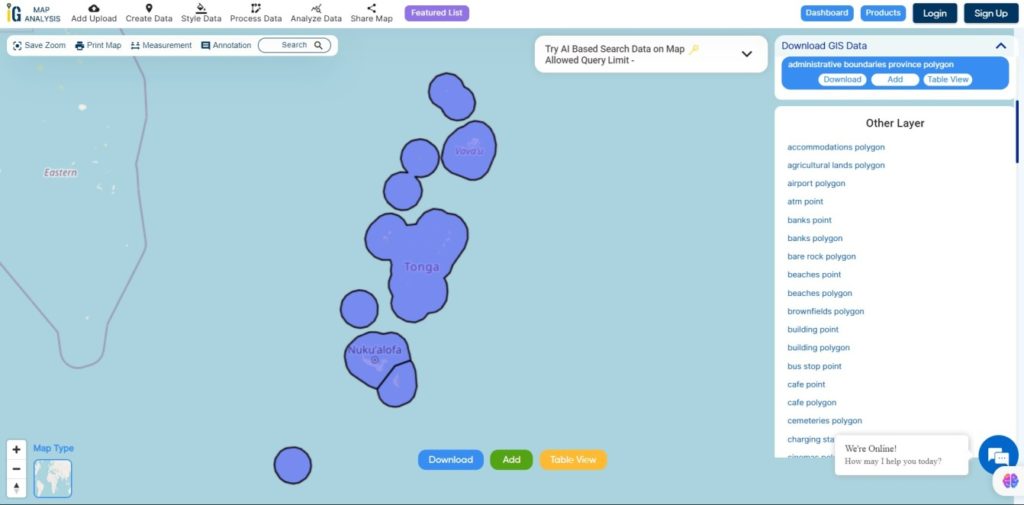
Download Malta Regions Shapefile Data
Malta is divided into five regions, known as “reġjuni” in Maltese.
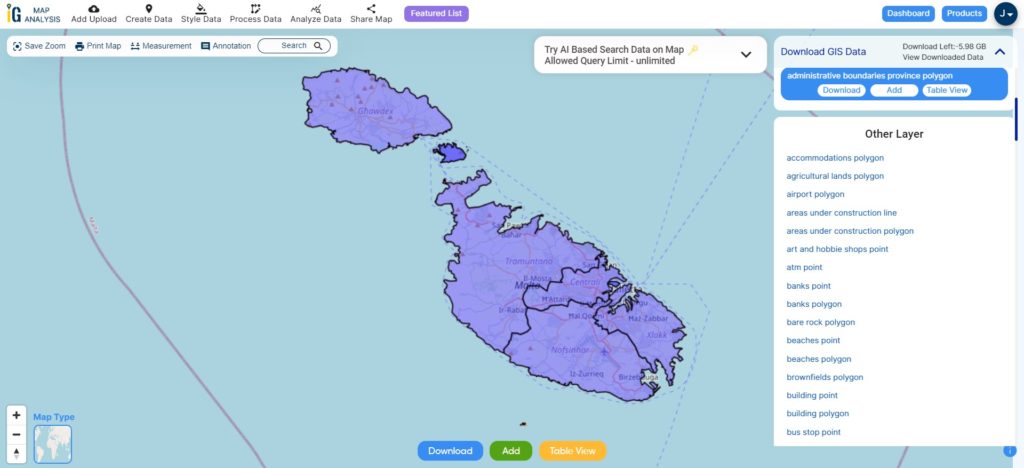
Download Malta Regions Shapefile
This shapefile covers following regions of Malta listed below:
- Northern Region (Maltese: Reġjun Tramuntana)
- Northern Harbour Region (Maltese: Reġjun Xlokk)
- Southern Harbour Region (Maltese: Reġjun Nofsinhar)
- Western Region (Maltese: Reġjun Majjistral)
- Gozo Region (Maltese: Reġjun Għawdex)
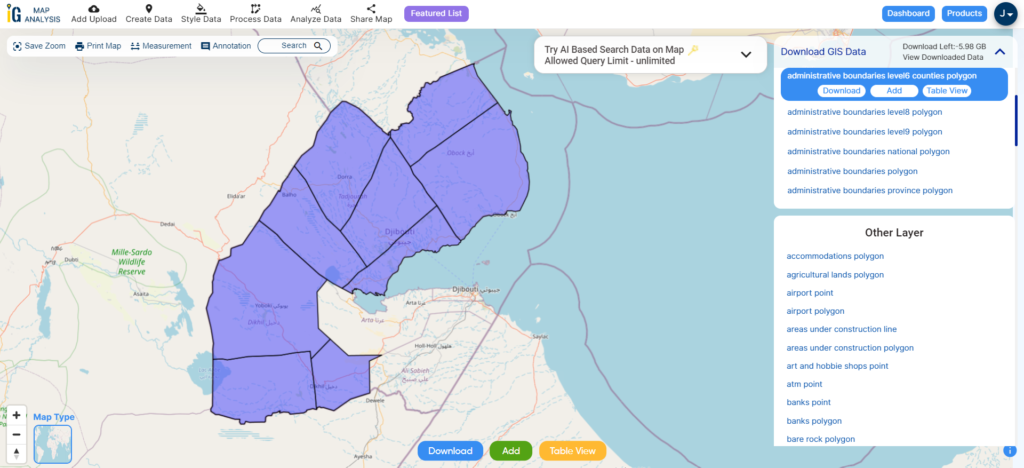
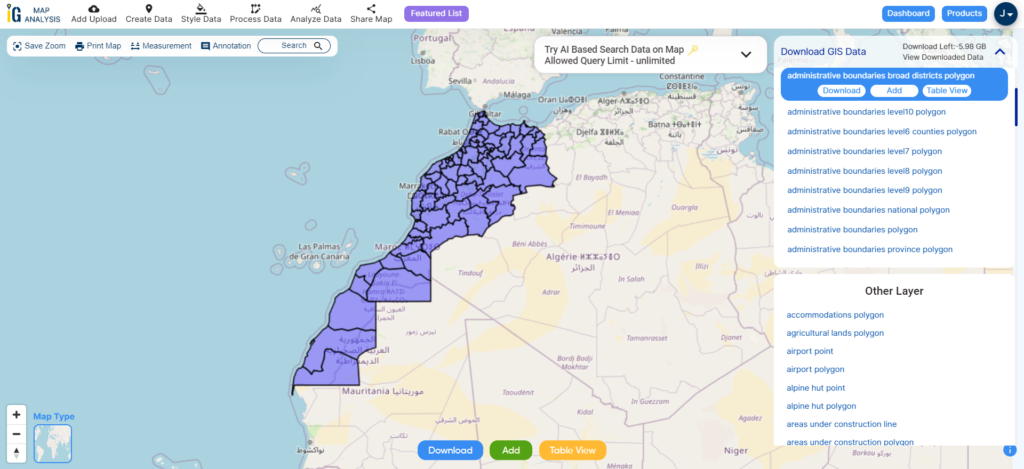
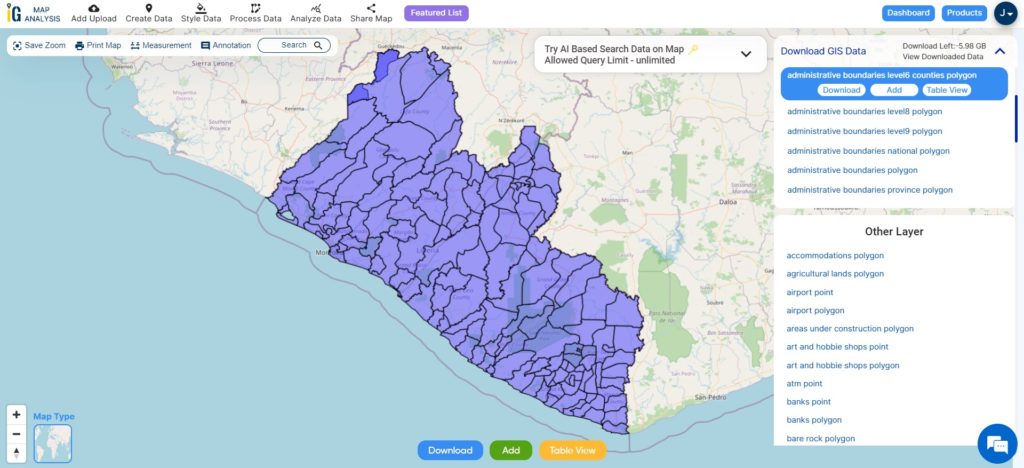
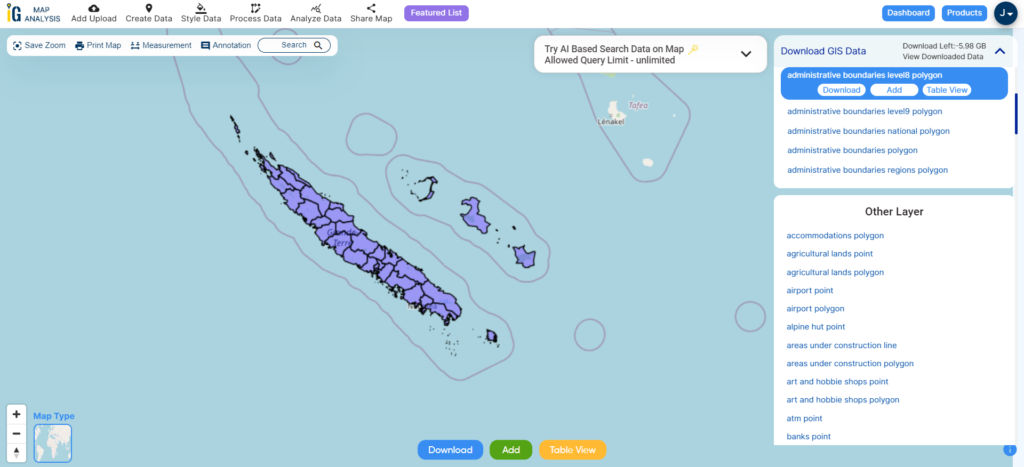
Download Malta Local Council Shapefile Data
Malta has been organized into 68 localities, each overseen by local councils (Maltese: kunsilli lokali). These localities, referred to as municipalities or boroughs, are seen as fundamental villages or towns by the Maltese.
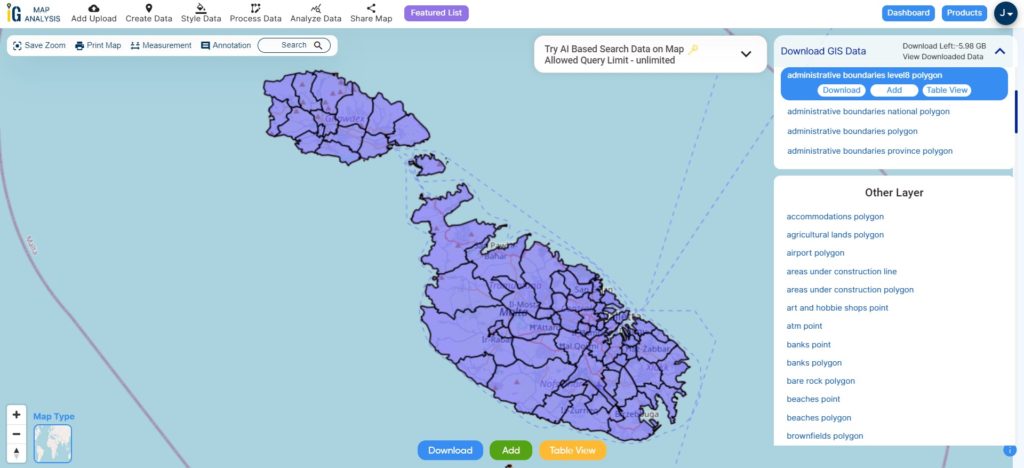
Download Malta Local Council Shapefile
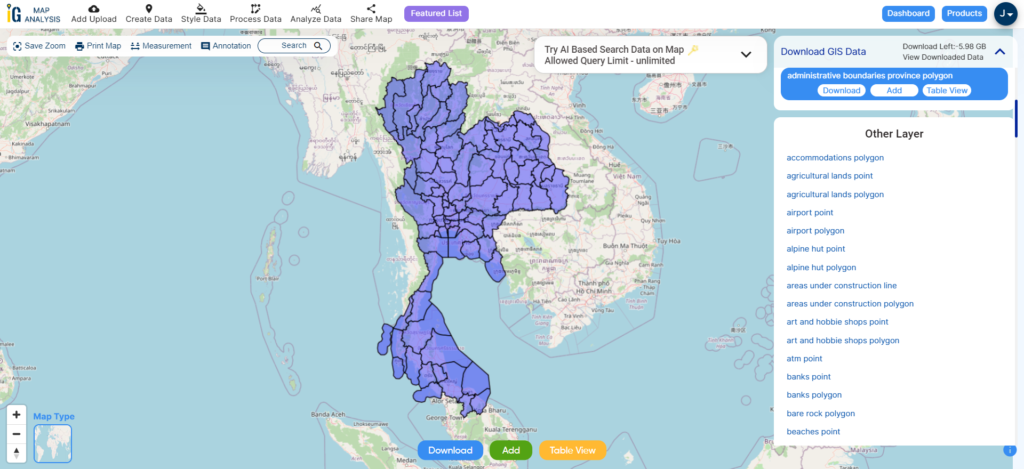
Other Administrative Boundary Data:
Other GIS Data:
- Download Malta Airport Polygon Shapefile
- Download Malta Rivers lines Polygons Shapefile
- Download Malta Highway Lines Shapefile
- Download Malta Road Lines Shapefile
Above all links are provided for GIS data of Malta if you are looking for any specific data please write us on support@mapog.com
Download Shapefile for the following:
- World Countries Shapefile
- Australia
- Argentina
- Austria
- Belgium
- Brazil
- Canada
- Denmark
- Fiji
- Finland
- Germany
- Greece
- India
- Indonesia
- Ireland
- Italy
- Japan
- Kenya
- Lebanon
- Madagascar
- Malaysia
- Mexico
- Mongolia
- Netherlands
- New Zealand
- Nigeria
- Papua New Guinea
- Philippines
- Poland
- Russia
- Singapore
- South Africa
- South Korea
- Spain
- Switzerland
- Tunisia
- United Kingdom Shapefile
- United States of America
- Vietnam
- Croatia
- Chile
- Norway
- Maldives
- Bhutan
- Colombia
- Libya
- Comoros
- Hungary
- Laos
- Estonia
- Iraq
- Portugal
- Azerbaijan
- Macedonia
- Romania
- Peru
- Marshall Islands
- Slovenia
- Nauru
- Guatemala
- El Salvador
- Afghanistan
- Cyprus
- Syria
- Slovakia
- Luxembourg
- Jordan
- Armenia
- Haiti And Dominican Republic
Disclaimer : If you find any shapefile data of country provided is incorrect do contact us or comment below, so that we will correct the same in our system as well we will try to correct the same in openstreetmap.