Download New Zealand Administrative Boundary Shapefiles – Regional Councils, Territorial Authorities, Wards and more

Hello GIS enthusiasts, IGISMAP has now published the latest GIS vector data of New Zealand administrative levels. Links for downloading the shapefiles of the important administrative divisions of New Zealand are provided in the following. You can also download these data in KML, GeoJSON or CSV formats. 

Note:

  • All data available are in GCS datum EPSG:4326 WGS84 CRS (Coordinate Reference System).
  • You need to login for downloading the shapefile.
  • Most of following administrative GIS data are provided in both digital and cartographic extends
    • Digital boundary – Polygon boundary data covering low level waterbodies
    • Cartographic boundary – Polygon boundary data covering only land areas excluding all levels of waterbodies

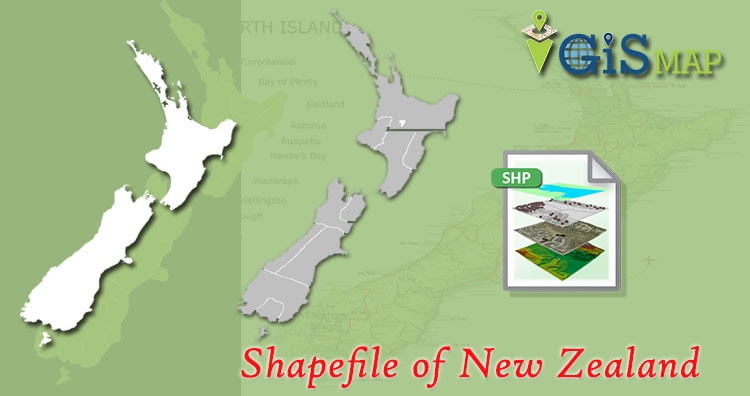
Download Free Shapefile Data of New Zealand

New Zealand is an island country in the southwestern Pacific Ocean. It consists of two main landmasses—the North Island and the South Island and over 700 smaller islands. It is the sixth-largest island country by area, covering 268,021 square kilometers (103,500 sq mi). New Zealand is about 2,000 kilometers (1,200 mi) east of Australia across the Tasman Sea and 1,000 kilometers (600 mi) south of the islands of New Caledonia, Fiji, and Tonga. The country’s varied topography and sharp mountain peaks, including the Southern Alps, owe much to tectonic uplift and volcanic eruptions. New Zealand’s capital city is Wellington, and its most populous city is Auckland.

New Zealand National Boundary

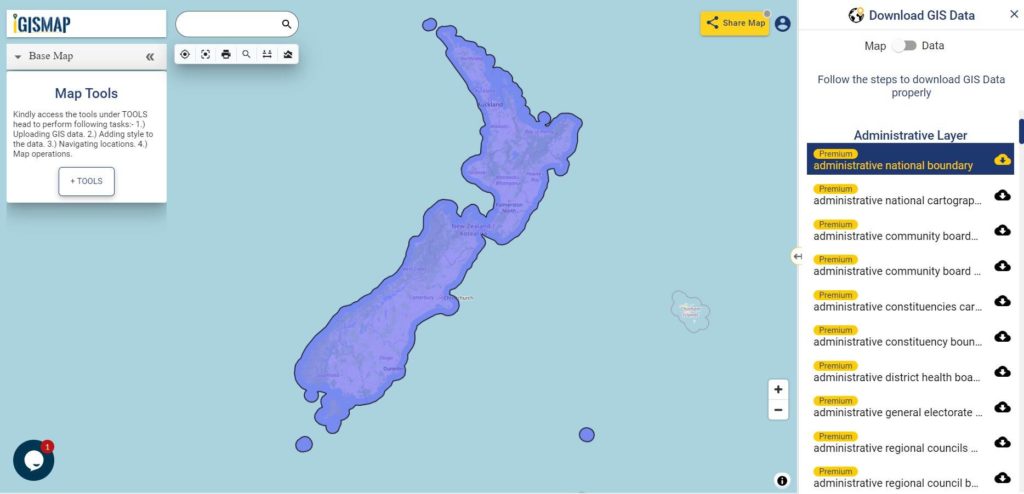
Download New Zealand National Boundary Shapefile

Download New Zealand National Cartographic Boundary Shapefile

Download New Zealand Regional Councils Shapefile Data

New Zealand is divided into 17 regions for local government purposes.

New Zealand Regional Council Boundaries

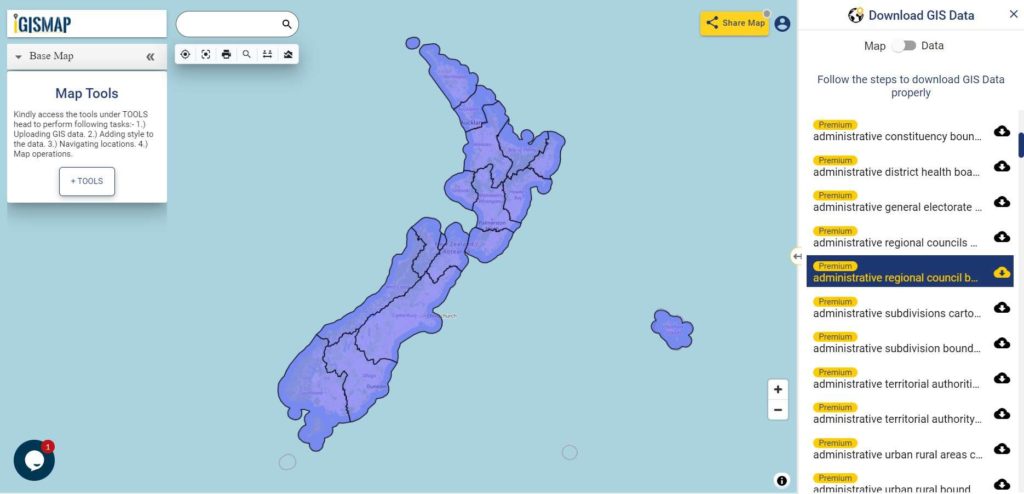
Download New Zealand Regional Council Boundaries Shapefile

Download New Zealand Regional Council Cartographic Boundaries Shapefile

Download New Zealand Territorial Authorities Shapefile Data

Territorial authorities are the second tier of local government in New Zealand, below regional councils. There are 67 territorial authorities: 13 city councils, 53 district councils and the Chatham Islands Council.

New Zealand Territorial Authority Boundaries

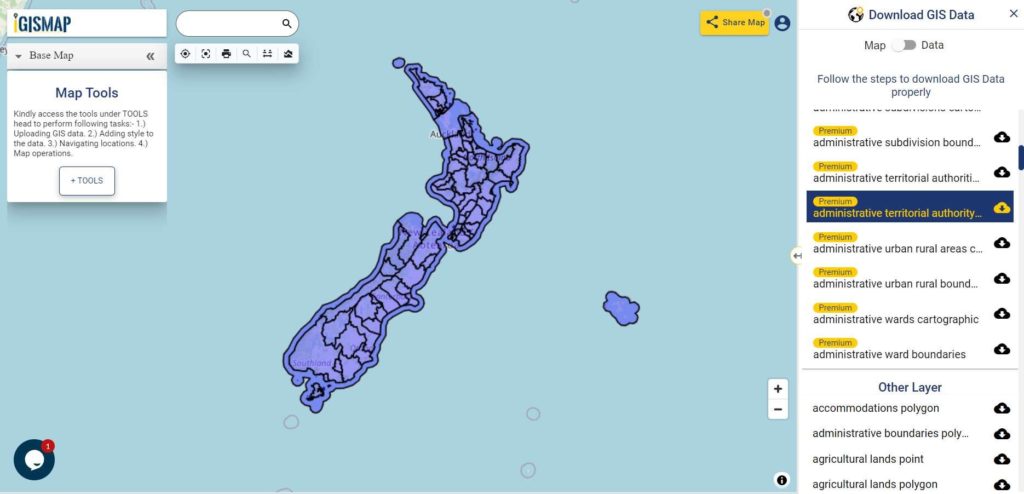
Download New Zealand Territorial Authority Boundaries Shapefile

Download New Zealand Territorial Authority Cartographic Boundaries Shapefile

Download New Zealand Wards Shapefile Data

New Zealand Ward Boundaries

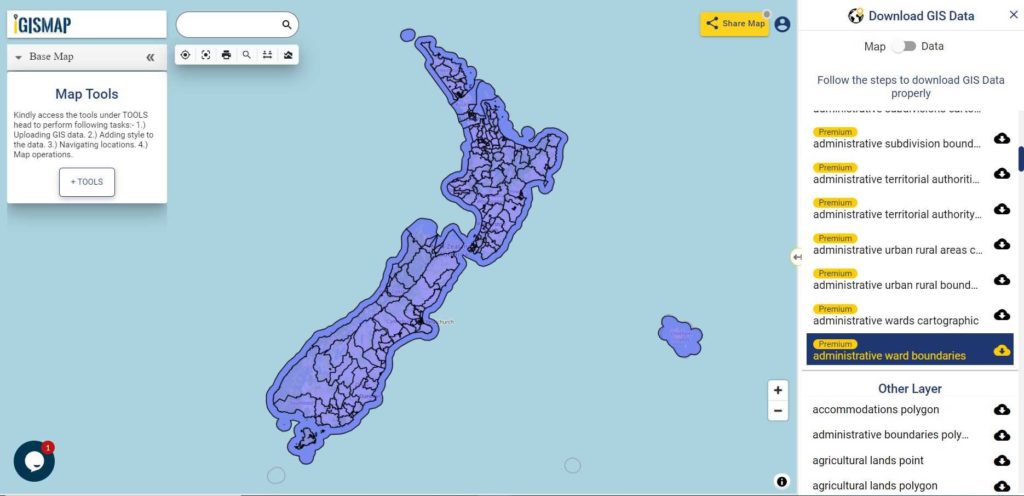
Download New Zealand Ward Boundaries Shapefile

Download New Zealand Ward Cartographic Boundaries Shapefile

Other Administrative Shapefile Data:

Other GIS Data:

Please note that the New Zealand data provided here is license under Open Data Commons Open Database License (ODbL). Please review the same before using it. If you want data under different license you can also look over to the post : Download Free Shapefile Maps – Country Boundary Polygon, Rail-Road, Water polyline etc

Download Free Shapefile for the following:

  1. World Countries Shapefile
  2. Australia
  3. Argentina
  4. Austria
  5. Belgium
  6. Brazil
  7. Canada
  8. Denmark
  9. Fiji
  10. Finland
  11. Germany
  12. Greece
  13. India
  14. Indonesia
  15. Ireland
  16. Italy
  17. Japan
  18. Kenya
  19. Lebanon
  20. Madagascar
  21. Malaysia
  22. Mexico
  23. Mongolia
  24. Netherlands
  25. New Zealand
  26. Nigeria
  27. Papua New Guinea
  28. Philippines
  29. Poland
  30. Russia
  31. Singapore
  32. South Africa
  33. South Korea
  34. Spain
  35. Switzerland
  36. Tunisia
  37. United Kingdom Shapefile
  38. United States of America
  39. Vietnam
  40. Croatia
  41. Chile
  42. Norway

Disclaimer : If you find any shapefile data of country provided is in correct do contact us or comment below, so that we will correct the same in our system.

Download India Administrative Boundary Shapefiles – States, Districts, Pincodes and more

Namaste GIS professionals after a long time here is the shapefile of India. We get lots of queries on how to download India boundary shapefile for free and now the wait is over. In this post you will find administrative levels as well as electoral divisions of India.

  • All data available are in GCS datum EPSG:4326 WGS84 CRS (Coordinate Reference System).
  • You need to login for downloading the shapefile.

Download Free Shapefile Data of India

India, officially known as the Republic of India is a country in South Asia. It is the seventh-largest country by area, the second-most populous country, and the most populous democracy in the world. Bounded by the Indian Ocean on the south, the Arabian Sea on the southwest, and the Bay of Bengal on the southeast, it shares land borders with Pakistan to the west, China, Nepal, and Bhutan to the north and Bangladesh and Myanmar to the east. In the Indian Ocean, India is in the vicinity of Sri Lanka and the Maldives. Its Andaman and Nicobar Islands share a maritime border with Thailand, Myanmar and Indonesia.

India National Boundary

Download India National Outline Boundary Shapefile

Download India States Shapefile Data

India is a federal union comprising 28 states and 8 union territories, for a total of 36 entities. The states and union territories are further subdivided into districts and smaller administrative divisions.

States:

  • Arunachal Pradesh
  • Assam
  • Karnataka
  • Manipur
  • Meghalaya
  • Mizoram
  • Nagaland
  • Punjab
  • Rajasthan
  • Sikkim
  • Tripura
  • Uttarakhand
  • Telangana
  • Bihar
  • Kerala
  • Madhya Pradesh
  • Gujarat
  • Odisha
  • Chhattisgarh
  • Goa
  • Haryana
  • Himachal Pradesh
  • Jharkhand
  • Tamil Nadu
  • Uttar Pradesh
  • West Bengal
  • Andhra Pradesh
  • Maharashtra

Union Territories:

  • Chandigarh
  • Andaman and Nicobar Islands
  • Lakshadweep
  • Jammu and Kashmir
  • NCT of Delhi
  • Puducherry
  • Dadra and Nagar Haveli and Daman and Diu
India State Boundaries

Download India State Boundaries Shapefile

Download India Districts Shapefile Data

States and the Union Territories are divided into districts. At the time of Census 2001 there were in all 593 districts against 467 districts at the time of 1991 Census. Each district is further divided in to sub-districts, which are known differently in different parts in the country (e.g., tahsil, taluka, community development (CD) block, Police station, Mandal, revenue circle, etc.).

India District Boundaries

Download India District Boundaries Shapefile

Download India Pincode Boundaries Shapefile Data

There is more than 1,55,000 post offices based on Department of Posts (DoP) website. The following GIS data provided by IGISMAP contains 19929 postcode area polygon boundaries,

India Pincode Boundaries

Download India Pincode Boundaries Shapefile

Other Administrative Boundary Data:

India Demographic Data:

Download free Shapefile

  1. World Countries Shapefile
  2. Australia
  3. Argentina
  4. Austria
  5. Belgium
  6. Brazil
  7. Canada
  8. Denmark
  9. Fiji
  10. Finland
  11. Germany
  12. Greece
  13. India
  14. Indonesia
  15. Ireland
  16. Italy
  17. Japan
  18. Kenya
  19. Lebanon
  20. Madagascar
  21. Malaysia
  22. Mexico
  23. Mongolia
  24. Netherlands
  25. New Zealand
  26. Nigeria
  27. Papua New Guinea
  28. Philippines
  29. Poland
  30. Russia
  31. Singapore
  32. South Africa
  33. South Korea
  34. Spain
  35. Switzerland
  36. Tunisia
  37. United Kingdom Shapefile
  38. United States of America
  39. Vietnam
  40. Croatia
  41. Chile
  42. Norway

Disclaimer : If you find any shapefile data of country provided is in correct do contact us or comment below, so that we will correct the same in our system as well we will try to correct the same in OSM.

Download Mexico Administrative Boundary Shapefiles – Provinces, Municipalities, Island Territories and more

Hello GIS enthusiasts, IGISMAP has now published the latest GIS vector data of Mexico administrative levels. Links for downloading the shapefiles of the important administrative divisions of Mexico are provided in the following. You can also download these data in KML, GeoJSON or CSV formats. 

Note:

  • All data available are in GCS datum EPSG:4326 WGS84 CRS (Coordinate Reference System).
  • You need to login for downloading the shapefile.

Download Free Shapefile Data of Mexico

Mexico, officially the United Mexican States, is a country in the southern portion of North America. It is bordered to the north by the United States; to the south and west by the Pacific Ocean; to the southeast by Guatemala, Belize, and the Caribbean Sea; and to the east by the Gulf of Mexico. Mexico covers 1,972,550 square kilometers (761,610 sq mi), making it the world’s 13th-largest country by area; with approximately 126,014,024 inhabitants, it is the 10th-most-populous country and has the most Spanish-speakers. Mexico is organized as a federal republic comprising 31 states and Mexico City, its capital. Other major urban areas include Monterrey, Guadalajara, Puebla, Toluca, Tijuana, Ciudad Juárez, and León.

Mexico National Boundary

Download Mexico National Outline Boundary Shapefile

Download Mexico Province Shapefile Data

In the following shapefile of Mexico comprises 31 provinces and capital city Mexico City. 31 provinces of Mexico are listed below.

1) Chihuahua
2) Sonora
3) Coahuila
4) Durango
5) Oaxaca
6) Tamaulipas
7) Jalisco
8) Zacatecas
9) Baja California Sur
10) Chiapas
11) Veracruz
12) Baja California
13) Nuevo León
14) Guerrero
15) San Luis Potosí
16) Michoacán
17) Campeche
18) Sinaloa
19) Quintana Roo
20) Yucatán
21) Puebla
22) Guanajuato
23) Nayarit
24) Tabasco
25) México
26) Hidalgo
27) Querétaro
28) Colima
29) Aguascalientes
30) Morelos
31) Tlaxcala

Mexico Province Boundaries

Download Mexico Province Boundaries Shapefile

Download Mexico Municipalities Shapefile Data

Mexico Municipality Boundaries

Download Mexico Municipality Boundaries Shapefile

Download Mexico Island Territories Shapefile Data

Mexico Island Territory Digital Boundaries

Download Mexico Island Territory Digital Boundaries Shapefile

Other GIS Data:

Please note that the Mexico data provided here is license under Open Data Commons Open Database License (ODbL). Please review the same before using it. If you want data under different license you can also look over to the post : Download Free Shapefile Maps – Country Boundary Polygon, Rail-Road, Water polyline etc

Download Free Shapefile for the following:

  1. World Countries Shapefile
  2. Australia
  3. Argentina
  4. Austria
  5. Belgium
  6. Brazil
  7. Canada
  8. Denmark
  9. Fiji
  10. Finland
  11. Germany
  12. Greece
  13. India
  14. Indonesia
  15. Ireland
  16. Italy
  17. Japan
  18. Kenya
  19. Lebanon
  20. Madagascar
  21. Malaysia
  22. Mexico
  23. Mongolia
  24. Netherlands
  25. New Zealand
  26. Nigeria
  27. Papua New Guinea
  28. Philippines
  29. Poland
  30. Russia
  31. Singapore
  32. South Africa
  33. South Korea
  34. Spain
  35. Switzerland
  36. Tunisia
  37. United Kingdom Shapefile
  38. United States of America
  39. Vietnam
  40. Croatia
  41. Chile
  42. Norway

Disclaimer : If you find any shapefile data of country provided is in correct do contact us or comment below, so that we will correct the same in our system.

Download United Kingdom Administrative Boundary Shapefiles – Countries, Regions, Counties, Unitary Authorities, Wards and more

Hello GIS enthusiasts, IGISMAP has now published the latest GIS vector data of United Kingdom administrative levels. Links for downloading the shapefiles of the important administrative divisions of United Kingdom are provided in the following. You can also download these data in KML, GeoJSON or CSV formats.

Note:

  • All data available are in GCS datum EPSG:4326 WGS84 CRS (Coordinate Reference System).
  • You need to login for downloading the shapefile.

Download Free Shapefile Data of United Kingdom

The United Kingdom of Great Britain and Northern Ireland, commonly known as the United Kingdom (UK) or Britain is a sovereign state to the northwest of continental Europe, consists of:

  • England
  • Scotland
  • Wales
  • Northern Ireland

The United Kingdom includes the island of Great Britain, the north-­eastern part of the island of Ireland, and many smaller islands within the British Isles. Northern Ireland shares a land border with the Republic of Ireland. Otherwise, the United Kingdom is surrounded by the Atlantic Ocean, with the North Sea to the east, the English Channel to the south and the Celtic Sea to the south-west, giving it the 12th-longest coastline in the world. The Irish Sea separates Great Britain and Ireland. The total area of the United Kingdom is 93,628 square miles (242,500 km2), with an estimated population in 2020 of 68 million.

United Kingdom Country Boundaries

Download United Kingdom Country Boundaries Shapefile

Download National Outline Boundary of Each Countries:

Download United Kingdom Regions And Counties Shapefile Data

The regions, formerly known as the government office regions, are the highest tier of sub-national division in England, established in 1994 which is divided into 9 regions.

United Kingdom Region Boundaries

Download United Kingdom Region Boundaries Shapefile

County level division of pan UK includes Metropolitan counties, Non metropolitan counties, Unitary authorities and London Boroughs. Following data available in IGISMAP consist of 202 polygon features of county level boundaries.

United Kingdom County Boundaries

Download United Kingdom County Boundaries Shapefile

Download United Kingdom Unitary Authorities Shapefile Data

Unitary Authority divisions are associated with England, thus commonly known as Unitary authorities of England. The unitary authorities of England are those local authorities which are responsible for the provision of all local government services within a district. Following data of Unitary Authority boundaries is a combined data of Local Authority District polygons of Scotland, Wales and Northern Ireland with the Unitary Authority polygons which is a sum of 138 polygon features.

United Kingdom Unitary Authority Boundaries

Download United Kingdom Unitary Authority Boundaries Shapefile

Download United Kingdom Wards Shapefile Data

The wards and electoral divisions in the United Kingdom are electoral districts at sub-national level represented by one or more councillors. The ward is the primary unit of English electoral geography for civil parishes and borough and district councils, electoral ward is the unit used by Welsh principal councils, while the electoral division is the unit used by English county councils and some unitary authorities. Each ward/division has an average electorate of about 5,500 people, but ward-population counts can vary substantially. As at the end of 2014 there were 9,456 electoral wards/divisions in the UK.

United Kingdom Ward Boundaries

Download United Kingdom Ward Boundaries Shapefile

Other Administrative Boundary Data:

Download Shapefile for following countries

  1. World Countries Shapefile
  2. Australia
  3. Argentina
  4. Austria
  5. Belgium
  6. Brazil
  7. Canada
  8. Denmark
  9. Fiji
  10. Finland
  11. Germany
  12. Greece
  13. India
  14. Indonesia
  15. Ireland
  16. Italy
  17. Japan
  18. Kenya
  19. Lebanon
  20. Madagascar
  21. Malaysia
  22. Mexico
  23. Mongolia
  24. Netherlands
  25. New Zealand
  26. Nigeria
  27. Papua New Guinea
  28. Philippines
  29. Poland
  30. Russia
  31. Singapore
  32. South Africa
  33. South Korea
  34. Spain
  35. Switzerland
  36. Tunisia
  37. United Kingdom Shapefile
  38. United States of America
  39. Vietnam
  40. Croatia
  41. Chile
  42. Norway

Disclaimer : If you find any shapefile data of country provided is in correct do contact us or comment below, so that we will correct the same in our system as well we will try to correct the same in OSM.

Telecom GIS System

The use of Telecommunication is a necessity for everyone these days. As  a result telecommunication has so much to do with different sectors of technologies. One of those technologies is GIS, GIS plays a major role for telecom industry. Telecom GIS System is an initiative by IGIS Map to provide help for research and analytics of existing socio-economic factors, business processes and operational complexities in Telecommunication industry. It is created to solve the vast area of issues related to GIS for Telecommunication industry.

Check – Locate Junctions, Map available ports in Telecom

Telecom GIS System

It is powerful tool to create maps, integrate information, visualize scenarios, solve complicated problems, present powerful ideas & develop effective solutions. It helps telecom industry personnel recognizes the  opportunities, market trends, threats and patterns.

  • Visualize with Us – Users can locate areas of market trends and growth as they appear. Which can help them in providing time to respond to the situations.
  • Analyze with Us – Users can analyze the test scenarios with GIS tool. They can select and analyze the network performance and fix the issues before they affect services.

Telecom GIS System is offering these 3 modules in its package for the Telecom industry’s benefit.

The Telecom GIS system have the feature to attach documents, spreadsheets, or images to provide users with additional information or required documentation with these modules. The GIS system uses the information technology and GIS for software and data so that it can provide these excellent services to the industry professionals which otherwise may not be possible with tabular format data. 

Telecom GIS System – Issues

Telecommunication industries are striving to add innovations to various aspects such as Plan, Build and Operate because of the growth prospects of the industry. Here are some major problems faced by Telecommunication sector:

  • Capacity Planning
  • Demand Forecasting
  • Personnel Management
  • Market Segmentation
  • Real-time Knowledge Of Network Structure

As we have already discussed these issues in our previous blog, here is the link for more details on Problems Faced by Telecom Industry and the ways in which GIS helps in solving these problems.

Telecom GIS System – Features

This GIS system can help telecommunication industries in various ways. It will enhance the ability of stakeholders to build resilient infrastructure, facilities, distribution, quality of services, security and innovation in business. Its features helps stakeholders to understand the network structure on a near real-time basis, for better capacity planning.

Some of the features of Telecom GIS System are as follows:

  • Location-Based Information

Location is fundamental to all telecommunications services—cable, wireless, and wire-line. Now with Telecom GIS system, quickly discover and access location information from an application on any device, anywhere, anytime.  Most noteworthy the stakeholders can also enable sales and marketing departments to more effectively target their customers or transfer location information to the field technician to resolve problems and issues. The stakeholders can also evaluate the most cost-effective areas and routes for deploying new networks with the location-based information.

  • Field Data Collection

The Field data collection will be made available to all stakeholders through web interface and a mobile application. GIS system provides provides the selective mode of data collection by walk or vehicle mode. The field data collection enhances efficiency of network monitoring activities as this provides the real-time field data information. Field Data collection also helps in decreasing the response time for network recovery on the field. Geographic based work order management.

  • Map Creation and Updation

Map creation of networks was a lot troubled work previously, it used to take more time and man power to create a map of land survey data and lots of drawing skills to map them. Maps are created easily with the help of GIS technology now-a-days. Hence GIS system provides tool to create map in just a minute and can be updated after getting published. No drawing skills is required for creating the map of networks for telecom industry.

The  integrated maps and information can help stakeholders make the better decisions about maintaining and planning the network infrastructure.

  • Query Management and Analysis

Telecom GIS system helps in optimize strategic planning for network expansion, Optimized network routing, cost estimating and jurisdiction with Query management and analysis of the network area. It provides the query and analysis tools to determine optimal network routing between sites to determine optional paths for cable networks applying user defined criteria (i.e. minimum distance, minimum items required). The system also provides web interface with functionality like services, physical and logical tracing. The system can also be able to do analysis of the number of customers affected due to the fault in a network.

  • Conversion of CAD/GIS data sets

This system supports almost every CAD and GIS data. So if the stakeholder wants to convert the CAD/GIS data files into other formats they are free to do so. Conversion of data sets can help users to get the required format of data as output they need.

  • Report generation and designing tools

Report generation is one of the most important feature in the Telecom GIS system. In this system stakeholders can get both the administrative report and the work order report. The user can generate own reports and download the network data. Report generation could help in Outside or inside plant management, query management or the bill of material generation.

Telecom GIS System also offers the designing tool’s functionalities like pan, zoom, identifying features on a map,  measure distance, interactive north arrow, magnification window, overview window, find place, query attribute, search attribute, editing, geo-processing tasks, adding base maps etc.

  • Share and Collaborate

Telecom GIS system allow the stakeholders to collaborate by sharing maps and dashboards that illustrate performance and statuses to support decision-making. It allows the field operations to collect data and communicate with the main officers and similarly enables sales staff to share market forecast maps with network planners. Sharing network data can be very helpful for collaborating in telecom industry. 

Check out video – how to use IGIS Map Tool in Telecom

Telecom GIS System – Uses

    • Identify New Business Opportunities

Telecom Marketing experts can identify the specific areas with the high growth potential businesses by visualization of map. They can determine the areas for the network investment for new businesses with high profit.

    • Mapping potential customers

Telecom industries personnel can visualize the potential customer base by analyzing the best location for network investments. And route for determining the nearing and exceeding capacity networks for  opportunities to reach new customers.

    • Effective Functioning

Real-time data information via maps helps telecom industries analyze real-time progress when establishing new network infrastructure. From this information they can understand manage the progress quickly and efficiently to reduce the time to market.

Telecom GIS System helps identify relations between potential customer’s location and the organization’s marketing region. Telecom sector can use this GIS system for getting information details similar to customer’s demography, location, lifestyle, business behavior and managing organization’s marketing strategy, promotional events or Maximizing the effectiveness of strategic investments. 

Basically, GIS is widely used in making effective decisions using the existing network structure and network performance status in Telecom sector. Telecom GIS system is an effective and efficient software to use for the telecom industries. For furthermore queries drop you comments below. Any suggestions are welcome.

Want a Telecom GIS System hire us or ask for Quotation. Drop mail at akshay@engineerphilosophy.com for queries.

Download United States of America Administrative Boundary Shapefiles – States, Counties, Reservation Lands and more

Hello GIS enthusiasts, IGISMAP has now published the latest GIS vector data of USA administrative levels. Links for downloading the shapefiles of the important administrative divisions of USA are provided in the following. You can also download these data in KML, GeoJSON or CSV formats.

Note:

  • All data available are in GCS datum EPSG:4326 WGS84 CRS (Coordinate Reference System).
  • You need to login for downloading the shapefile.

Download Shapefile Data of USA

The United States of America (U.S.A. or USA), commonly known as the United States (U.S. or US) or America, is a country primarily located in North America. It consists of 50 states, a federal district, five major unincorporated territories, 326 Indian reservations, and some minor possessions. At 3.8 million square miles (9.8 million square kilometers), it is the world’s third- or fourth-largest country by total area. The United States shares significant land borders with Canada to the north and Mexico to the south as well as limited maritime borders with the Bahamas, Cuba, and Russia. With a population of more than 331 million people, it is the third most populous country in the world. The national capital is Washington, D.C., and the most populous city is New York City.

USA National Boundary

Download USA National Outline Boundary Shapefile

Download USA States Shapefile Data

The United States of America is a federal republic consisting of 50 states, a federal district (Washington, D.C., the capital city of the United States), five major territories, and various minor islands. The 48 contiguous states and Washington, D.C., are in North America between Canada and Mexico. Alaska is an exclave in the far northwestern part of North America, connected only to Canada, and Hawaii is an archipelago in the mid-Pacific. Territories of the United States are scattered throughout the Pacific Ocean and the Caribbean Sea.

According to the numerous decisions of the United States Supreme Court, the 50 individual states and the United States as a whole are each sovereign jurisdictions.[4] The states are not administrative divisions of the country; the Tenth Amendment to the United States Constitution allows states to exercise all powers of government not delegated to the federal government.

States:

  1.  Alabama
  2.  Alaska
  3.  Arizona
  4.  Arkansas
  5.  California
  6.  Colorado
  7.  Connecticut
  8.  Delaware
  9.  Florida
  10.  Georgia
  11.  Hawaii
  12.  Idaho
  13.  Illinois
  14.  Indiana
  15.  Iowa
  16.  Kansas
  17.  Kentucky
  18.  Louisiana
  19.  Maine
  20.  Maryland
  21.  Massachusetts
  22.  Michigan
  23.  Minnesota
  24.  Mississippi
  25.  Missouri
  26.  Montana
  27.  Nebraska
  28.  Nevada
  29.  New Hampshire
  30.  New Jersey
  31.  New Mexico
  32.  New York
  33.  North Carolina
  34.   North Dakota
  35.  Ohio
  36.  Oklahoma
  37.  Oregon
  38.  Pennsylvania
  39.  Rhode Island
  40.  South Carolina
  41.  South Dakota
  42.  Tennessee
  43.  Texas
  44.  Utah
  45.  Vermont
  46.  Virginia
  47.  Washington
  48.  West Virginia
  49.  Wisconsin
  50.  Wyoming

Territories and Islands

  1. District of Columbia
  2. Commonwealth of the Northern Mariana Islands
  3. Puerto Rico
  4. United States Virgin Islands
  5. American Samoa
  6. Guam
USA State Boundaries

Download USA State Boundaries Shapefile

Download USA Counties Shapefile Data

In the United States, a county is an administrative or political subdivision of a state that consists of a geographic region with specific boundaries and usually some level of governmental authority. Most counties have subdivisions which may include townships, municipalities and unincorporated areas. The number of counties per state ranges from the three counties of Delaware to the 254 counties of Texas. The following is a list of the 3,233 counties and county-equivalents in the 50 states and District of Columbia sorted by U.S. state, plus an additional 100 county-equivalents in the U.S. territories sorted by territory.

USA County Boundaries

Download USA County Boundaries Shapefile

Download USA Native American Reservation Lands Shapefile Data

The Indian reservation system was created to keep Native Americans off of lands that European Americans wished to settle. The reservation system allowed indigenous people to govern themselves and to maintain some of their cultural and social traditions. The Dawes Act of 1887 destroyed the reservation system by subdividing tribal lands into individual plots.

Following classes of land reservation are established in USA

  • Indian Reservation Area
  • Alaska Native Village Statistical Areas
  • Hawaiian Home Lands
  • Oklahoma Tribal Statistical Areas
  • State Recognized Reservations
  • State Designated Tribal Statistical Areas
  • Tribal Designated Statistical Areas

There are 326 Indian Reservations in the United States.[1] Most of the tribal land base in the United States was set aside by the federal government as Native American Reservations. In California, about half of its reservations are called rancherías. In New Mexico, most reservations are called Pueblos. In some western states, notably Nevada, there are Native American areas called Indian colonies.

Alaska Natives previously had many small reserves scattered around Alaska; however, all but one (the Annette Island Reserve of Tsimshian) were repealed with the passage of the Alaska Native Claims Settlement Act in 1971.

There are Hawaiian home land, area held in trust for Native Hawaiians by the state of Hawaii under the Hawaiian Homes Commission Act of 1921.

Oklahoma Tribal Statistical Area is a statistical entity identified and delineated by federally recognized American Indian tribes in Oklahoma as part of the U.S. Census Bureau’s 2010 Census and ongoing American Community Survey.

A state designated American Indian reservation is the land area designated by a state for state-recognized American Indian tribes who lack federal recognition.

A tribal designated statistical area is a statistical entity identified and delineated for the Census Bureau by a federally recognized American Indian tribe that does not currently have a federally established Indian reservation.

USA Native American Reservation Land Boundaries

Download USA Native American Reservation Land Boundaries Shapefile

Other Administrative Boundary Data:

USA Demographic Data:

Download Free Shapefile for the following:

  1. World Countries Shapefile
  2. Australia
  3. Argentina
  4. Austria
  5. Belgium
  6. Brazil
  7. Canada
  8. Denmark
  9. Fiji
  10. Finland
  11. Germany
  12. Greece
  13. India
  14. Indonesia
  15. Ireland
  16. Italy
  17. Japan
  18. Kenya
  19. Lebanon
  20. Madagascar
  21. Malaysia
  22. Mexico
  23. Mongolia
  24. Netherlands
  25. New Zealand
  26. Nigeria
  27. Papua New Guinea
  28. Philippines
  29. Poland
  30. Russia
  31. Singapore
  32. South Africa
  33. South Korea
  34. Spain
  35. Switzerland
  36. Tunisia
  37. United Kingdom Shapefile
  38. United States of America
  39. Vietnam
  40. Croatia
  41. Chile
  42. Norway

Check the GIS Data collection for USA states:

  1. Alabama
  2. Alaska
  3. Arizona
  4. Arkansas
  5. California
  6. Colorado
  7. Connecticut
  8. Florida
  9. Georgia
  10. Hawaii
  11. Idaho
  12. Illinois
  13. Indiana
  14. Iowa
  15. Kansas
  16. Massachusetts
  17. Maryland
  18. Michigan
  19. Minnesota
  20. Mississipi
  21. Missouri
  22. Montana
  23. Nevada
  24. Nebraska
  25. Ohio
  26. Oklahoma
  27. Pennsylvania
  28. Utah
  29. Vermont
  30. Washington
  31. Wisconsin
  32. Wyoming
  33. Tennessee
  34. Texas
  35. Kentucky
  36. Louisiana
  37. Maine
  38. North Carolina
  39. Oregon
  40. Virginia
  41. West Virginia

Disclaimer : If you find any shapefile data of country provided is in correct do contact us or comment below, so that we will correct the same in our system as well we will try to correct the same in OSM.

Download free satellite image from sentinel – Remote Sensing

Need satellite images for research and study then you landed at right location. Today we learn how to download free satellite images from sentinel 1, 2 and sentinel 3 for QGIS. If you are new to QGIS 3.2.1 then check our previous article QGIS for beginner.

Download free satellite images from sentinel

Sentinel Satellite

Sentinel is developed under copernicus programme which is maintained and co-funded by European Union and ESA. (European Space Agency). Sentinel 1A was successfully launched 3rd april 2014. It will do Earth observation and keep the satellite data. Sentinel Hub is the cloud based open access GIS hub for management and analysis of satellite data. Lets start

  • Go to SCI Hub tap on open hub. Following screen will appear.

  • If you are new then sign up otherwise click on login
  • After login, Select the area whose satellite data you require. You can select by choosing box provided on the screen.

  • After selection go to search bar and tap for advanced search. Screen provided below.

  • Advance search box is given below. Change the sort by to sensing date. Give the date in the sensing period. And then choose the mission, click on search.

  • Following search result will appear.

  • Now the download the appropriate result. You can view the data by clicking on view the product.

You can view the images before downloading.Now you are ready to download image. It will be in jpeg format for qgis it would e suitable as Geotiff.This all about download free satellite image from sentinel. We try our best by pictorial representation. Hope it will work for you. Any suggestion or feedback are welcome.

Try your hands also on: what is GISConnection between PostGIS and QGIS,

Use Sentinel Hub in QGIS 

How to do layer labeling in QGIS 3.2.1 – use and change label

Map is not just a picture in GIS,  they represent several hidden information of objects. So in the upcoming days we try to understand it more and unearth the hidden data. After creating Basic Map, today we try our hands on layer labeling in QGIS 3.2.1 – use and change label. For extracting more information about the object we do labeling. It makes the layer interactive.

Need Data for study then Download Shapefile of Australia and United States Shapefile

layer labeling in QGIS 3.2.1

Labels are for providing more information about the object. This layer property depends on the attributes of the layer. So, lets start

How to get label dialog box

You can reach Layer Labeling dialog box by 2 ways:

By right click the layer >> Properties>> label (icon shown below)Or, Go to layer menu, select labeling. 

Above map is not looking so attractive and informative.

  • In Labeling Dialog Box, it will show no label.
  • Click over it and select Single labels
  • Now come to the Label with (here you need to choose the field from attributes which is to be labeled). In the previous blog you learnt that. View attribute table
  • Lets select Name_0 from the drop down list.
  • Customize Font and Size.
  • Click Apply (live updates are available)

Now the map of continent is label like this.

So, this makes your map more informative. But still above map is not looking so good because off overlapping labels. These label are not placed in centre of object also. Multiple labels are also can be done  in QGIS.

More related topics on QGIS:

Convert CSV to KML

Hello guys,  If you are looking for converting your CSV file into KML, you have landed on the right place. Here in this article we are discussing on how to convert CSV to KML in the easiest way possible.

A comma-separated values (CSV) file is a delimited text file that uses a comma to separate values. Each line of the file is a data record. KML or Keyhole Markup Language is a collection of geospatial data on map and commonly used in Google Earth or google services

Using Online MapOG Converter Tool you can easily convert – CSV to KML. You can also do other GIS Data Conversion using this tool.

IGISMAP to Convert CSV to KML

For CSV to KML conversion go to MapOG Converter Tool, after logging in with your registered email and password. If you are a new user, click the Sign Up button in the Login popup and register to IGISMAP by filling the details.

IGISMAP

There are three main steps for using GIS Converter:

  • Click on Tool Converter
  • Upload the data
  • Choose the format to which it should be converted

Step one is to upload your CSV file which you want to convert. You can upload the file from your system or select from the Recent Files.

Note:

  • Input CSV file should have location information in WKT format under a field named as WKT.
  • Input CSV file should not have any columns with empty column name between other fields.
  • Well Known Text (WKT) is an Open Geospatial Consortium (OGC) standard that is used to represent spatial data in a textual format.
  • WKT format represents a geometry with the name of the vector entity ie., POINT, POLYGON or LINESTRING followed by the longitude and latitude of the point feature or the vertex of the polygon in brackets. Example for each entity is given below
    • POINT (169.03934 -46.32844)
    • POLYGON ((76.61103048 9.85276413,76.612068 9.85303305,76.6124496 9.85362534,76.61269368 9.85513401,76.61374668 9.85455036,76.61466216 9.85409739,76.61630232 9.85377888))
    • LINESTRING (-123.031531560501 40.4178012488507,-122.889863902657 39.8410114990573,-122.464860929125 38.7886231836447,-121.311281429538 37.473137789379)
  • Name of the field ‘WKT’ is not necessary to be case sensitive.
Upload CSV

Here we have uploaded the CSV file containing the locations of counties of Washington. It contains locations recorded in WKT format as follows:

CSV data with WKT field

Step two is to select choose the output format of the converted file, in this case its KML. You can also set the Coordinate Reference System of your preference. As a default CRS will set to WGS 84 (World) [EPSG:4326]. Click on the Convert File.

Select KML as Output Format

Your CSV file will then get converted to KML file after a few seconds and will be available for downloading.

Download and Publish KML File

You can also choose to style the layer or continue with further conversion process by clicking the Convert Another File button.

Converted Files section from the dashboard contains the list of the details of all the conversion done in your account, providing both input and output data available for download their corresponding formats.

You can also search locations, add new datasets, edit layers and style the map according to your choice and requirements. As IGIS Map Converter Tool provides many benefits other then just conversion of data. This tool provides us to generate this published map in PDF or as image format.

Other GIS data Conversions

If you are facing any problem in conversion or login then please let us know by mailing at support@igismap.com or drop comment.

Creating a Basic Map – QGIS

QGIS 3.2.1 works well for creating interactive maps, using good set of tools and symbology its become easy to implement. In the previous post we learn how to open and view vector data. So, today we are Creating a Basic Map – QGIS. For creating  basic map we work with the vector data. Vector data is very common data format it describes the information in points, lines and polygons.

Creating a Basic Map: Adding vector layer

If you are not familiar with QGIS user interface then check our previous article QGIS 3.2.1 GUI

  • In the dialog box, click on the Browse button. And navigate to the exercise data. (before using make sure to download the Exercise data)
  • Select the appropriate file, let say select road.shp
  • Here you are, this is your basic map
  • Save the project.

View attributes

If you are absolute beginners then question comes in your mind what is attributes. No worries when we are here, attributes is a data which store  information about spatial data. It gives where, what and why about spatial data in tabular form.

So for roads, the layer we loaded in our basic map we will view its attributes. ->>  Click on  this icon for opening attribute table or you can use F6 or Go to Layer>> Open attribute table.

->>  This attribute table provides more data about road layer, the lines that you see in the map are spatial data. These lines represents the roads.

Current basic map is not so easy to read. We will make it more understandable and interactive using Symbology (use of symbol).

Symbology

In the cartography design,  symbology  is technique to use symbols to represent graphic features of map. Visual appearance is very much important. Follow the steps for making your map more attractive –

  • Click two times on layer>> Layer properties dialog box will appear. Select symbology OR right on the layer>> click the layer properties in the menu.  Symbology window shown below.

This all the creating a basic map – QGIS. Symbology is useful but the information contained in the layer is still hidden. In the next blog we will learn how to represent this data on map.

Hope it will be useful for GIS professional. Suggestions and feedback are most welcomed.

More on QGIS:

Exit mobile version
%%footer%%