Geographic Information System is a system intends to capture, Store, manage, manipulate, analyze the data. GIS system integrate data and convert it into maps. And as we know visuals are more powerful than words so it makes our understanding of data fast.
What is GIS ?
GIS is a tool to acquire geographic data and produce Geographic information. And generally those information are stored in tabular form. GIS can be defined as a “computer information system that can input, store, manipulate, analyze, and display geographically referenced (spatial) data to support decision making processes”.
Simply GIS visualize your data as a map. And these visualization makes the study interesting with interactive maps. It saves the time and make the system decisiveness that is main requirement.
Hello GIS enthusiasts, IGISMAP has now published the latest GIS vector data of Denmark administrative levels. Links for downloading the shapefiles of the important administrative divisions of Denmark are provided in the following. You can also download these data in KML, GeoJSON or CSV formats.
Note:
All data available are in GCS datum EPSG:4326 WGS84 CRS (Coordinate Reference System).
You need to login for downloading the shapefile.
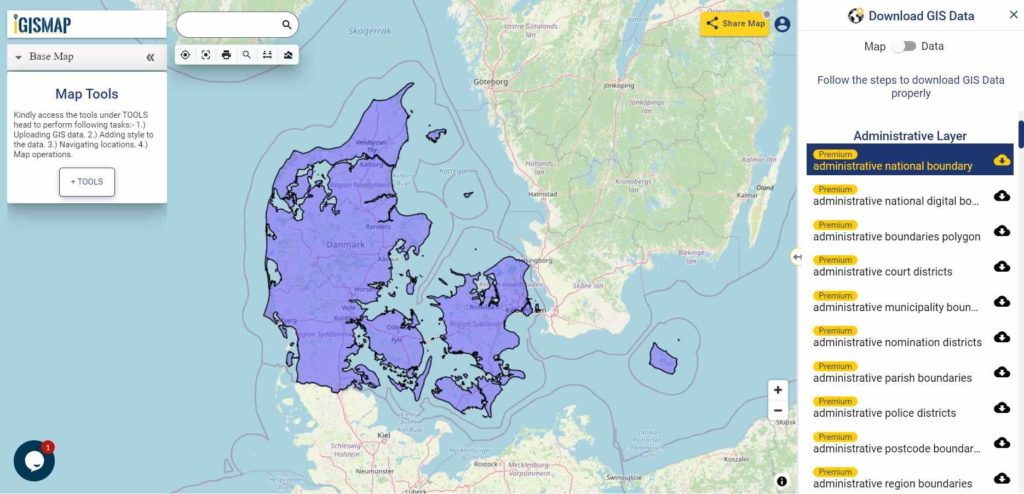
Download Free Shapefile Data of Denmark
Denmark is a Nordic country in Northern Europe. It is the most populous and politically central constituent of the Kingdom of Denmark, a constitutionally unitary state that includes the autonomous territories of the Faroe Islands and Greenland in the North Atlantic Ocean. European Denmark is the southernmost of the Scandinavian countries, lying southwest of Sweden, south of Norway, and north of Germany. Spanning a total area of 42,943 km2 (16,580 sq mi), it consists of the peninsula of Jutland and an archipelago of 443 named islands, of which the largest are Zealand, Funen and the North Jutlandic Island. Denmark’s geography is characterized by flat, arable land, sandy coasts, low elevation, and a temperate climate. As of 2022, it had a population of 5.88 million (1 March 2022), of which 800,000 live in the capital and largest city, Copenhagen.
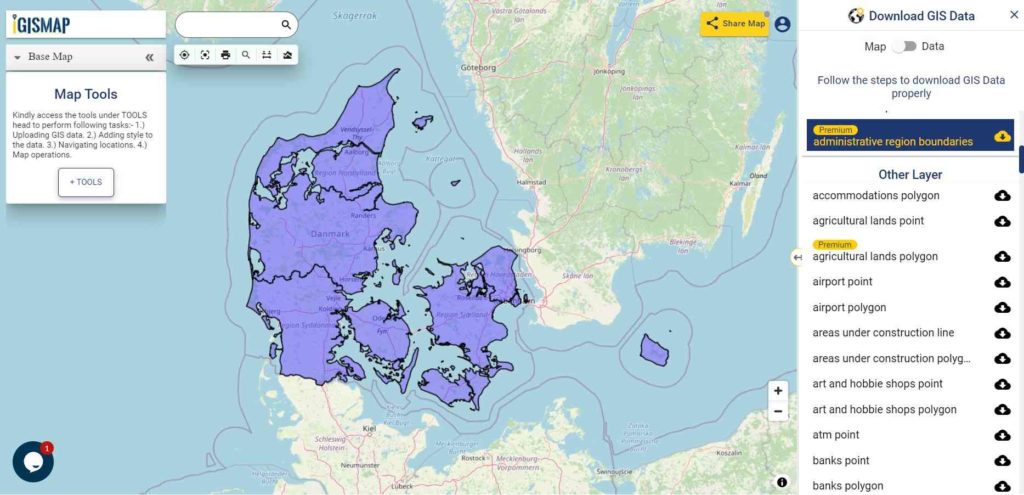
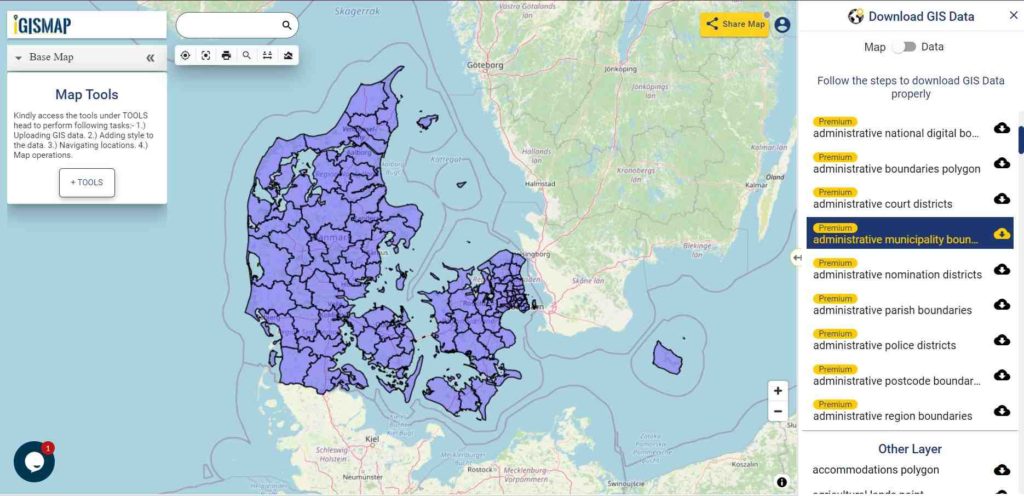
Denmark is divided into 5 regions. The governing bodies of the regions are the regional councils, each with forty-one councillors elected for four-year terms.
Disclaimer : If you find any shapefile data of country provided is in correct do contact us or comment below, so that we will correct the same in our system as well we will try to correct the same in openstreetmap.
Hello GIS enthusiasts, IGISMAP has now published the latest GIS vector data of Poland administrative levels. Links for downloading the shapefiles of the important administrative divisions of Poland are provided in the following. You can also download these data in KML, GeoJSON or CSV formats.
Note:
All data available are in GCS datum EPSG:4326 WGS84 CRS (Coordinate Reference System).
You need to login for downloading the shapefile.
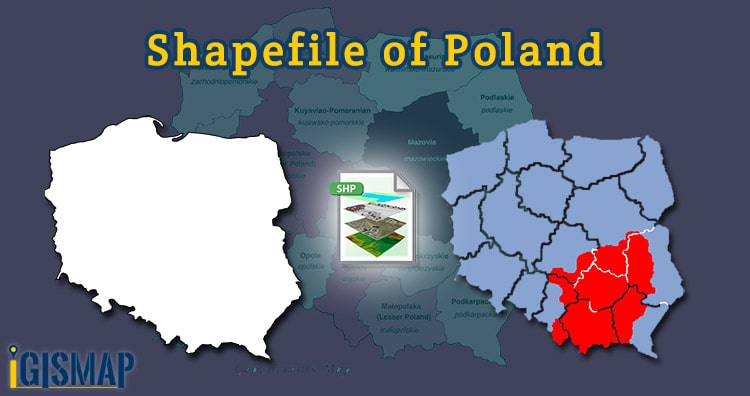
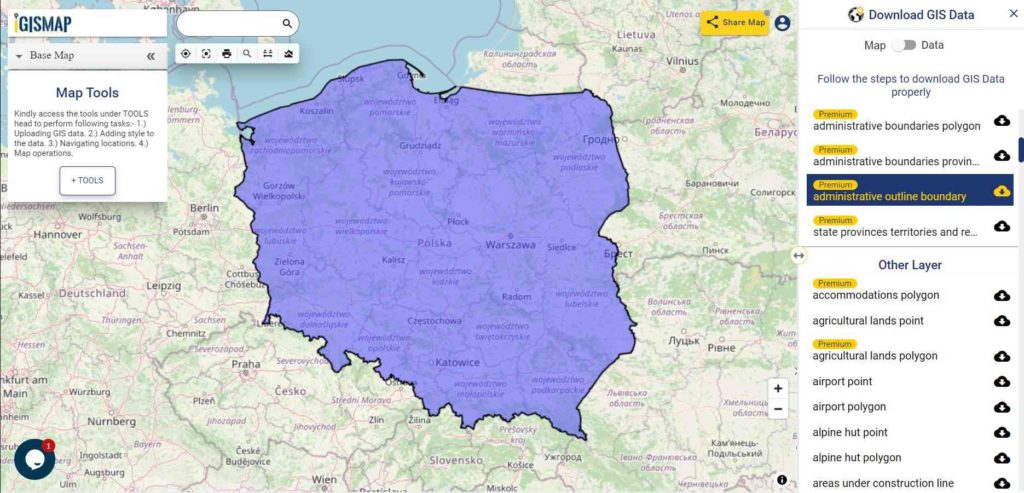
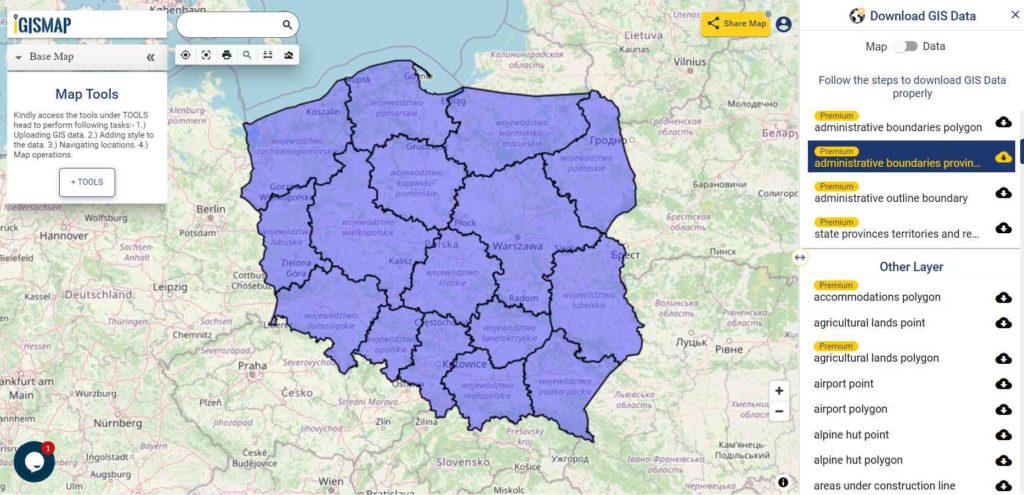
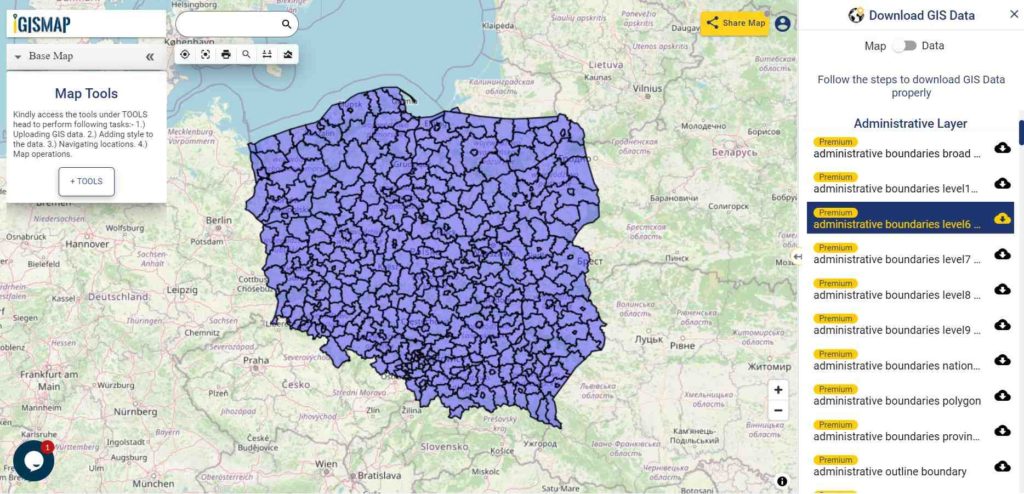
Download Free Shapefile Data of Poland
Poland, officially the Republic of Poland, is a country in Central Europe. It is divided into 16 administrative provinces called voivodeships, covering an area of 312,696 km2 (120,733 sq mi). Poland has a population of over 38 million and is the fifth-most populous member state of the European Union. Warsaw is the nation’s capital and largest metropolis. Other major cities include Kraków, Łódź, Wrocław, Poznań, Gdańsk, and Szczecin. Poland’s territory extends from the Baltic Sea in the north to the Sudeten and Carpathian Mountains in the south. The country is bordered by Lithuania and Russia to the northeast, Belarus and Ukraine to the east, Slovakia and the Czech Republic to the south, and Germany to the west. Poland also shares maritime boundaries with Denmark and Sweden.
Disclaimer : If you find any shapefile data of country provided is in correct do contact us or comment below, so that we will correct the same in our system as well we will try to correct the same in openstreetmap.
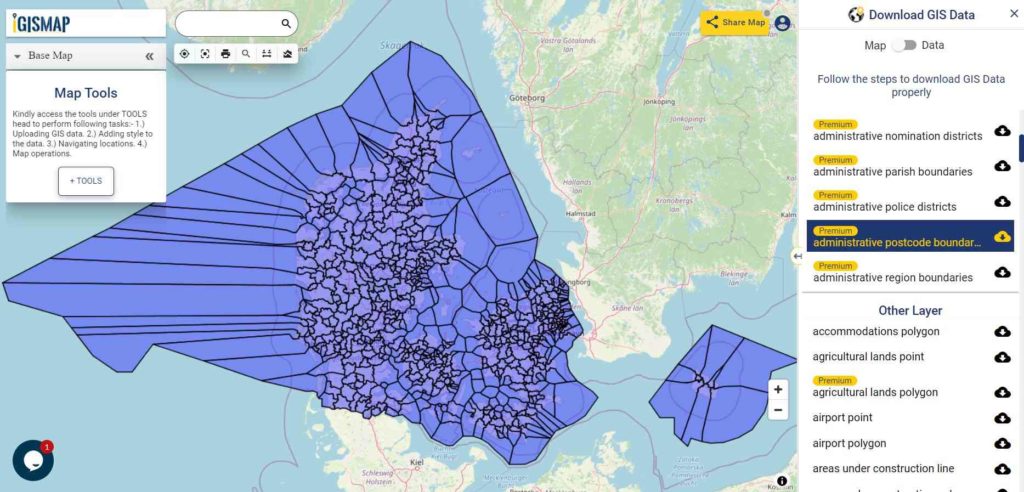
Hello GIS enthusiasts, IGISMAP has now published the latest GIS vector data of South Korea administrative levels. Links for downloading the shapefiles of the important administrative divisions of South Korea are provided in the following. You can also download these data in KML, GeoJSON or CSV formats.
Note:
All data available are in GCS datum EPSG:4326 WGS84 CRS (Coordinate Reference System).
You need to login for downloading the shapefile.
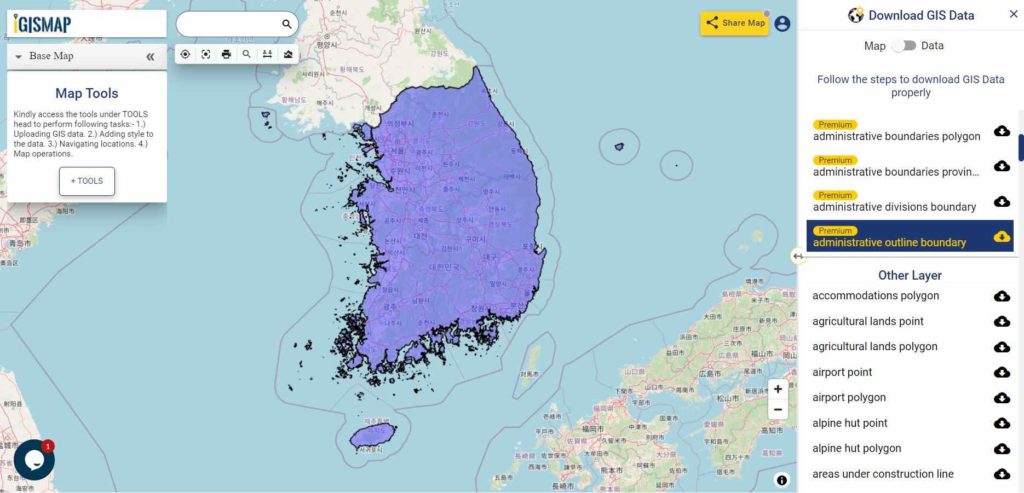
Download Free Shapefile Data of South Korea
South Korea, officially the Republic of Korea (ROK), is a country in East Asia, constituting the southern part of the Korean Peninsula and sharing a land border with North Korea. Its western border is formed by the Yellow Sea, while its eastern border is defined by the Sea of Japan. South Korea claims to be the sole legitimate government of the entire peninsula and adjacent islands. It has a population of 51.75 million, of which roughly half live in the Seoul Capital Area, the fifth largest metropolis in the world. Other major cities include Incheon, Busan, and Daegu.
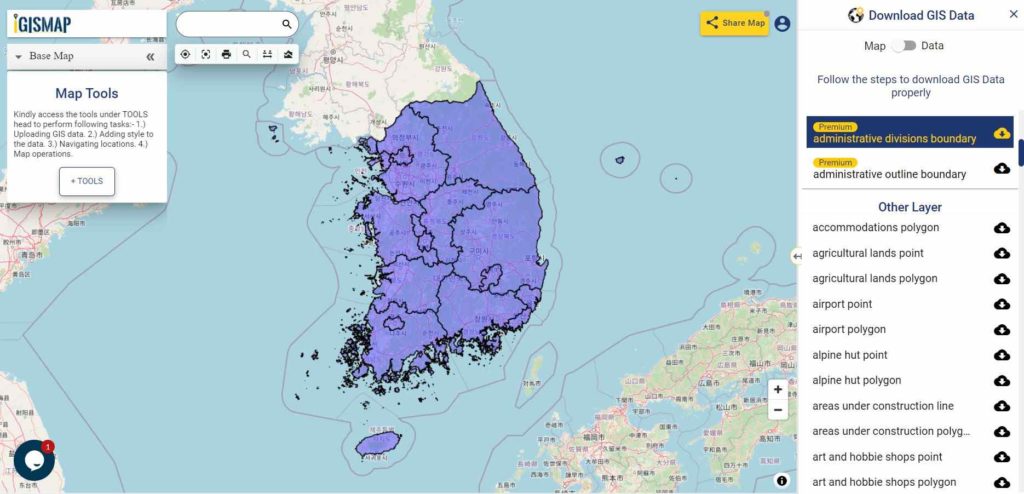
Download South Korea First Level Divisions Shapefile Data
South Korea is divided into 8 provinces (do), 1 special autonomous province (teukbyeol jachido), 6 metropolitan cities (gwangyeoksi), and 1 special city (teukbyeolsi).
Disclaimer : If you find any shapefile data of country provided is in correct do contact us or comment below, so that we will correct the same in our system as well we will try to correct the same in openstreetmap.
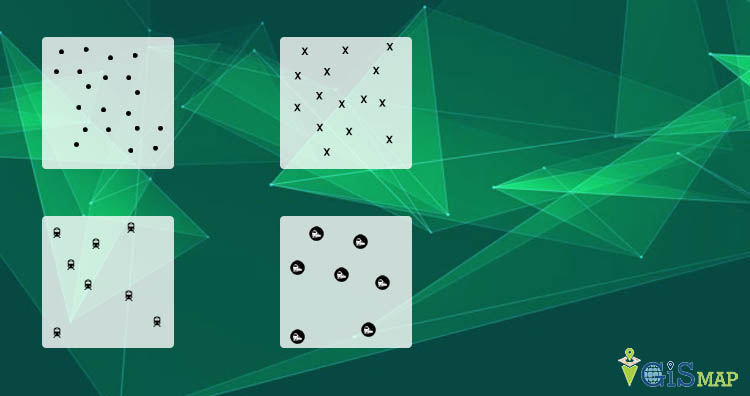
In GIS (Geographical Information System) vector data represents the information in points, lines and polygons. In GIS, you connect data with geography. So in this blog we discuss about GIS Tutorial basic spatial elements – Points, Lines and Polygons. Vector data formats represents geographical space that is intuitive and reminiscent of analog maps.
Basic Spatial Elements – Points, Lines and Polygons
Vector Point Data –
A point uses a single coordinate pair to define its location. Attributes of point describes its features. Points are considered to have no dimension even though in real world it have dimensions. Examples of Point data is power poles, telephone poles, a building.
In the below GIF you can see point feature.
In the below image you can see different points but all are representing railway station.
Vector Line Data –
When these points are connected then point data is converted into vector line data but it should not be enclosed . It uses a ordered set of coordinates. Line feature have multiple lines and points. Attributes may attach in every line, node and vertices. Hence each line may have multiple attributes rows of table. Examples of vector line data is road lines, topographic lines, power line, object outlines.
In the above GIF you can see vector line feature. It defines GIS very well by connecting data with location.
Vector Polygon Data –
When lines are connected into enclosed shape then this type of data termed as polygon data. Polygon should be closed. The start and end point should have the same coordinates. Examples of vector polygon feature are school boundary, city or any political line.
This is all about vector point, line and polygon feature. We have learned that vector data is used to represent real world data into point, line and polygon features. And each vector feature has attribute which shows its information. We try our level best, still you have doubt please do comment below.
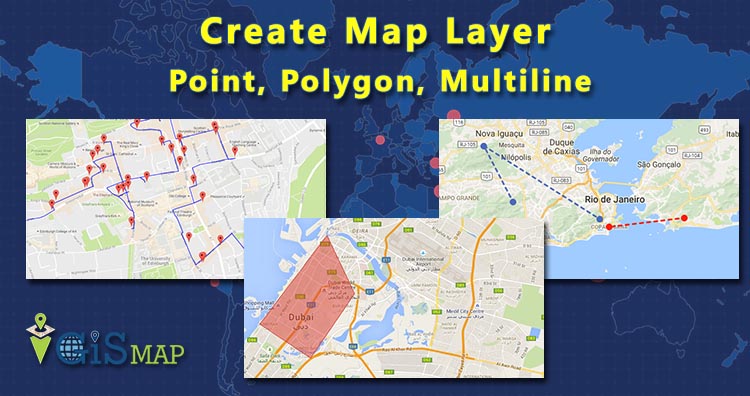
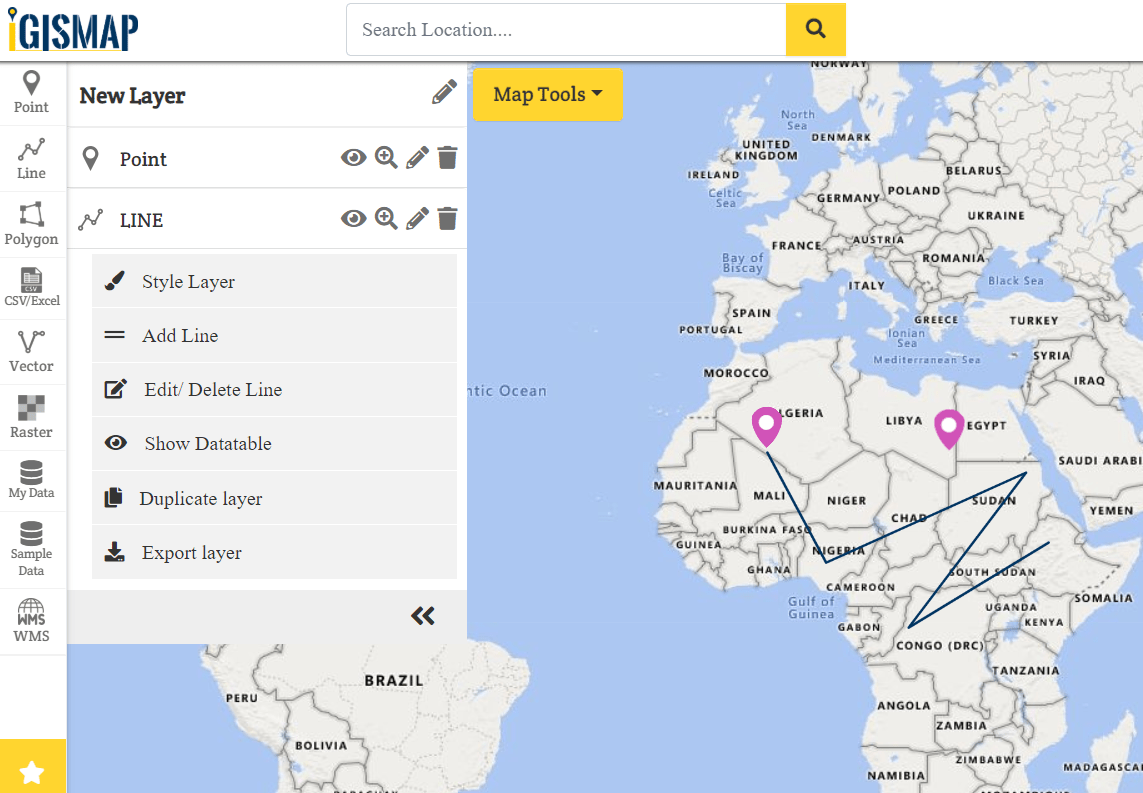
Hey GIS enthusiast using GIS MapOG Tool you can easily create map layer – point, polygon, multiline and multipolygon. After creating Layer you can export layer in any format like Shapfile, KML, KMZ, Geojson and more.
If you want to learn GIS please Contact akshay@engineerphilosophy.com
For detailed steps watch video –
Create Map Layer – Point, Polygon, Multiline
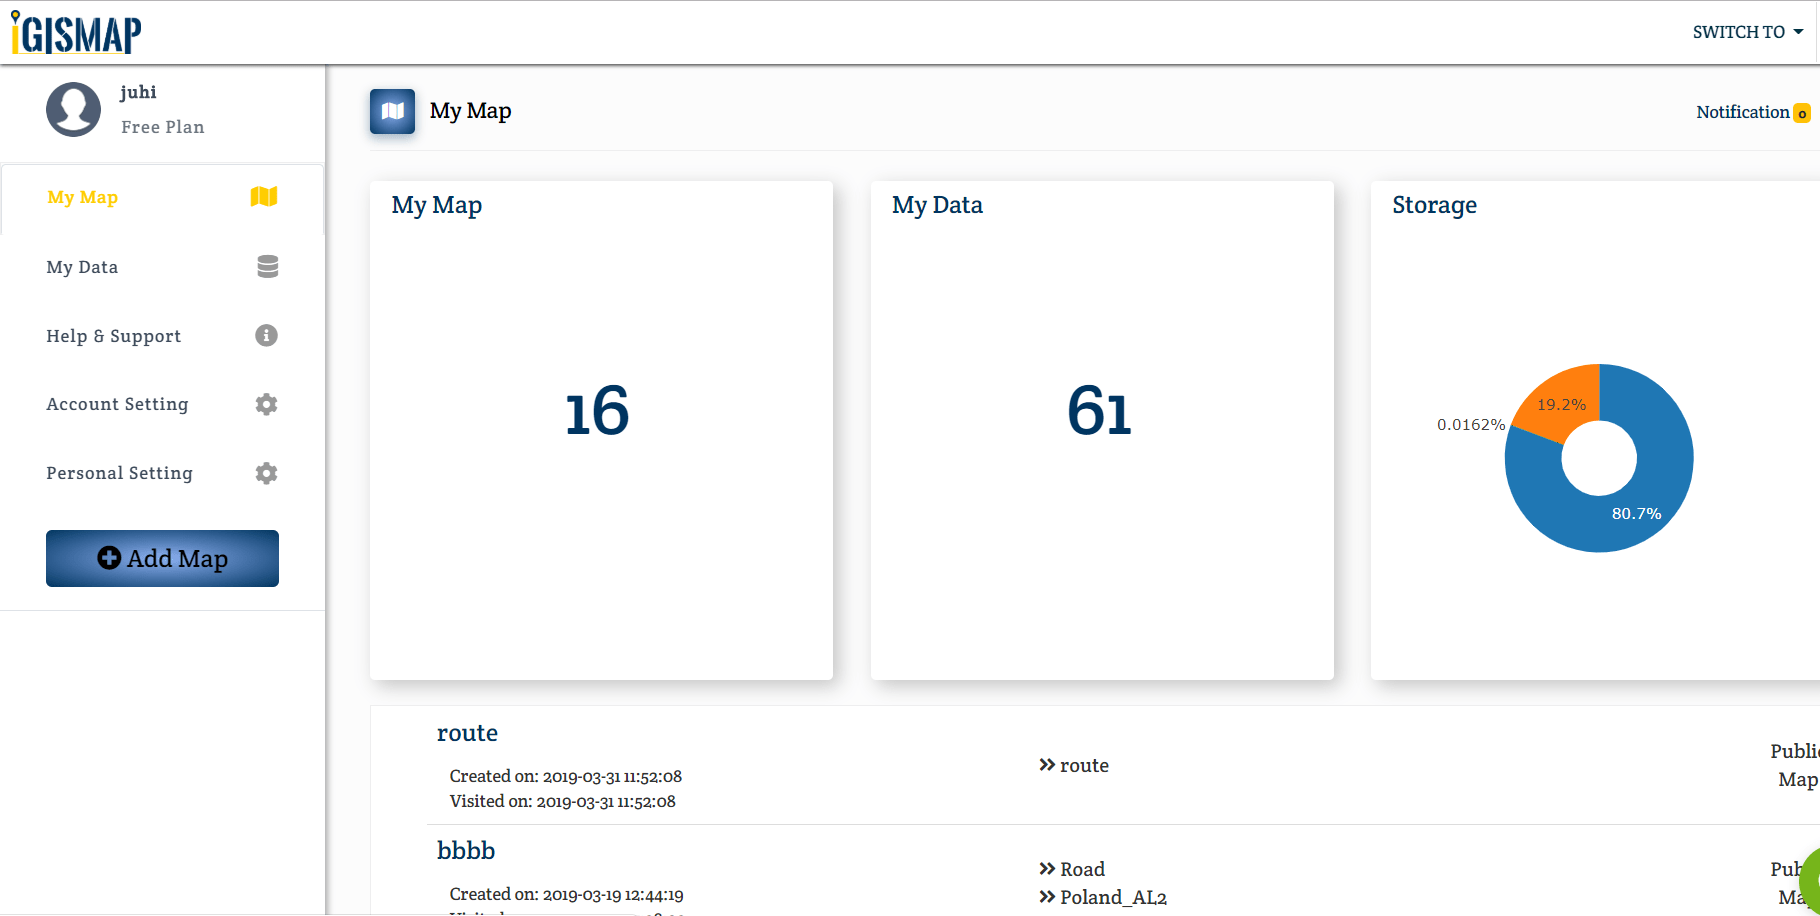
Go to IGIS Map Tool Now MAPOG, Login or Register on the tool. After Login you will be directed to the next screen i.e Dashboard where, click on Add map.
Now fill the tittle and description of map. Click on Save Map.
You will be directed to the canvas of IGIS Map Tool.
Now choose the type of geometry of the layer you want to create. For Point select point from left hand side button.
Suppose we selected Point button then fill the layer name and enter the attributes. After filling all the fields click on create. In a map you can select multiple layer.
Select add point and go to base map where you want to create point layer. Save the points on the map.
We can Add, Delete, Duplicate, View Data table, and Export layer.
We can do styling of layer like change the colour of icon and increase or decrease the size of point or you can custom the icon.
Same as to be done for line and polygon.
This is all about creating map layer. If you face problem in implementing this above steps please do comment below.
Switching between Google Maps and OpenStreetMap in React Native : In this post I am going to discuss about Google Maps and OpenStreetMap in react native with one example.This example code will just show the Google Maps and OpenStreetMap on the screen of mobile ,but before going to detail of this article I suggest you to read the following page:
Add your API key to your manifest file (android/app/src/main/AndroidManifest.xml):
<application>
<!-- You will only need to add this meta-data tag, but make sure it's a child of application -->
<meta-dataandroid:name="com.google.android.geo.API_KEY"android:value="Your Google maps API Key Here"/>
</application>
In our example ,there are four java script file as follow:
index.js
App.js
GoogleMapScreen.js
OpenStreetMapScreen.js
index.js:
import {AppRegistry} from 'react-native';
import App from './App';
import {name as appName} from './app.json';

AppRegistry.registerComponent(appName, () => App);
In App.js java script file,we are importing component from native-base and React-Navigation 3.x ,we need to install:
Install NativeBase
npm install native-base --save
Install Peer Dependencies
react-native link
Install thereact-navigation package
npm install --save react-navigation
install react-native-gesture-handler :
npm install --save react-native-gesture-handler
Link all native dependencies:
react-native link
In this code , one drawer is created for two screen namely GoogleMapScreen and OpenStreetMapScreen , for more detail on drawer in react-navigation 3.x ,you can refer to following post:
When you will run above Project ,following output will come:
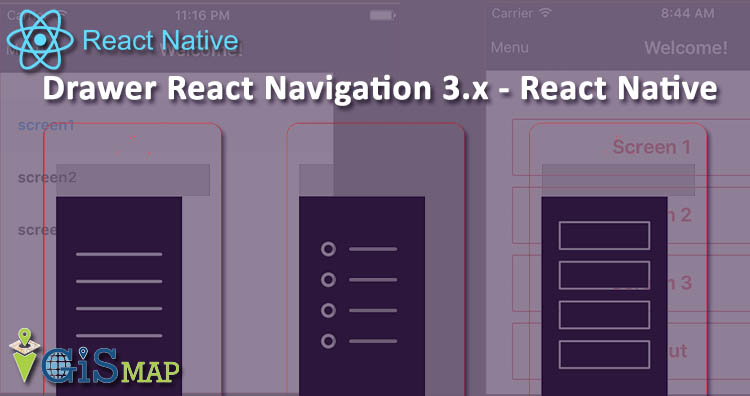
In the header ,we are having menu on left side. On the click of this menu,a drawer will open as shown below:
We are having two option in drawer 1)Google Maps 2)OpenStreetMap. When we will click Google Maps ,Google Map will be on screen as shown by first ScreenShot , now when we will click second option of OpenStreetMap then output will be as shown below:
So, this all about switch from Google Map to OpenStreetMap in react native. Please do comment if something’s missing.
Drawer React Navigation 3.x – react native: In this post we are going to learn about drawer navigation of React Navigation 3.x with one example,, but before going to detail of this article I suggest you to read the official documentation of React navigation 3.x as follow:
In our Project we are having two java script file as follow:
index.js
App.js
index.js :
import {AppRegistry} from 'react-native';
import App from './App';
import {name as appName} from './app.json';

AppRegistry.registerComponent(appName, () => App);
App.js :
import React, { Component } from 'react';
import { View } from 'react-native';
import { createDrawerNavigator,createAppContainer } from 'react-navigation'
import { Button,Container,Header,Left,Right,Icon,Text } from 'native-base';

class MyHomeScreen extends React.Component {
  render() {
    return (
      <Container>
        <Header>
          <Left style={{ flexDirection: 'row'}}>
           <Icon onPress={() => this.props.navigation.openDrawer()} name="md-menu" style={{ color: 'white', marginRight: 15 }} />
          </Left>
          <Right>
           <Icon name="md-cart" style={{ color: 'white' }} />
          </Right>
        </Header>
       <View style={{ marginTop:100,marginLeft:100}}>
         <Button onPress={() => this.props.navigation.navigate('Notifications')} >
           <Text>Go to notifications</Text>
         </Button>
        </View>
       </Container>
     );
   }
 }// End of MyHomeScreen class

class MyNotificationsScreen extends React.Component {
   render() {
     return (
       <View style={{ marginTop:100,marginLeft:100}}>
         <Button onPress={() => this.props.navigation.goBack()} >
           <Text>Go back home</Text>
         </Button>
       </View>
     );
    }
}//End of MyNotificationsScreen class

const MyDrawerNavigator = createDrawerNavigator({
   Home:{
      screen: MyHomeScreen,
   },
   Notifications: {
      screen: MyNotificationsScreen,
   },
 });

const MyApp = createAppContainer(MyDrawerNavigator);

class App extends React.Component{
    render(){
      return(
        <Container>
          <MyApp >
            </MyApp >
        </Container>
      );
    }
}//End of App class

export default App;
In above code of App.js file we have used component of native base ,and therefore we will install native base as follow :
Install NativeBase
npm install native-base --save
Install Peer Dependencies
react-native link
Explaination of App.js :
In this file App.js, we have define three class namely as follow:
MyHomeScreen
MyNotificationsScreen
App
and two constants as follow:
MyDrawerNavigator
MyApp
We are creating two screen with the help of two class MyHomeScreen and MyNotificationsScreen
In this class we are creating header of screen ,on left side of header we are creating Icon of “md-menu”,and onPress of this Icon we have open the drawer with the help of this code :
class MyNotificationsScreen extends React.Component {
  render() {
   return (
     <View style={{ marginTop:100,marginLeft:100}}>
      <Button onPress={() => this.props.navigation.goBack()} >
       <Text>Go back home</Text>
      </Button>
     </View>
   );
  }
}//End of MyNotificationsScreen class
Explaination of MyNotificationsScreen class :
In this class we are creating a button ,and on press of this button we are going back to home screen from this notification screen ,for this we are using following code:
Geolocation in React Native is the identification or estimation of the real-world geographic location of a mobile phone .
In this post, we will discuss how to find Geolocation of mobile phone in react native with one example, but before going to detail of this post I suggest you to read the official documentation.
Our App will request access to location, for this we need to add following line of code in our App’s AndroidManifest.xml which is located at android/app/src/main/AndroidManifest.xml in our App.
The error callback will be passed a standard error message.
The config object has
enableHighAccuracy (boolean)— which allows you to get the most accurate location.
timeout (milliseconds)— how long does the API have to return the position before throwing an error?
maximumAge (milliseconds) — if a location exists in the device cache, how old can it be before it’s no longer valuable to your app?
Example
Here we are discussing one example in which we will try to find out the current position of mobile( latitude,longitude).In our project there are two file:
index.js
App.js
index.js
import {AppRegistry} from 'react-native';
import App from './App';
import {name as appName} from './app.json';

AppRegistry.registerComponent(appName, () => App);
The componentDidMount() method is called at the time of initializing of a component .so when this method is called we find the location of mobile by calling getCurrentPosition() method as shown above in code.
navigator.geolocation.getCurrentPosition() has three argument
This is the second argument of getCurrentPosition() method ,and this is an error callback parameter of method ,in this we are collecting error in error if it occur. and with the help of setState() method ,we are storing the error message into error of App class.
This is the third argument of getCurrentPosition() method, a configuration object, in this we are suppling three value enableHighAccuracy: true, timeout: 20000, maximumAge: 1000.
In this render method we are creating a card and on this card we are printing the location of mobile in terms of latitude and longitude if error is null otherwise we print the error on screen of mobile.
So this about all about React Native Geolocation- GPS. If you phase any problem in implementing please let us know by commenting below.
Want GIS application – Please contact us at juhi@engineerphilosophy.com
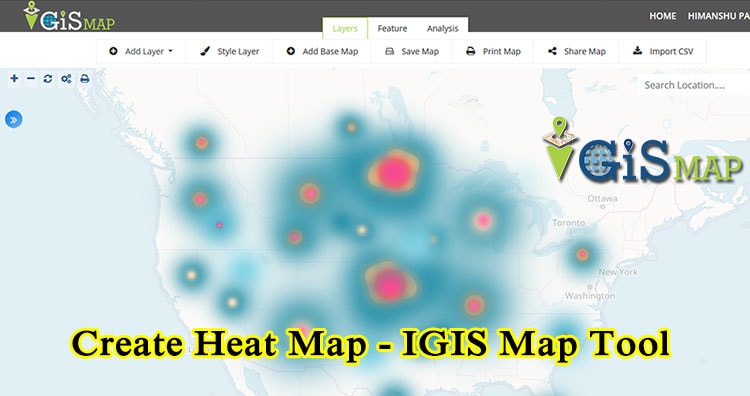
Using Heat map is very effective way of visualizing points data. To create Heat map, first of all you must know what is heat map. When map visual of a location data is so dense and tightly packed that it does not make much sense a heat map is used. Heat maps are ordinarily used when mapping “points”. In this article we are providing pictorial tutorial of Create Heat Map using IGIS Map Tool
To create Heat map with IGIS Map Tool, you also need to look over the GIS MapOG HeatMAP Tool.
Heat Map allows user to display the density of the geographic points in a map. Heat map uses geographic points as a gradient color layer to style the map.
To create Heat Map with IGIS Map Tool you need to follow some steps as follows:
Go To GIS MapOG Heat MAP Tool and login to your account or register if you are new user with name, email id, Organization name and role in examination.
Click on Create New Map and fill the tittle of map with its description.
Next screen will be redirected to the canvas where you can create, upload or use sample data for your heat map creation.
Upload a layer from data set.
Once the map is uploaded click on publish layer.
Select style layer by right click on the layer in side bar.
Now click on the Heat map section to create Heat map.
The distance between points for clustering is the merge radius here. The greater the number of points that fall within the radius, the greater the intensity of the heat map. While a radius set too small will generate isolated spots; a radius set to large will show no detail.
Now fill the opacity in the fill section to set the transparency of the heat map layer between 100% and 0%.
Heat map use red color to show high density of points and blue color for the low density of point area.
Below is the heat map of disaster management using sample data.
Use of Heat Map
This type of identification and visualization is useful for visualizing density of the geographic points and also used for business analysis and demographics mapping.
For example, Heat Map can be used by Disaster Management Firm. As when a DM needs to calculate the flood disaster data it uses the heat map.
While data and business analysis is the main reason to Create Heat Map, but it can also helps in understanding and comparing the data easily. It is also very common practice to use the Heat Map in Disaster and Risk management.
I hope this may help you in develop and Create Heat map with IGIS Map Tool. So if you find any problem in creating one such example do let us know by commenting below.
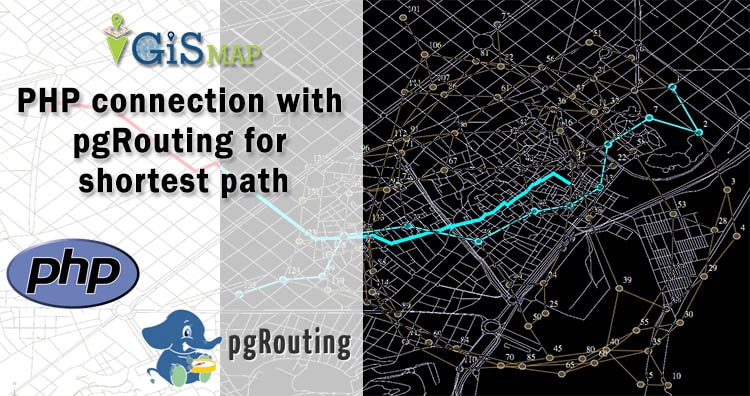
Here in this post we do PHP connection with pgRouting for shortest path. Here we have explained how we can add source and destination point in table and how can we query for shortest route. In this demo we have made a connection between pgrouting and PHP using code igniter using code igniter framework.
Here we have uploaded shape file in postgis. For doing this you need to install postgres and create a database. Everything is already explained in earlier tutorial.
You can also check Postgres with QGIS.
Now the same procedure is implemented using PHP in code igniter framework. As we have an idea about code igniter, which has three main component as view, model and controller.
VIEW-
In view section we will be adding PHP code for presenting the shapefile and the output shortest route.
Model-
In model section will be writing query for getting two end points and shortest path.
Controller-
In controller section we will make function for registration, login and distance.
First of all you need to render your shape file on map. The map can be Google map, Open street map or any other map. For rendering the shape file using leaflet you need to add plugin in your script, which can be downloaded from https://github.com/calvinmetcalf/leaflet.shapefile link. Passing shapefile in L.Shapefile() method and calling addTo(map) method we can add the shapefile on map. After that we need to create input boxes for user to enter end points latitude and longitude. Using ajax we have send these latitude and longitude of both start and end point to model and got the result back in view.
$.ajax({
type: 'POST',
url: "<?php echo base_url('index.php/User_Authentication/distance');?>",
data:{dlat1:lat1,dlong1:long1,dlat2:lat2,dlong2:long2},
dataType: 'JSON',
success: function (response) {
var data= response;
var latitude= parseFloat(response['latitude']);
var longitude= parseFloat(response['longitude']);
var geodata= GeoJSON.parse(data, {Point: ['longitude','latitude']});
geojsonLayer = L.geoJson(geodata).addTo(map);
},
error: function (errorThrown){
check_status= 0;
console.log(errorThrown);
}
});

Write Query in Model
In model section we have written an insert function, which will help us to insert the obtained latitude longitude points from user in query. The query takes latitude longitude as input. As given
insertLatLong($dlat1,$dlat2,$dlong1,$dlong2){}

Then take out the id for given source and destination point and saved them as result in variable start and end.
$start = $this->db->query("SELECT source FROM network1 ORDER BY geom <-> ST_SetSRID(ST_Point ($dlong1,$dlat1),4326) LIMIT 1")->result();
$end= $this->db->query("SELECT source FROM network1 ORDER BY geom <->  ST_SetSRID(ST_Point ($dlong2,$dlat2),4326) LIMIT 1")->result();
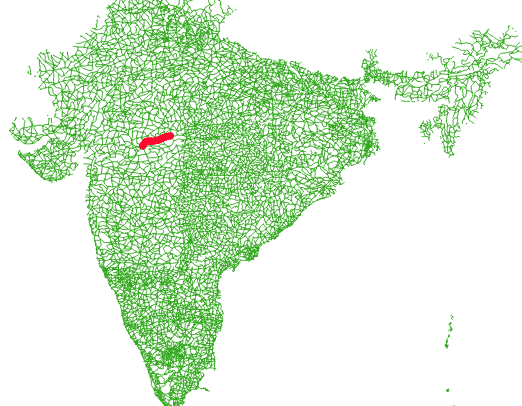
After completing this wrote query using pgr_dijsktra method. This is an algorithm to find out the shortest path. This takes shape file table, start point , end point, boolean result for directed/undirected route and boolean result for having/not having route cost. To get the geometry column from network table applied join. Take this result in calculation variable.
After this check for the number of row i.e. the result of query is not empty and take result in distance variable and return is to controller.
public function insertLatLong($dlat1,$dlat2,$dlong1,$dlong2) {
$calculation= $this->db->query("select seq, id1, id2, cost, geom, ST_X(ST_AsText(ST_StartPoint((ST_AsText(ST_LineMerge(ST_GeomFromText(ST_AsText(geom)))))))) as latitude, ST_Y(ST_AsText(ST_StartPoint((ST_AsText(ST_LineMerge(ST_GeomFromText(ST_AsText(geom)))))))) as longitude
from pgr_dijkstra('Select gid as id, source, target, st_length(geom::geography)/1000 as cost from network1',
$start ,$end ,false, false) as di JOIN network1 pt ON (di.id2 = pt.gid)");

if($calculation->num_rows()>0) {
$distance= $try->result();

return $distance;

} else {

return false;
}
}

Call Function in Controller
In the controller, we can call the insert function and pass the required input to called function and also can load the view. Here for this article we have made login session and registration of user. This distance function takes the data in variable in sends to insertLatLong function in Login_Database model.