Geographic Information System is a system intends to capture, Store, manage, manipulate, analyze the data.
GIS Data by MAPOG is a user-friendly platform that allows users to download railway station data in various GIS formats, including Shapefile, KML, and GeoJSON. It provides an intuitive interface to access railway station data globally, helping in detailed mapping and analysis for transportation planning, infrastructure development, and research. With railway station data available in multiple formats, users can integrate it seamlessly into GIS applications for enhanced geospatial insights.
How to Download Railway Station Data Using GIS Data by MAPOG?
GIS Data by MAPOG simplifies the process of downloading railway station data by offering a step-by-step guide. The platform covers over 200 countries and provides access to more than 900+ data layers, ensuring compatibility with various GIS applications.
Download Railway Station data of any countries
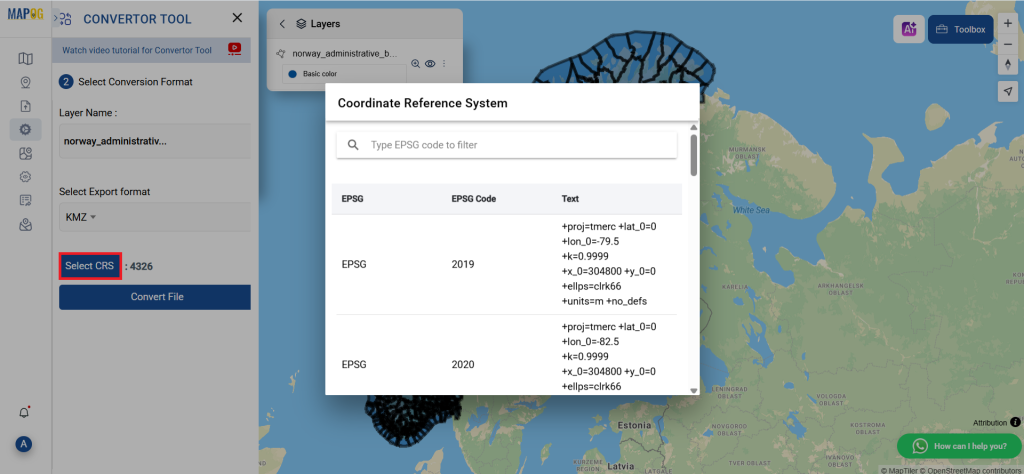
Note:
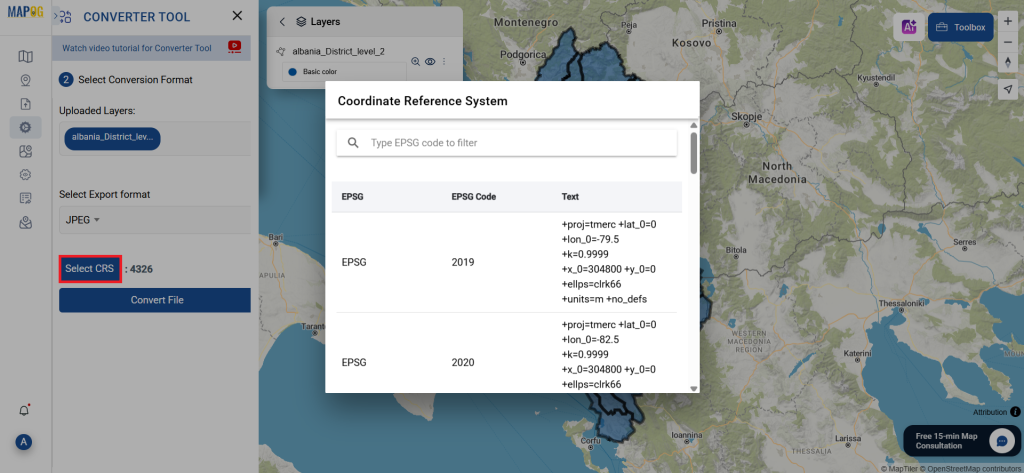
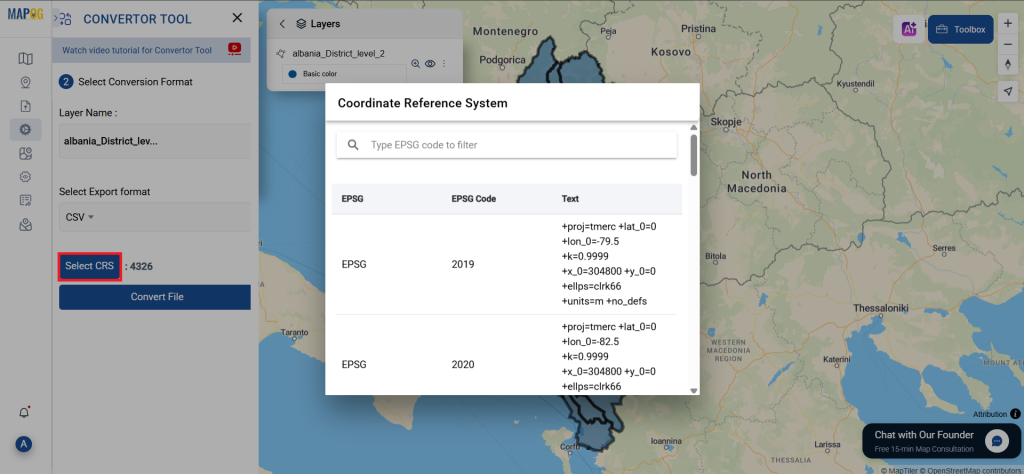
- All data is provided in GCS datum EPSG:4326 WGS84 CRS (Coordinate Reference System).
- Users need to log in to access and download their preferred data formats.
Step-by-Step Guide to Download Railway Station Data
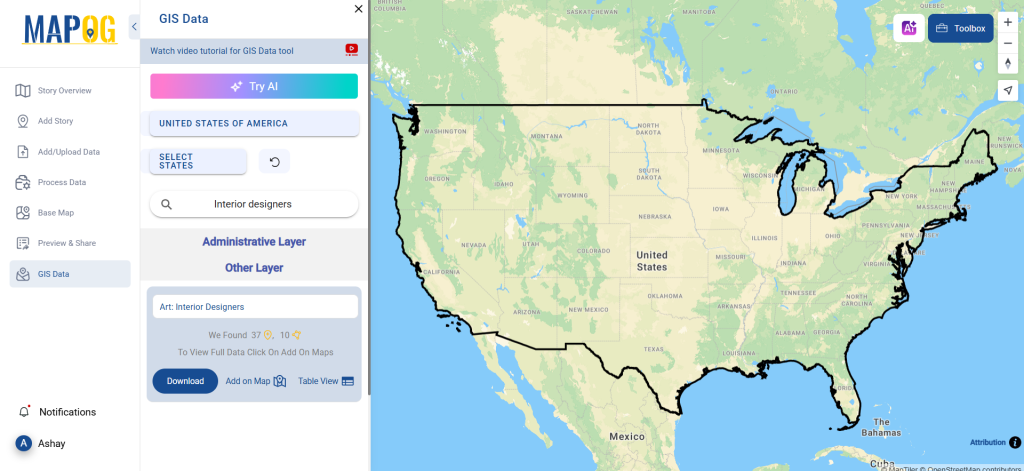
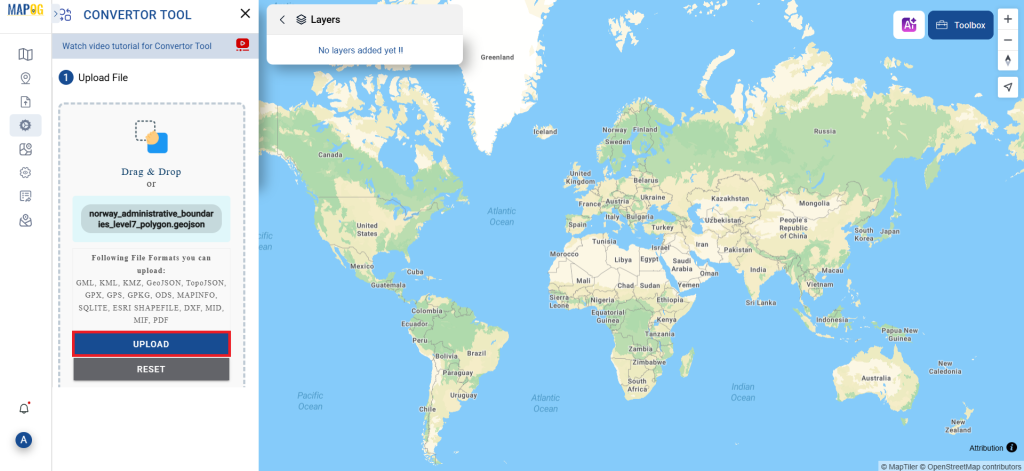
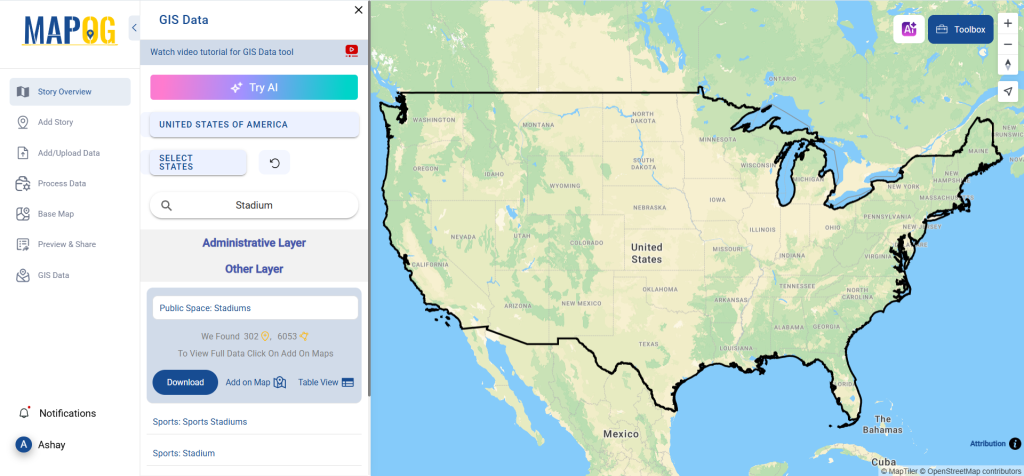
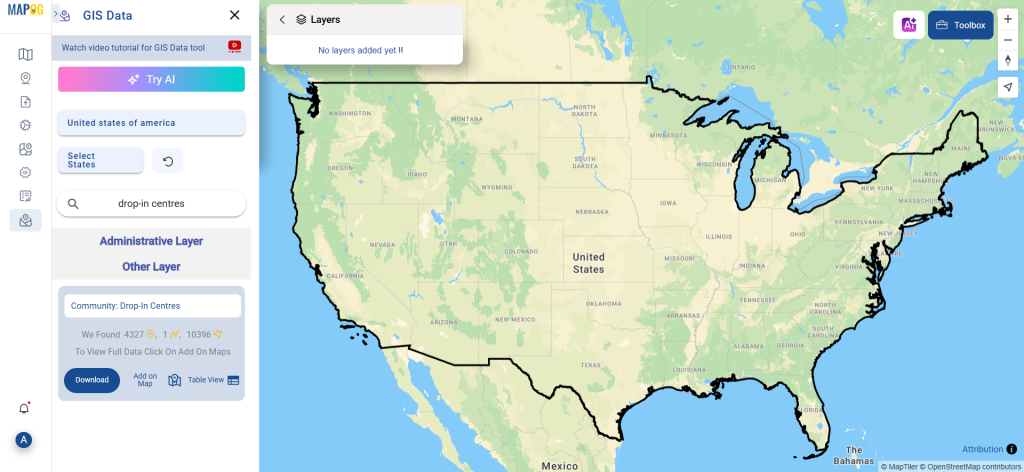
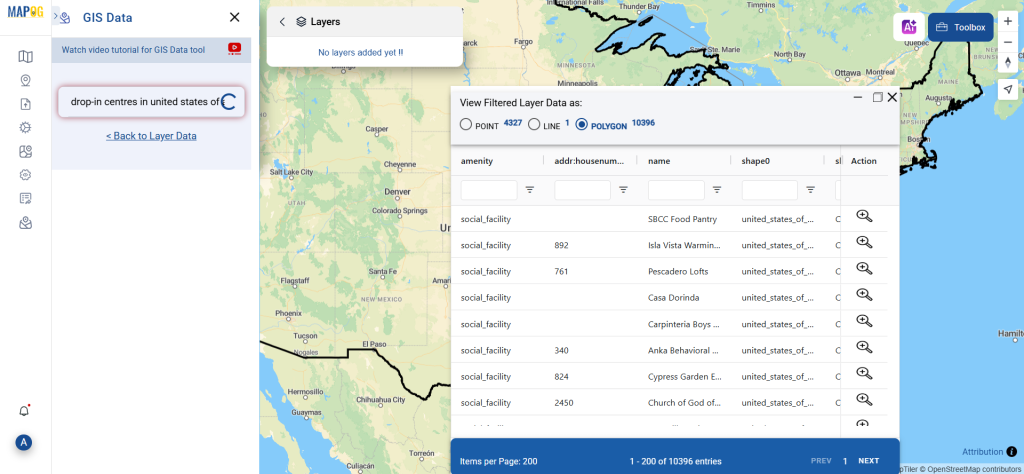
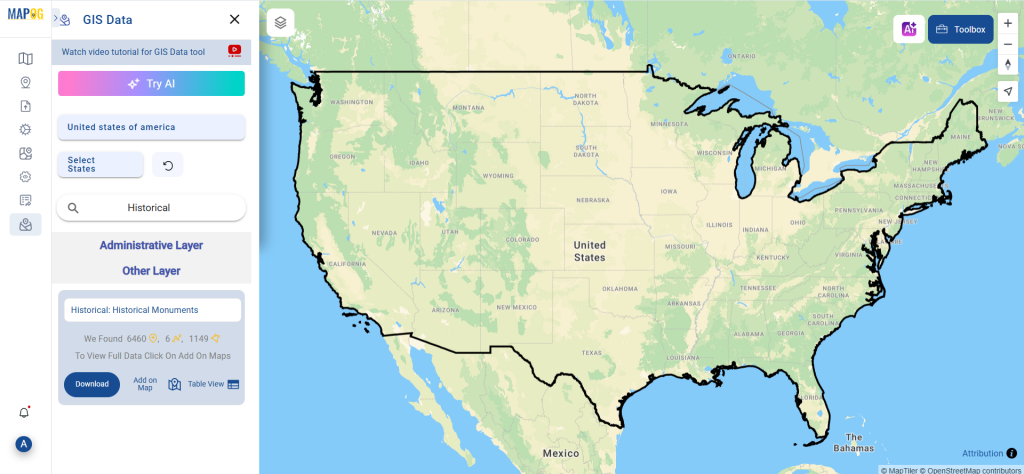
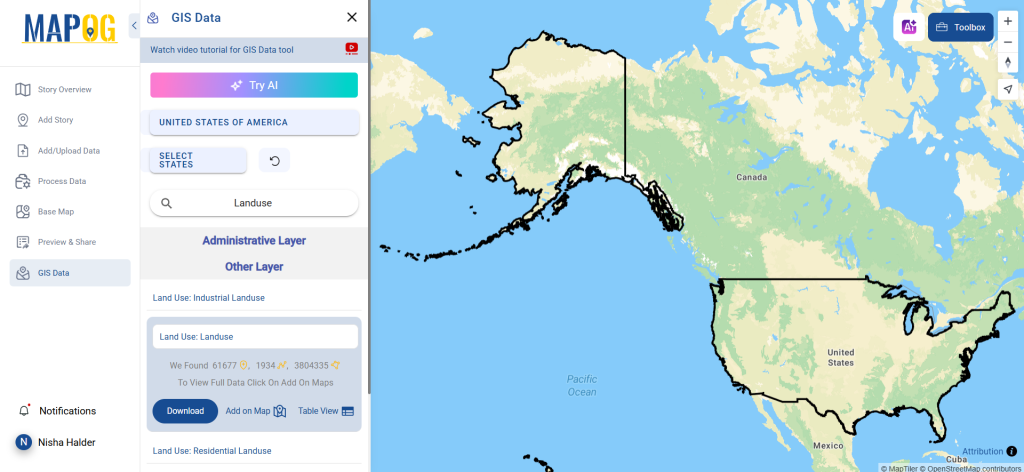
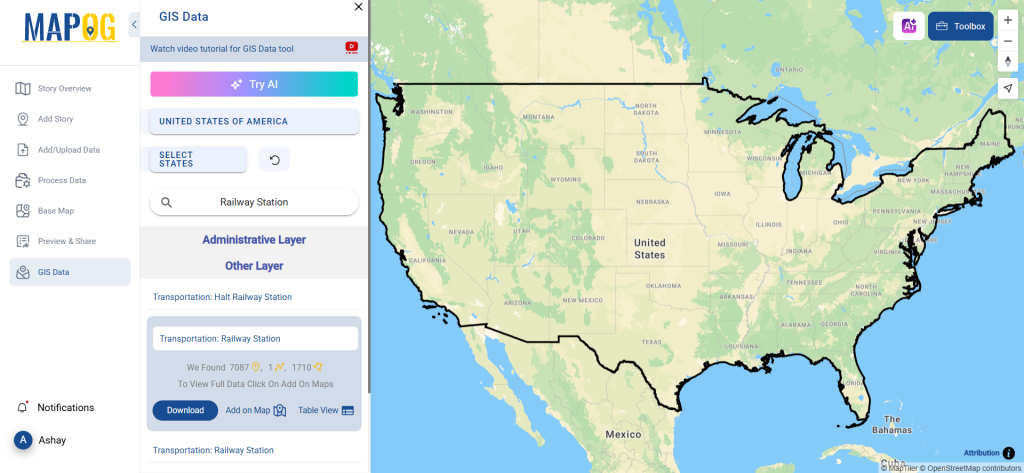
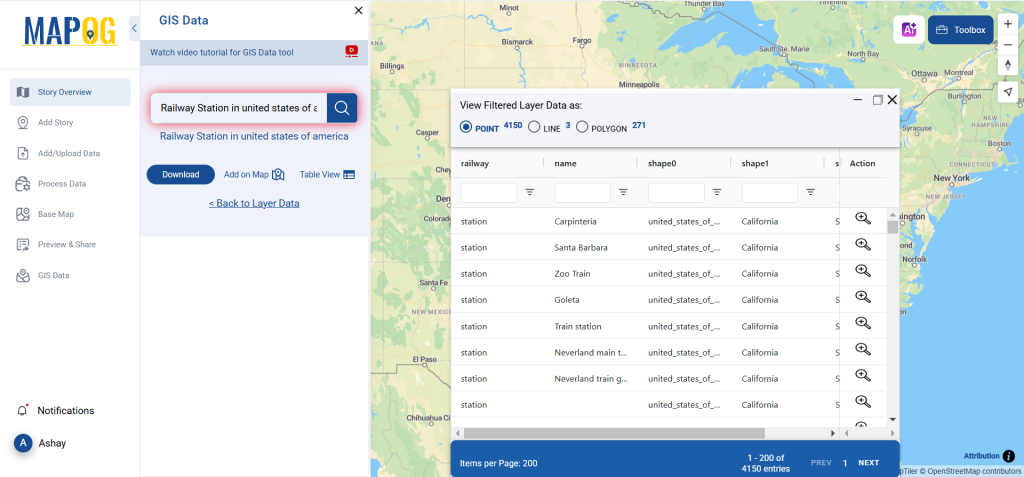
Step 1: Search for Railway Station Data
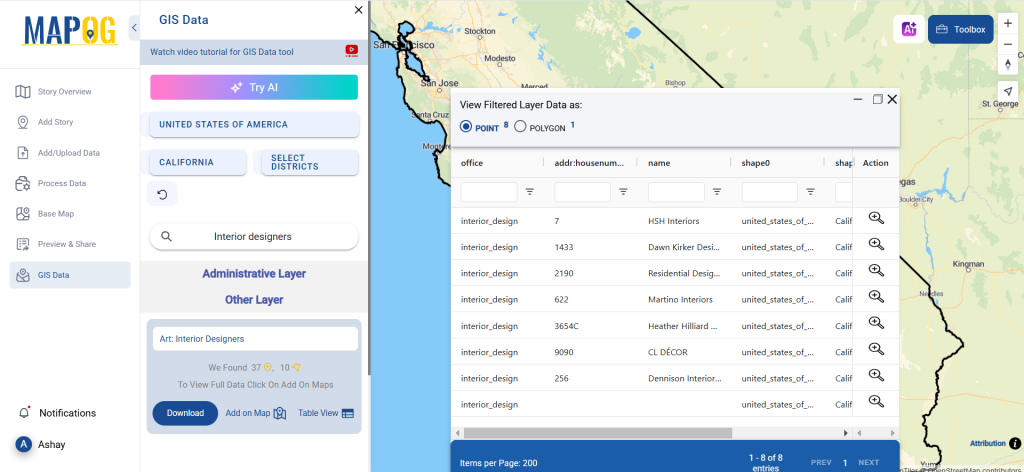
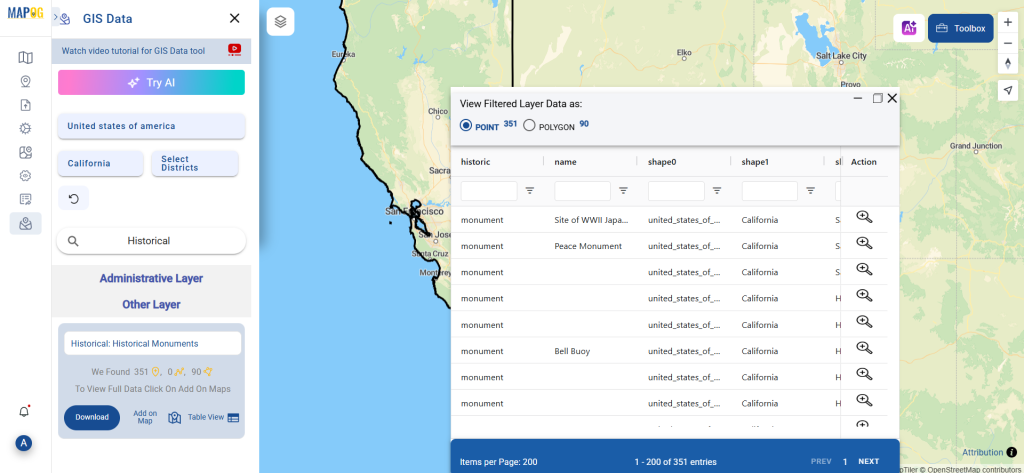
Log in to MAPOG and access the GIS Data section. Select the country of interest, then use the search function to locate the “Railway Station data” layer. The platform allows users to explore data attributes, whether represented as points or polygons.
Step 2: Utilize the AI Tool for Easy Search
Try the AI-powered “Try AI” tool located in the upper left corner. Enter your required railway station data along with the location, and the AI will quickly fetch the most relevant datasets. This feature speeds up the search process, making data retrieval more efficient.
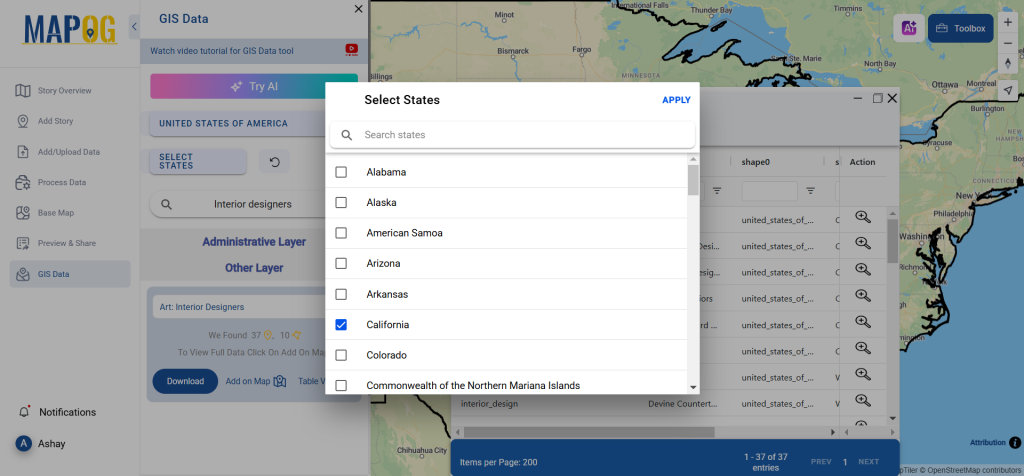
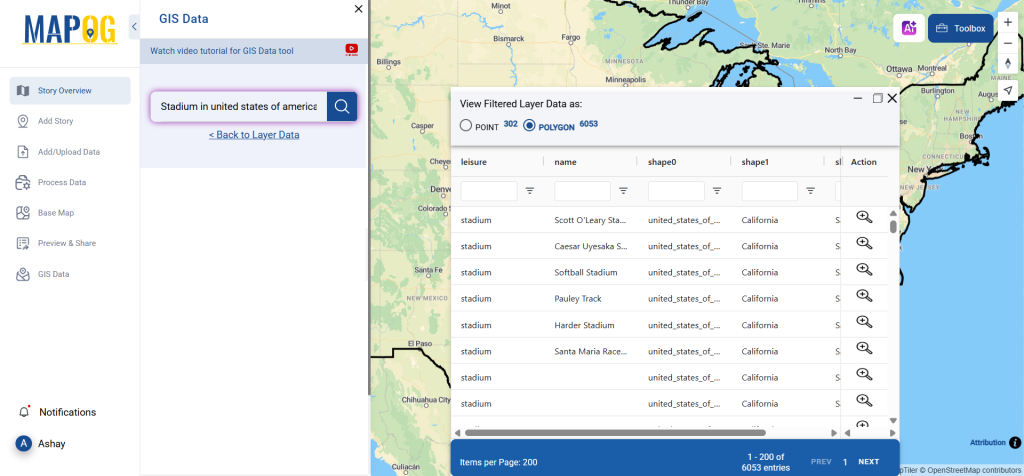
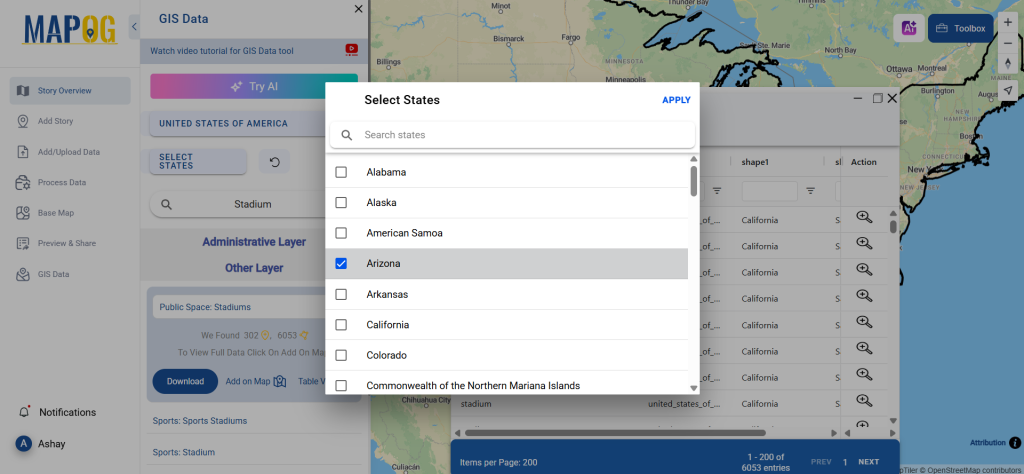
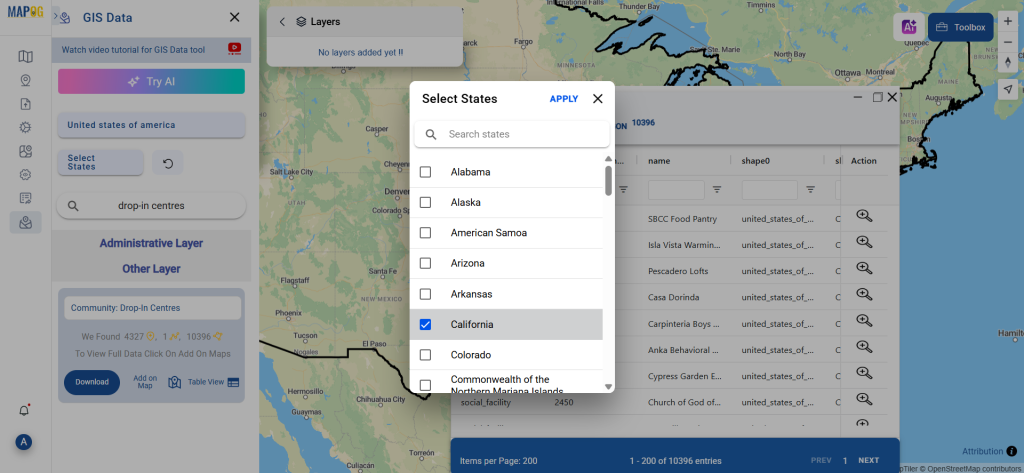
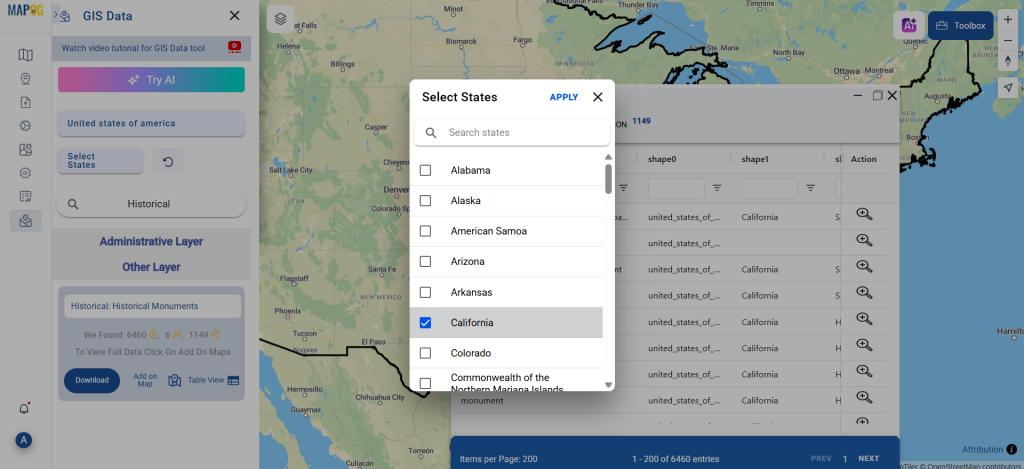
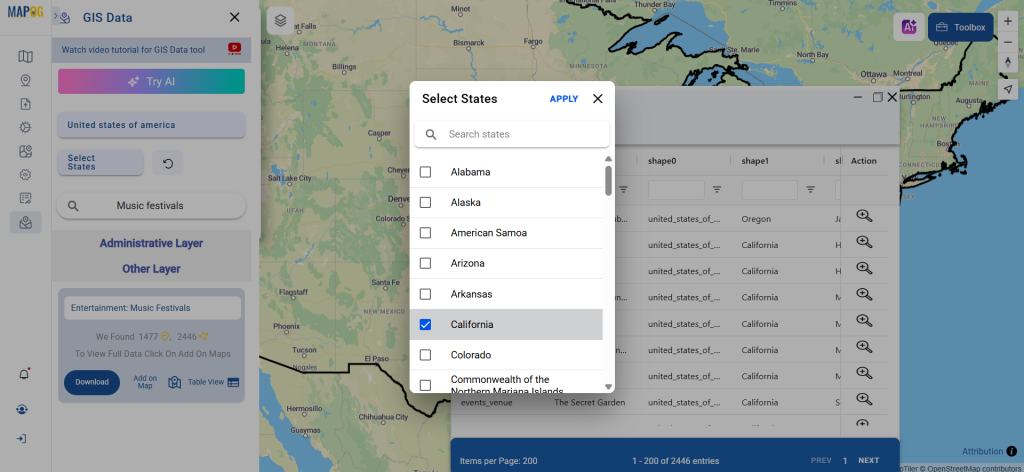
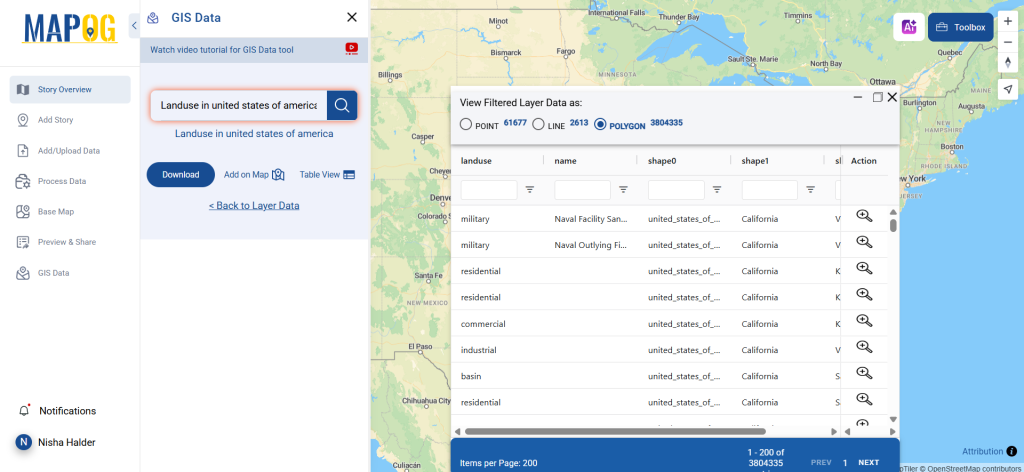
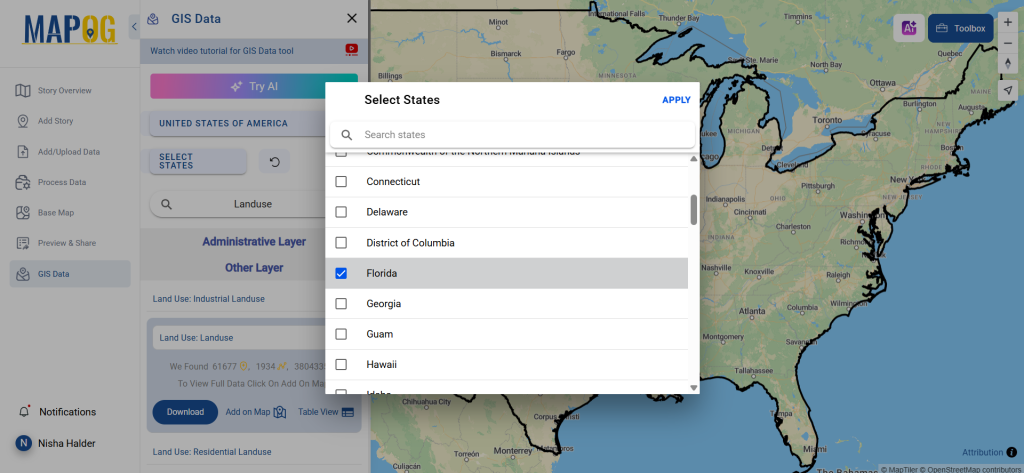
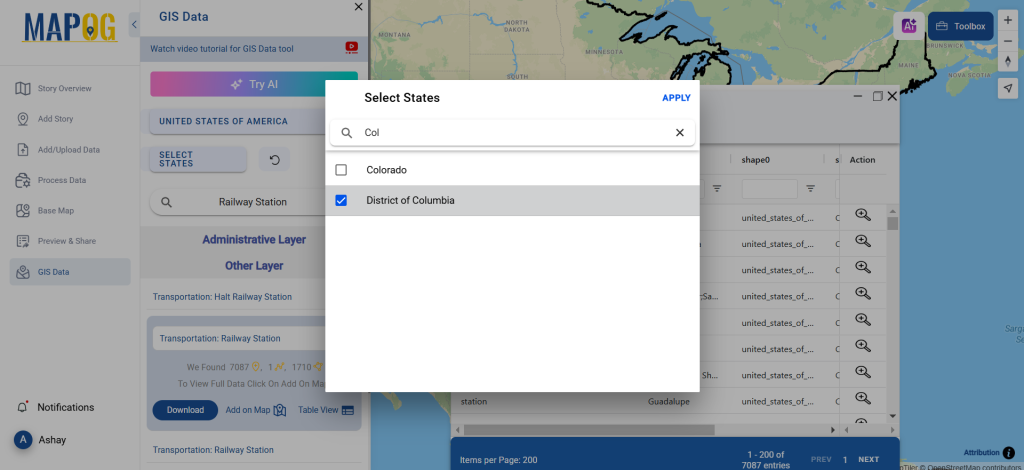
Step 3: Refine Data with Filters
Use the filter option to refine railway station data based on state, district, or specific geographic regions. This ensures precision in data selection, allowing users to focus on specific areas for urban planning or transportation research.
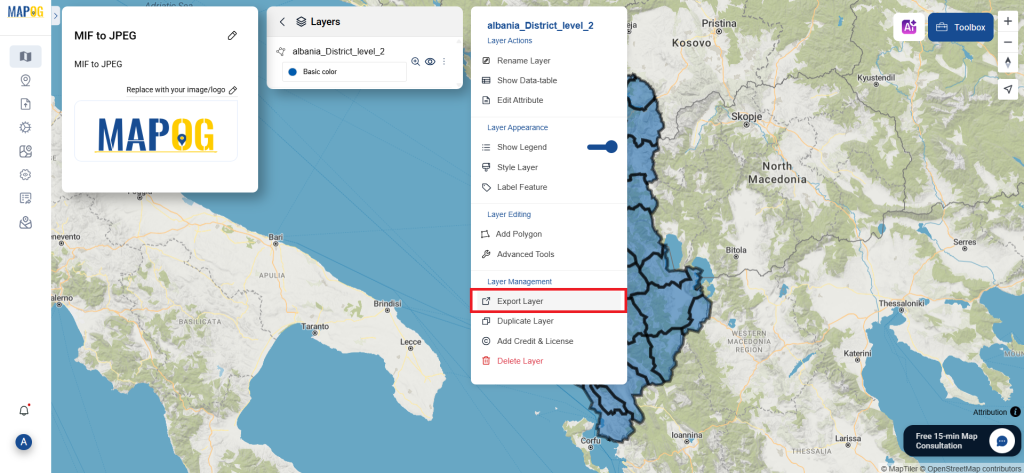
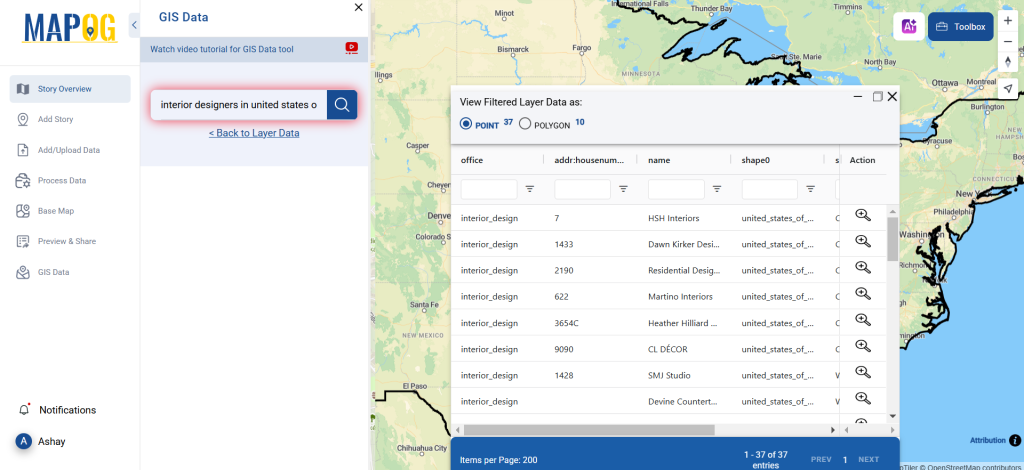
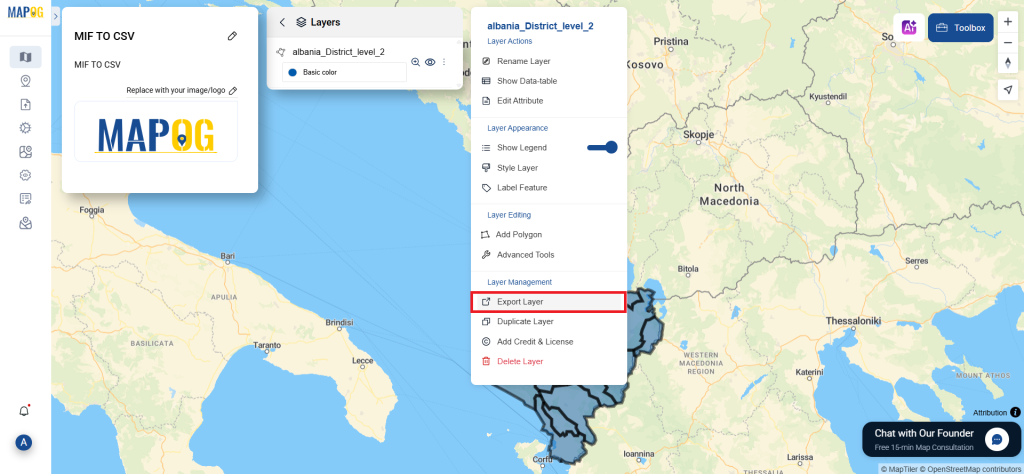
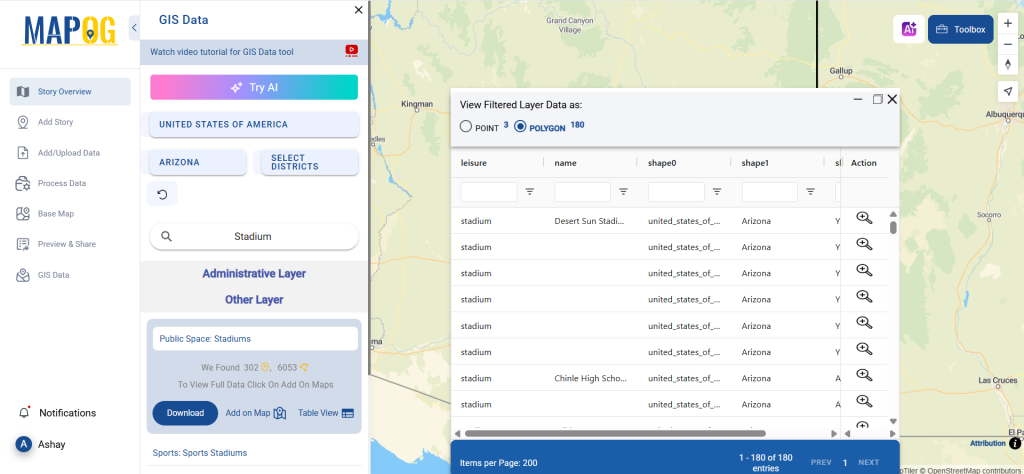
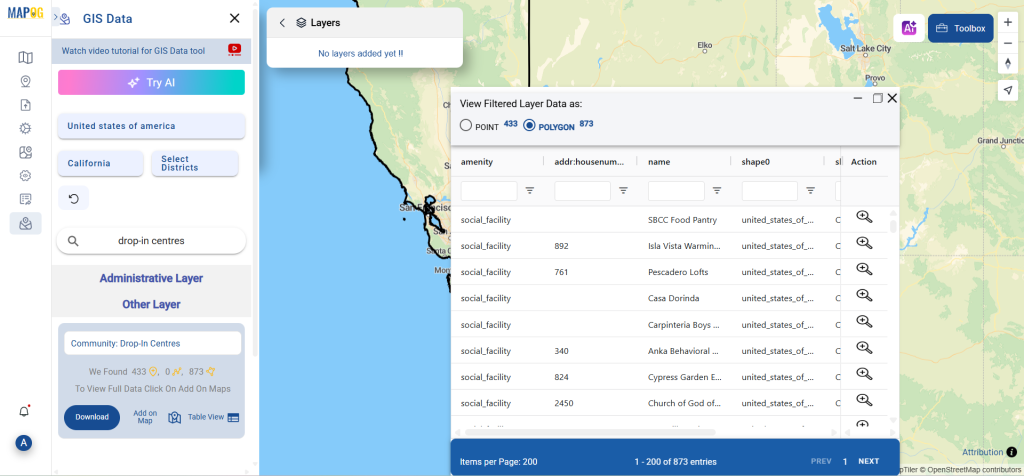
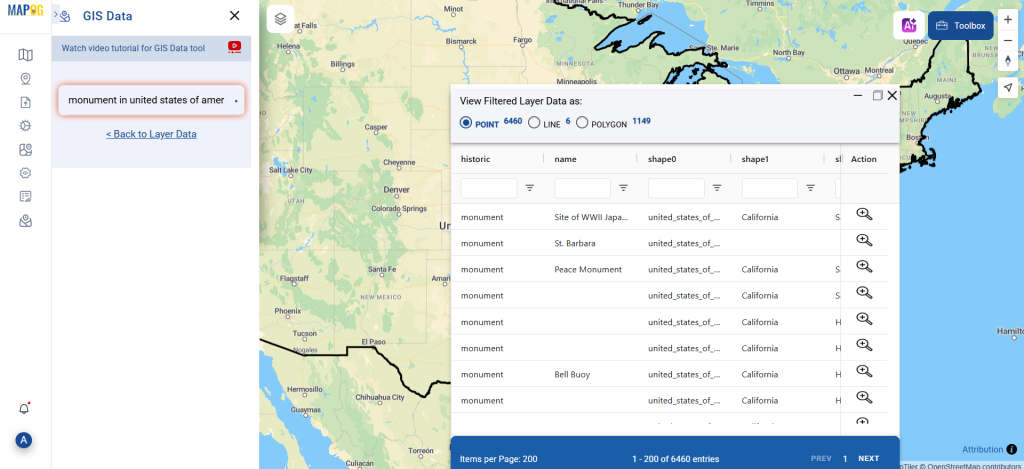
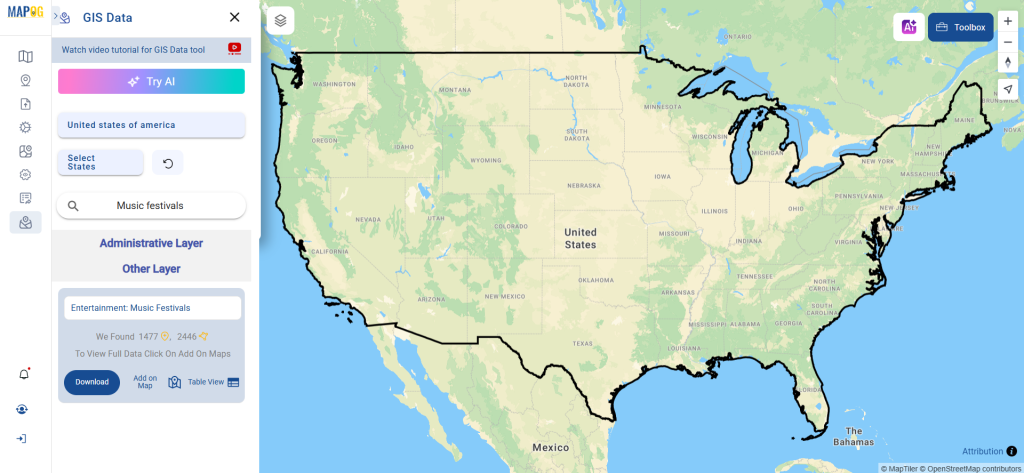
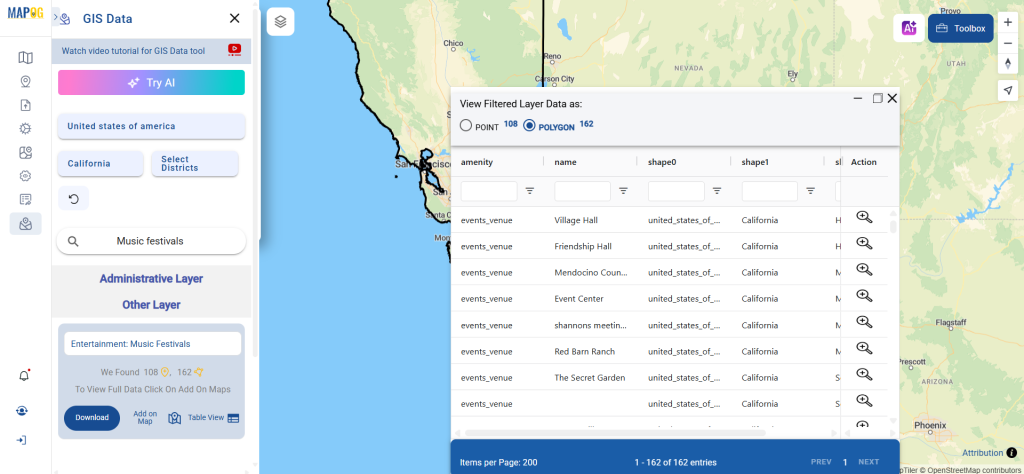
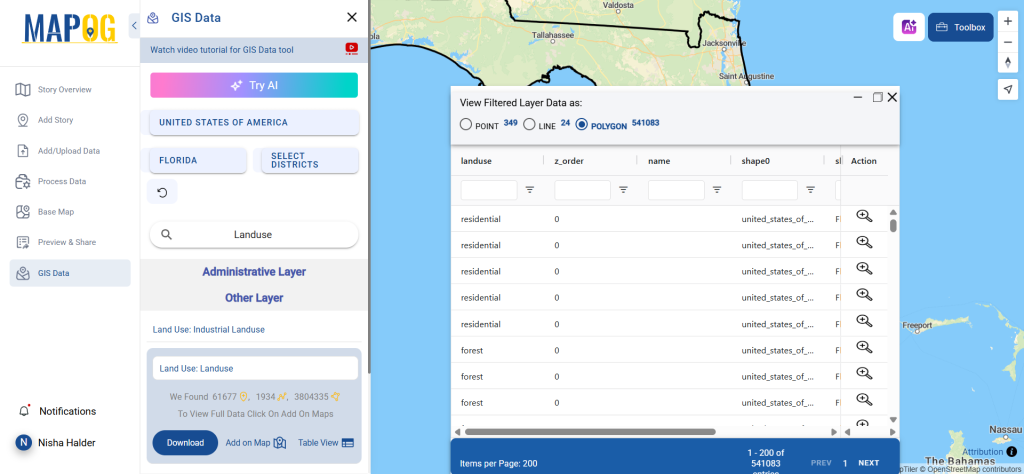
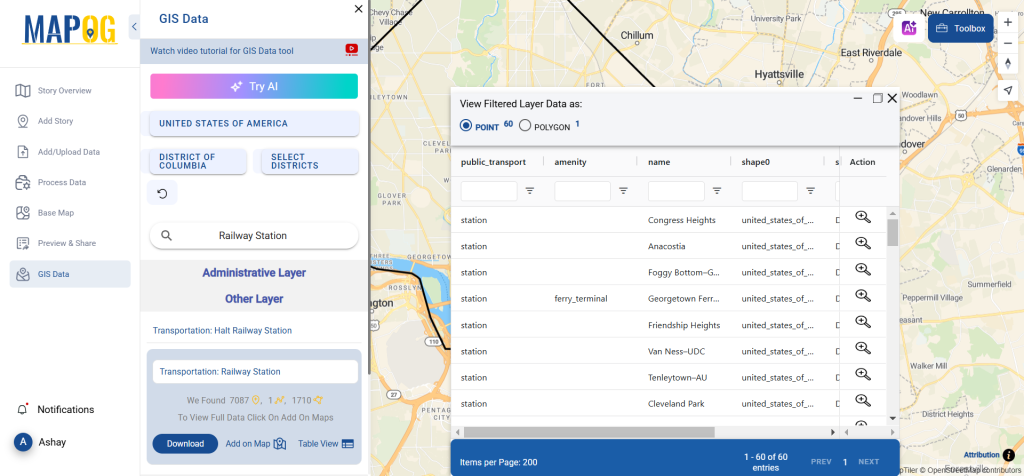
Step 4: Add Data to the Map
With the “Add on Map” feature, users can overlay railway station data on an interactive map. This visualization helps in analyzing station density, accessibility, and spatial distribution, supporting in-depth GIS-based decision-making.
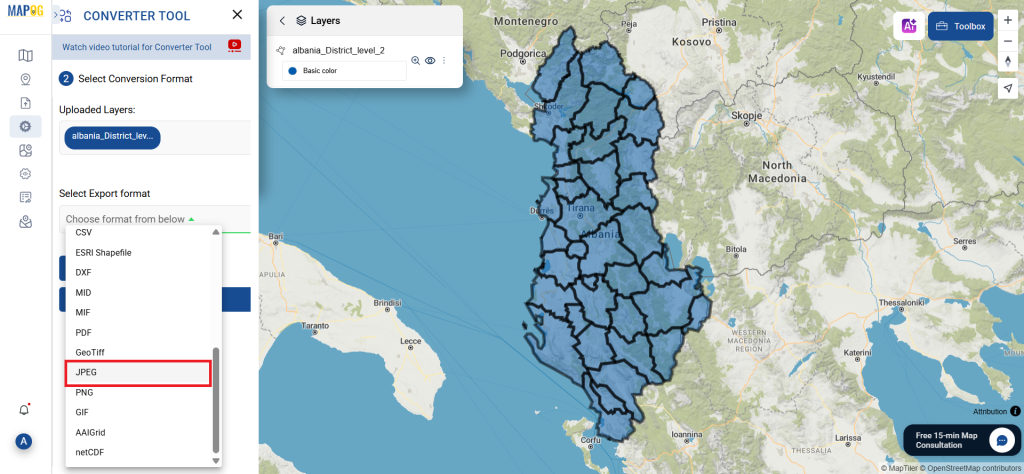
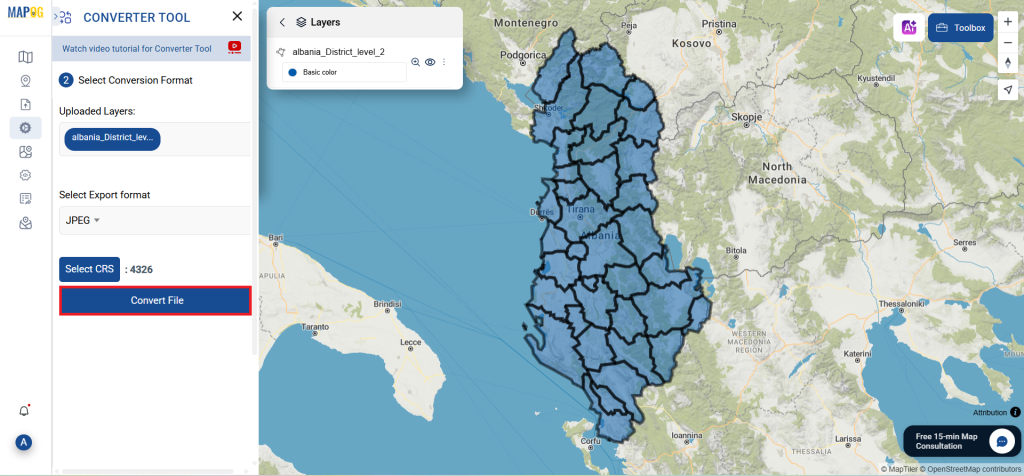
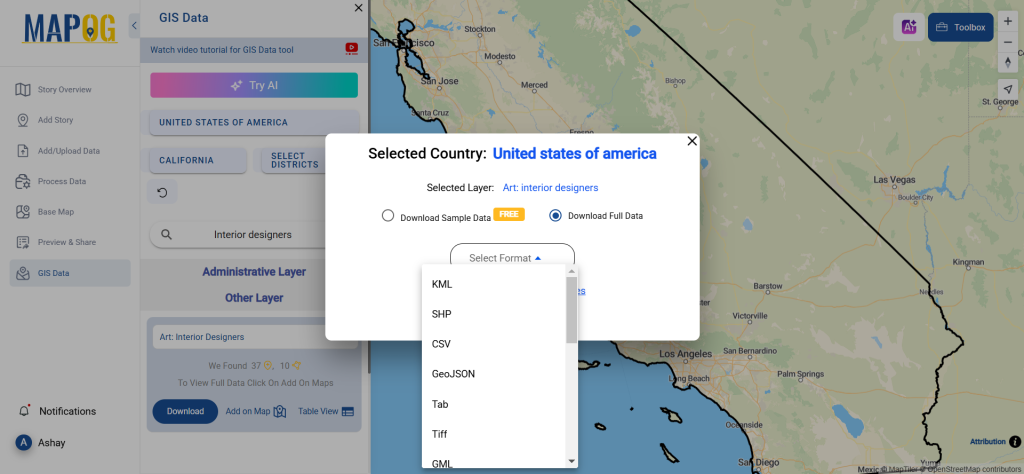
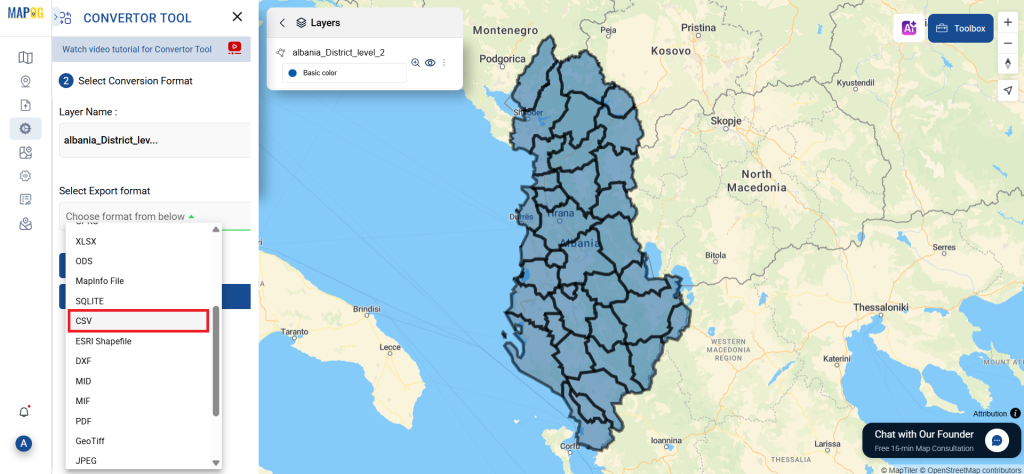
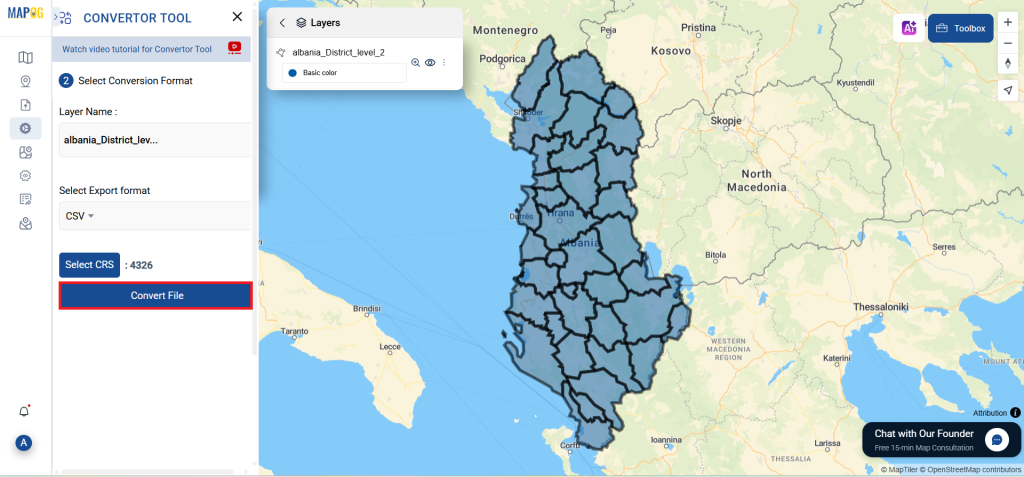
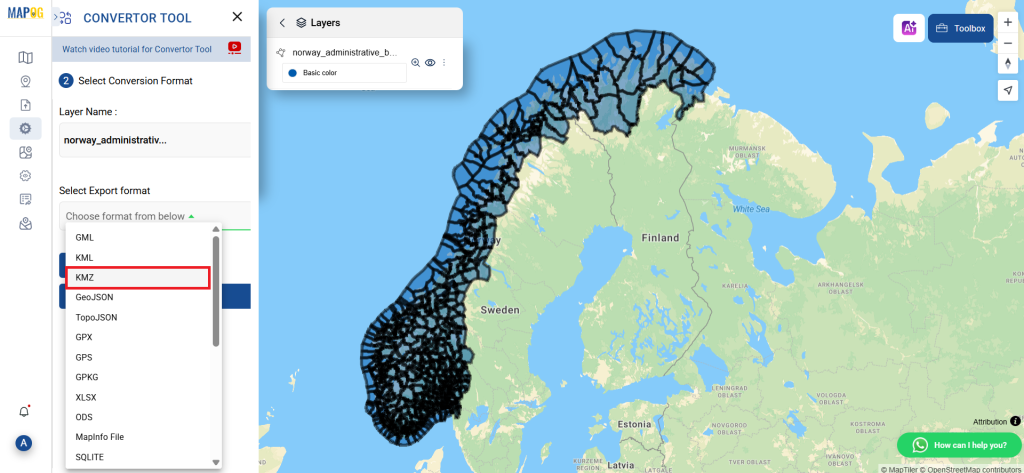
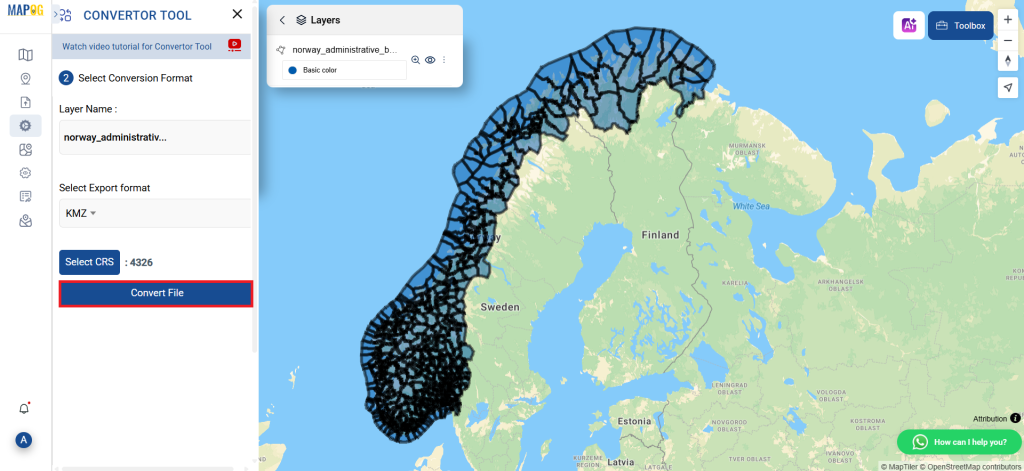
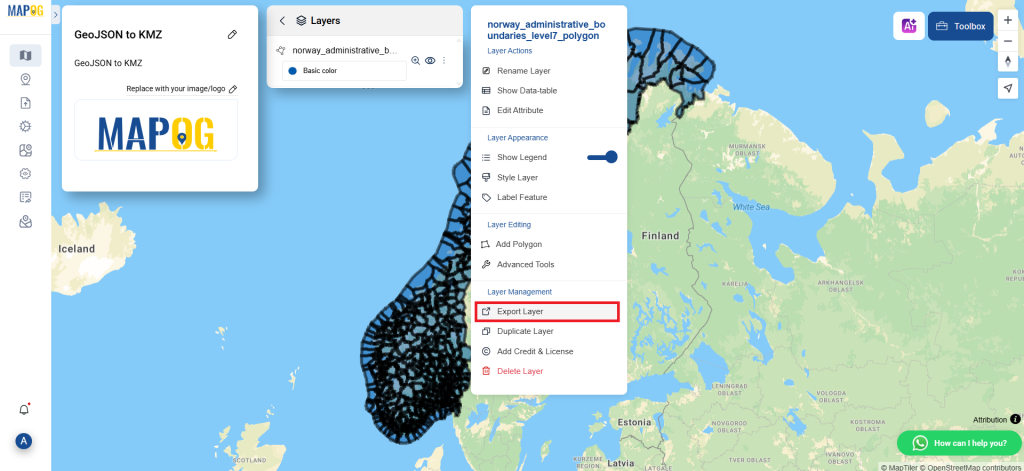
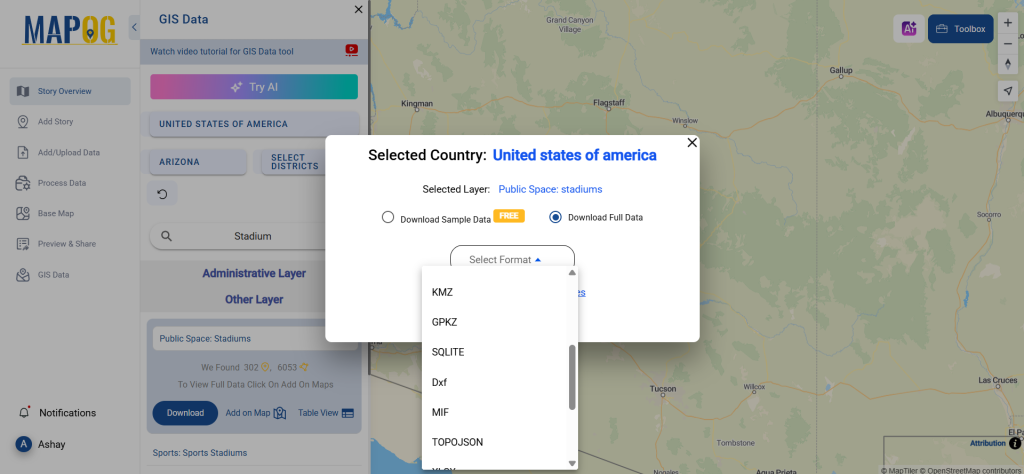
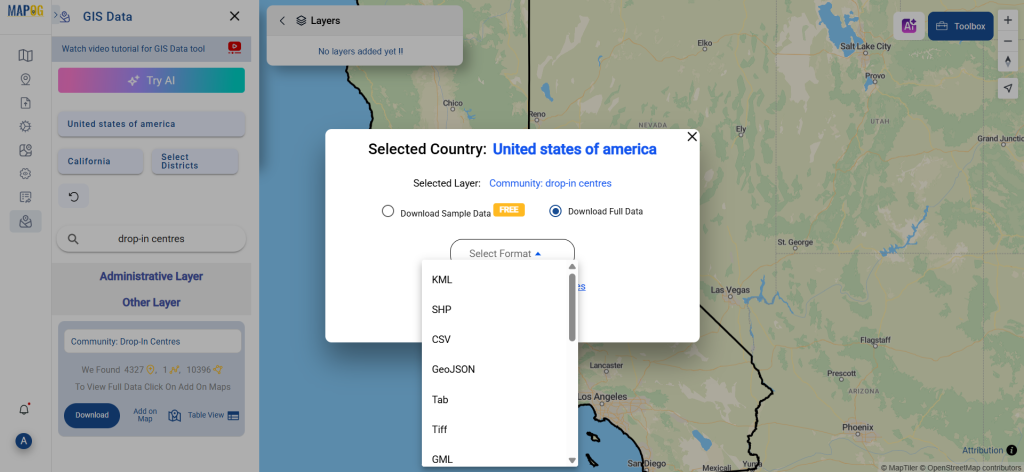
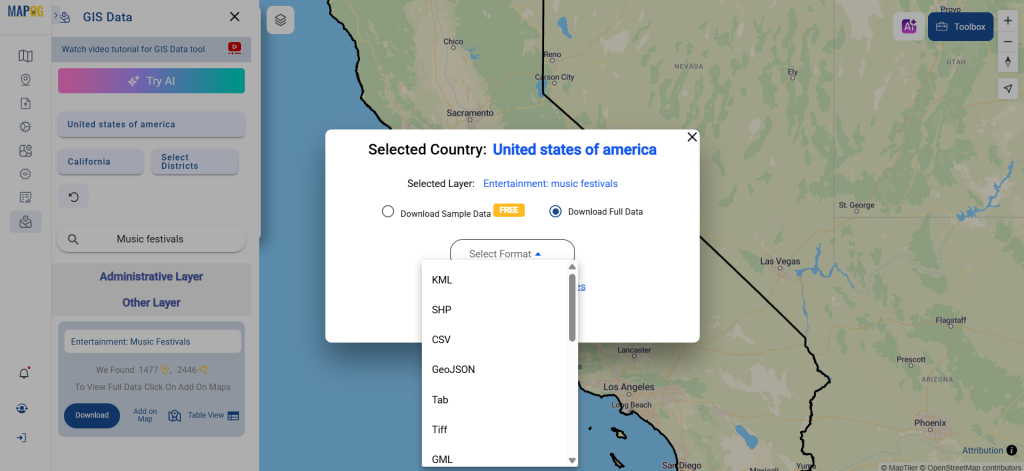
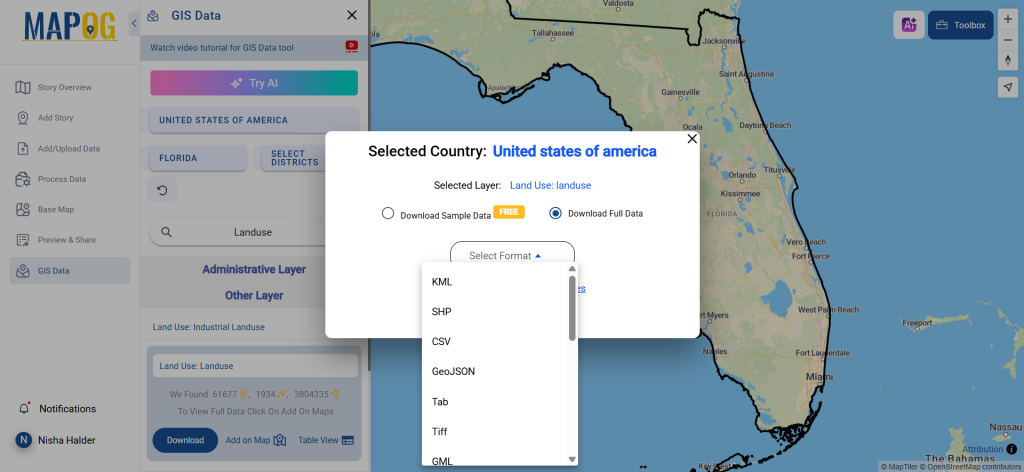
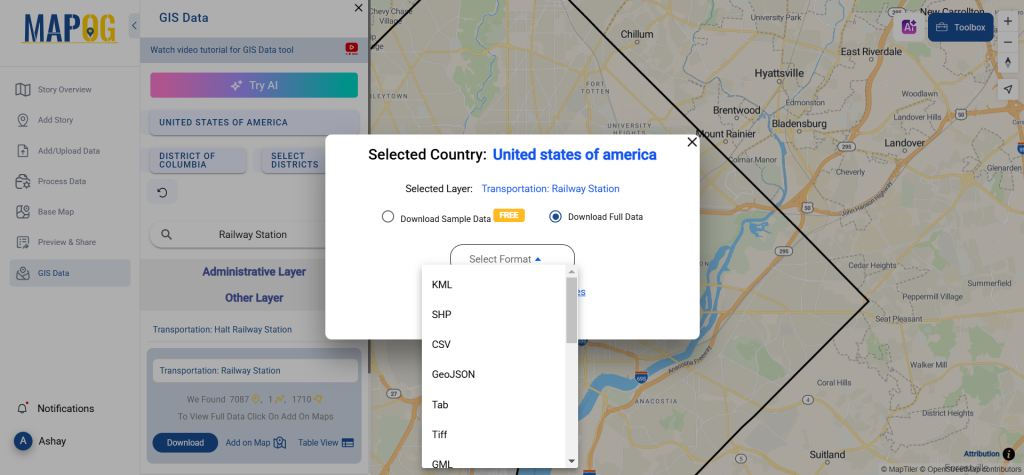
Step 5: Download Railway Station Data in Multiple Formats
Click the “Download Data” button. Users can choose between sample data or the full dataset. Select the preferred format—Shapefile, KML, GeoJSON, MID, or any of the 15+ supported formats. Agree to the terms and conditions, then initiate the download.
Conclusion
GIS Data by MAPOG makes it effortless to download railway station data in multiple formats, enabling professionals, researchers, and developers to access precise geospatial information. Whether for transportation planning, infrastructure development, or location-based analytics, MAPOG provides reliable and up-to-date railway station data for diverse GIS applications.
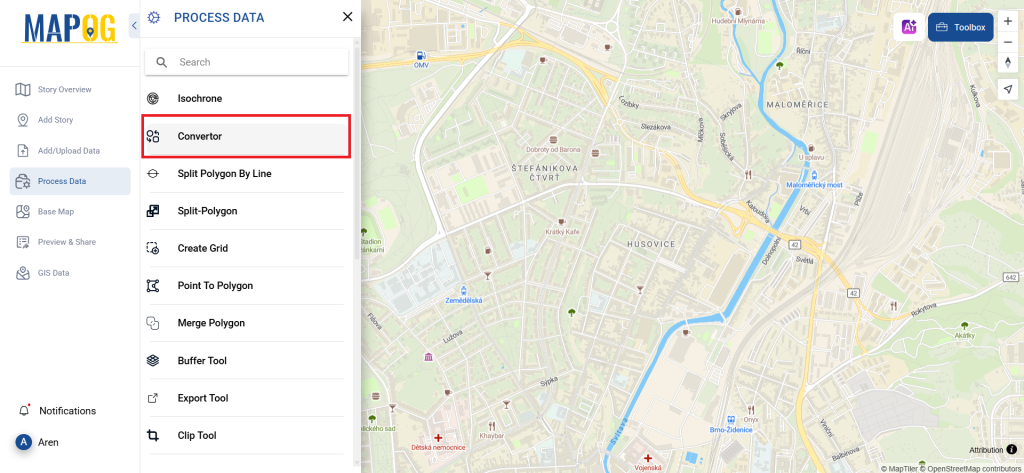
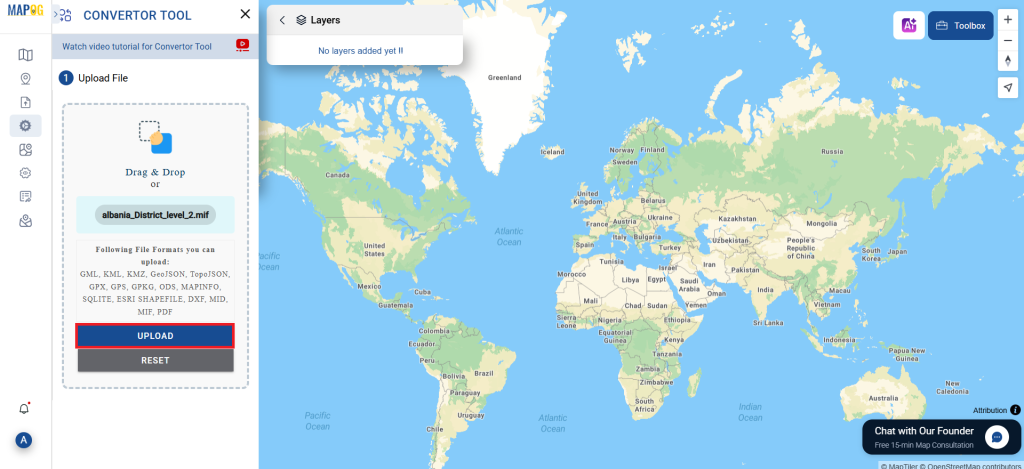
With MAPOG’s versatile toolkit, you can effortlessly upload vector and upload Excel or CSV data, incorporate existing layers, perform polyline splitting, use the converter for various formats, calculate isochrones, and utilize the Export Tool.
For any questions or further assistance, feel free to reach out to us at support@mapog.com. We’re here to help you make the most of your GIS data.
Download Shapefile for the following:
- World Countries Shapefile
- Australia
- Argentina
- Austria
- Belgium
- Brazil
- Canada
- Denmark
- Fiji
- Finland
- Germany
- Greece
- India
- Indonesia
- Ireland
- Italy
- Japan
- Kenya
- Lebanon
- Madagascar
- Malaysia
- Mexico
- Mongolia
- Netherlands
- New Zealand
- Nigeria
- Papua New Guinea
- Philippines
- Poland
- Russia
- Singapore
- South Africa
- South Korea
- Spain
- Switzerland
- Tunisia
- United Kingdom Shapefile
- United States of America
- Vietnam
- Croatia
- Chile
- Norway
- Maldives
- Bhutan
- Colombia
- Libya
- Comoros
- Hungary
- Laos
- Estonia
- Iraq
- Portugal
- Azerbaijan
- Macedonia
- Romania
- Peru
- Marshall Islands
- Slovenia
- Nauru
- Guatemala
- El Salvador
- Afghanistan
- Cyprus
- Syria
- Slovakia
- Luxembourg
- Jordan
- Armenia
- Haiti And Dominican Republic
- Malta
- Djibouti
- East Timor
- Micronesia
- Morocco
- Liberia
- Kosovo
- Isle Of Man
- Paraguay
- Tokelau
- Palau
- Ile De Clipperton
- Mauritius
- Equatorial Guinea
- Tonga
- Myanmar
- Thailand
- New Caledonia
- Niger
- Nicaragua
- Pakistan
- Nepal
- Seychelles
- Democratic Republic of the Congo
- China
- Kenya
- Kyrgyzstan
- Bosnia Herzegovina
- Burkina Faso
- Canary Island
- Togo
- Israel And Palestine
- Algeria
- Suriname
- Angola
- Cape Verde
- Liechtenstein
- Taiwan
- Turkmenistan
- Tuvalu
- Ivory Coast
- Moldova
- Somalia
- Belize
- Swaziland
- Solomon Islands
- North Korea
- Sao Tome And Principe
- Guyana
- Serbia
- Senegal And Gambia
- Faroe Islands
- Guernsey Jersey
- Monaco
- Tajikistan
- Pitcairn
Disclaimer : The GIS data provided for download in this article was initially sourced from OpenStreetMap (OSM) and further modified to enhance its usability. Please note that the original data is licensed under the Open Database License (ODbL) by the OpenStreetMap contributors. While modifications have been made to improve the data, any use, redistribution, or modification of this data must comply with the ODbL license terms. For more information on the ODbL, please visit OpenStreetMap’s License Page.
Here are some blogs you might be interested in:
- Download Airport data in Shapefile, KML , MIf +15 GIS format – Filter and download
- Download Bank Data in Shapefile, KML, GeoJSON, and More – Filter and Download
- Download Railway data in Shapefile, KML, GeojSON +15 GIS format
- Download Farmland Data in Shapefile, KML, GeoJSON, and More – Filter and Download
- Download Pharmacy Data in Shapefile, KML, GeoJSON, and More – Filter and Download
- Download ATM Data in Shapefile, KML, MID +15 GIS Formats Using GIS Data by MAPOG
- Download Road Data in Shapefile, KML, GeoJSON, and 15+ GIS Form