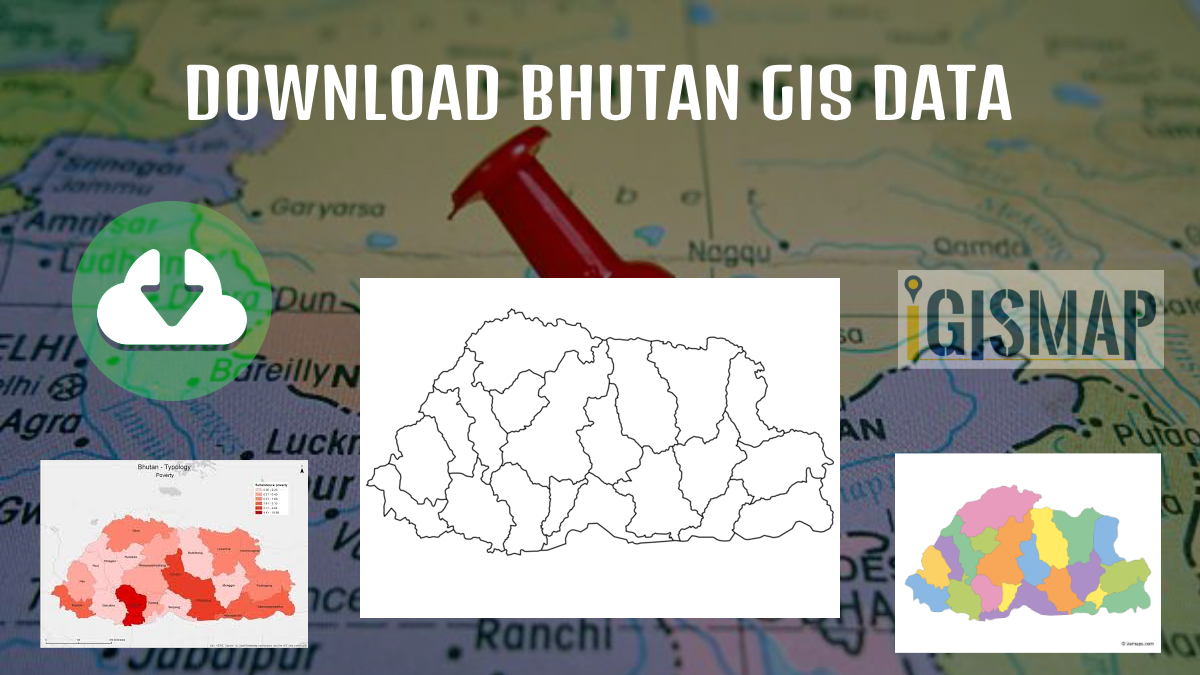
Download Bhutan Map Shapefile GIS Data, Bhutan Districts , Bhutan Villages Shapefile data. Available in Shapefile, KML, GeoJSON, CSV
Have you been hunting GIS data too long and couldn’t find the right data or a proper data collection hub for fulfilling your requirements? Worry no more, IGISMAP GIS solutions offer a comprehensive collection of GIS data for over 150 countries, providing access to more than 150 datasets per country. Each dataset is carefully curated and accurately represents the administrative divisions of the respective countries. IGISMAP provides two essential tools for accessing this data: the Download GIS Data and Add GIS Data functionalities. Users can download the data in multiple formats, including ESRI Shapefile, KML, GeoJSON, or CSV, depending on their preferences and requirements. The platform ensures that users have a seamless experience in accessing valuable GIS data for their projects. Check the article – Add GIS data from IGISMap GIS data collection to understand more about Add GIS Data.
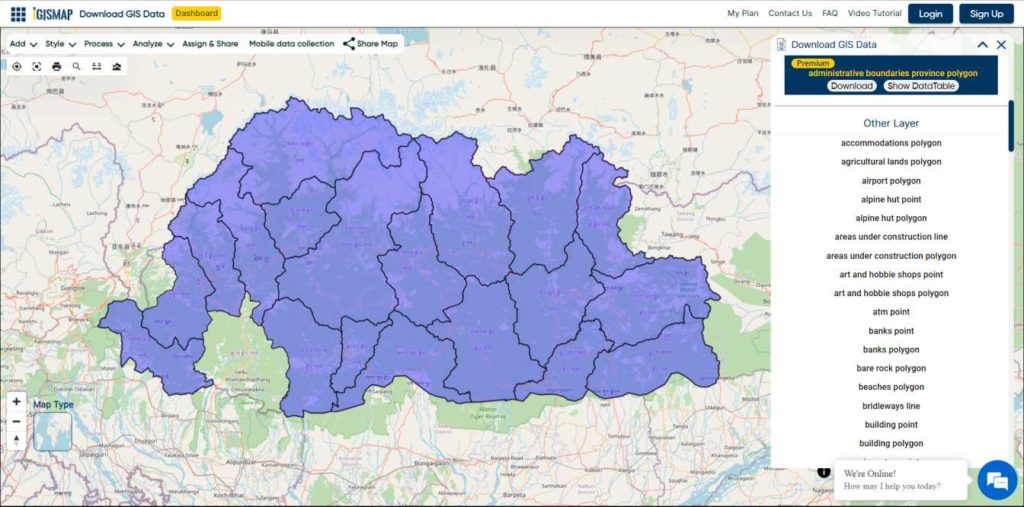
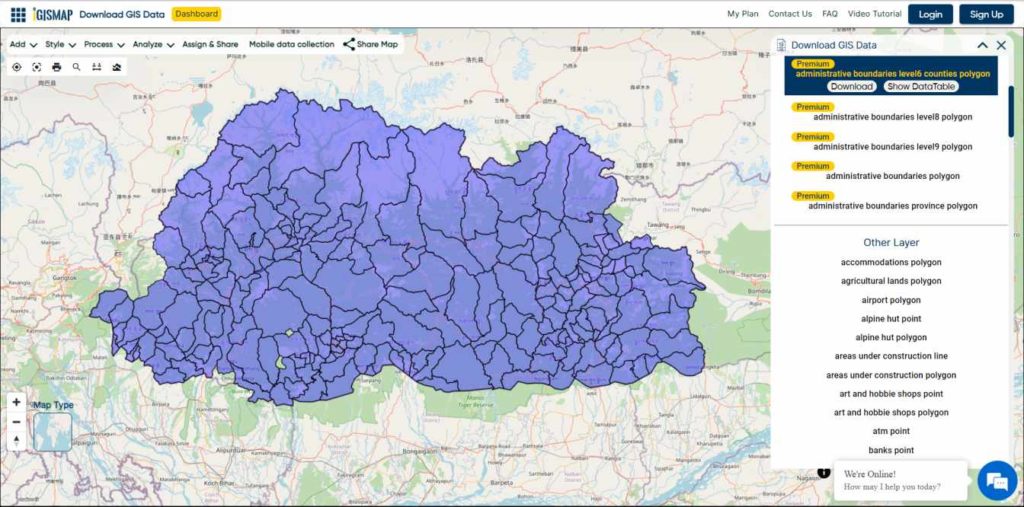
In this article, we will talk about IGISMAP GIS data of Bhutan and how it can be accessed from Download GIS Data tool. GIS data of almost all natural and man made geographic features are available for Bhutan. This article will give you an overview of all the administrative divisions GIS data available for Bhutan.
Note:
All data available are in GCS datum EPSG:4326 WGS84 CRS (Coordinate Reference System).
In Bangladesh, a village is the smallest territorial and social unit for administrative and representative purposes. It is an elective unit of a Union Council from which a single council member is elected. Usually one village is designated as a ward and each union is made up of nine villages.
Disclaimer : If you find any shapefile data of country provided is incorrect do contact us or comment below, so that we will correct the same in our system as well we will try to correct the same in OpenStreetMap.
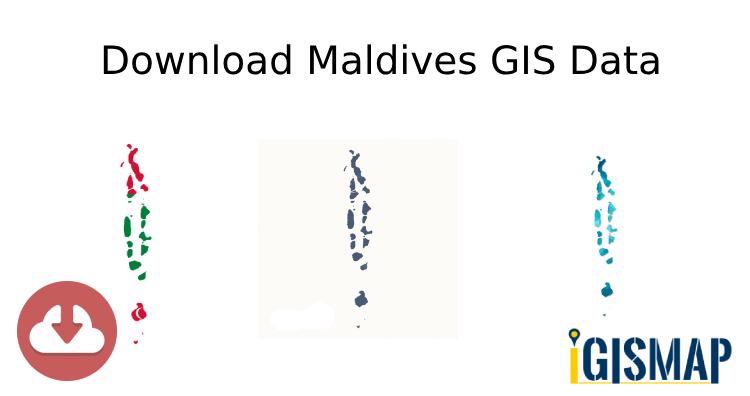
IGISMAP introduces the Maldives’ GIS data collection, encompassing administrative boundaries such as national boundaries and atolls, available for download in various formats including ESRI Shapefile, KML, GeoJSON, and CSV, providing GIS enthusiasts with the opportunity to explore and analyze geographic and administrative features for mapping projects.
Exciting news for GIS enthusiasts! IGISMAP has just released GIS data collections for over 100 new countries. You can now access the shapefiles of all essential administrative and other geographical features. The provided links allow you to download the Maldives Administrative Boundary GIS Data in ESRI Shapefile, KML, GeoJSON, and CSV formats.
Note:
All data available are in GCS datum EPSG:4326 WGS84 CRS (Coordinate Reference System).
You need to login for downloading the shapefile.
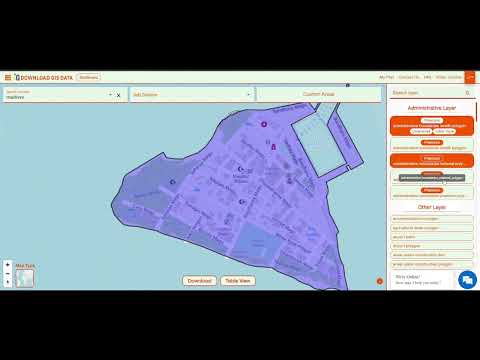
Here is the video tutorial to download data:
Download Shapefile Data of Maldives
Maldives, officially known as the Republic of Maldives, is a picturesque island nation situated in the Indian Ocean. Comprising a total of 26 atolls, which are formed by more than 1,000 coral islands, Maldives is renowned for its breathtaking beauty, pristine beaches, and crystal-clear turquoise waters.
Geographically, Maldives is located southwest of Sri Lanka and India, spanning an area of approximately 298 square kilometers (115 square miles). The country stretches over 820 kilometers (510 miles) from north to south and 120 kilometers (75 miles) from east to west. The nearest landmass is the Indian Lakshadweep Islands.
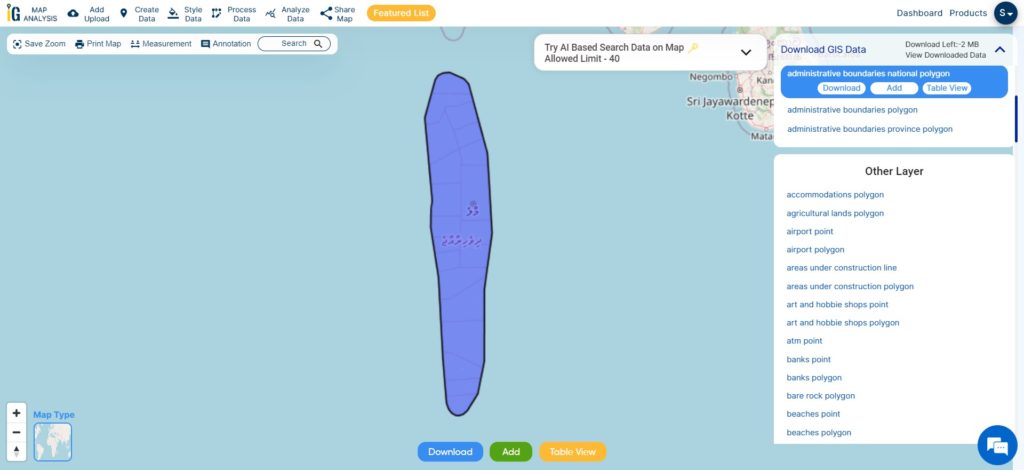
Maldives National Boundary
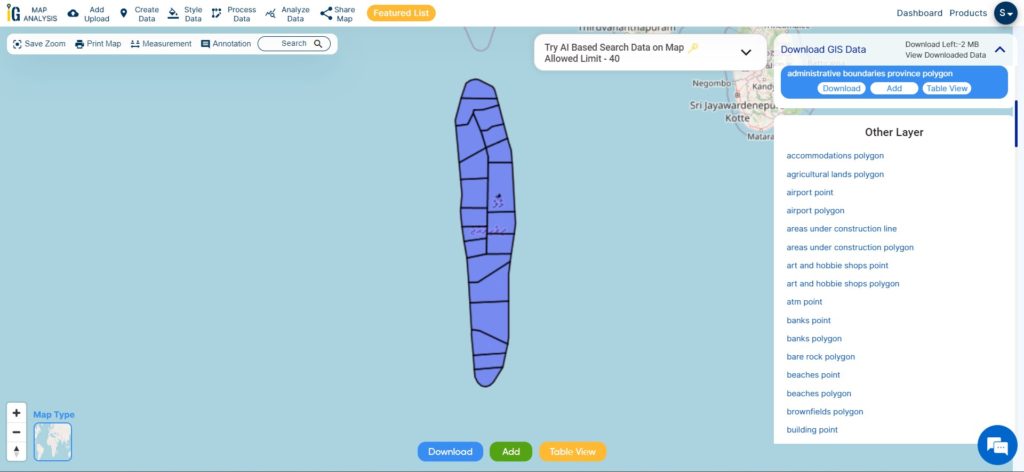
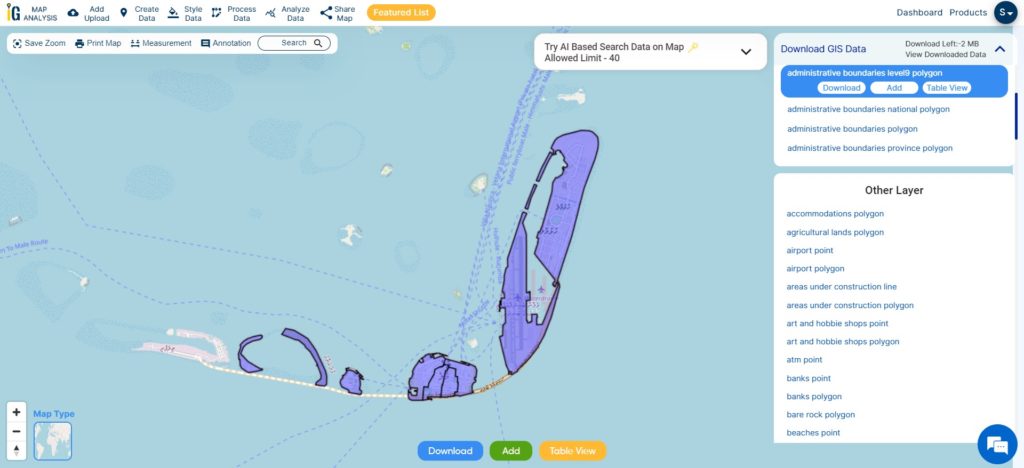
After logging in with a verified email ID, select the desired country. Next, choose the specific layer and format for the GIS data. Before downloading the Maldives GIS data, you have the option to check the data table for further details. Finally, click on the download button to initiate the download.
The Maldives, a tropical paradise in the Indian Ocean, is an archipelago consisting of 26 atolls, which are further divided into 20 administrative atolls. These atolls serve as the country’s primary administrative divisions. Each atoll comprises numerous coral islands, with some atolls boasting more than 200 individual islets. The capital city, Malé, located in the Kaafu Atoll, is not only the political and economic hub of the Maldives but also one of the most densely populated cities in the world. Despite facing challenges from climate change and rising sea levels, the Maldives’ administrative atolls remain a symbol of natural beauty and cultural richness, attracting tourists from around the globe.
This shapefile covers following administrative atolls of maldives listed below:
Alifu Alifu Atoll (North Ari Atoll)
Alifu Dhaalu Atoll (South Ari Atoll)
Baa Atoll
Dhaalu Atoll
Faafu Atoll
Gaafu Alifu Atoll (North Huvadhoo Atoll)
Gaafu Dhaalu Atoll (South Huvadhoo Atoll)
Gnaviyani Atoll (Fuvahmulah)
Haa Alifu Atoll (Thiladhunmathi Uthuruburi)
Haa Dhaalu Atoll (Thiladhunmathi Dhekunuburi)
Kaafu Atoll (Male Atoll)
Laamu Atoll
Lhaviyani Atoll
Meemu Atoll
Noonu Atoll
Raa Atoll
Seenu Atoll (Addu Atoll)
Shaviyani Atoll
Thaa Atoll
Vaavu Atoll
Download Maldives North Male Atoll Shapefile Data
North Malé Atoll is one of the most popular and frequently visited atolls in the Maldives. Located in the northern part of the archipelago, it is situated close to the capital city of Malé, making it easily accessible for tourists.
The capital city of the Maldives is Malé, and it is not specifically located within the North Malé Atoll. However, Malé is situated in close proximity to the atoll and serves as the central hub for transportation, administration, and commerce in the country. It is located on the southern edge of the North Malé Atoll, which makes it easily accessible from the various resorts and islands within the atoll.
Hulhumalé is a reclaimed island located in the Maldives, situated in the southern part of the North Malé Atoll. It is an artificial island developed as a response to the growing population and urbanization pressures faced by the capital city of Malé. Hulhumalé serves as an extension of the greater Malé area and has become a key residential, commercial, and recreational hub.
Disclaimer : If you find any shapefile data of country provided is incorrect do contact us or comment below, so that we will correct the same in our system as well we will try to correct the same in o
Data science and machine learning are the latest trend in education. This is due to the high demand for skilled labour in analytics and programming to extract information from raw data. In today’s world, almost all industries from social media to national security relies on data and information for decision making. Geoinformatics and location intelligence also plays an important role in research and business pointing out the relevance of geospatial data.
IGISMap(Now named as MAPOG) contains the collection of highly accurate GIS data representing several countries. This data collection contains administrative boundaries such as country, states, districts, roads, railway lines, and other geographical features such as roads, farmlands, waterbody, etc. These data are made available for 30+ countries, and 51 US states, available in point, line, and polygon shapes based on the spatial structure. These data are collected from official sources of the respective countries and other websites of trusted international organizations
There are two IGISMap tools (MAPOG Tools) to access these data – Add GIS Data and Download GIS Data tools. This article will demonstrate the usage of Add GIS Data tool by downloading polygon, polyline and point.
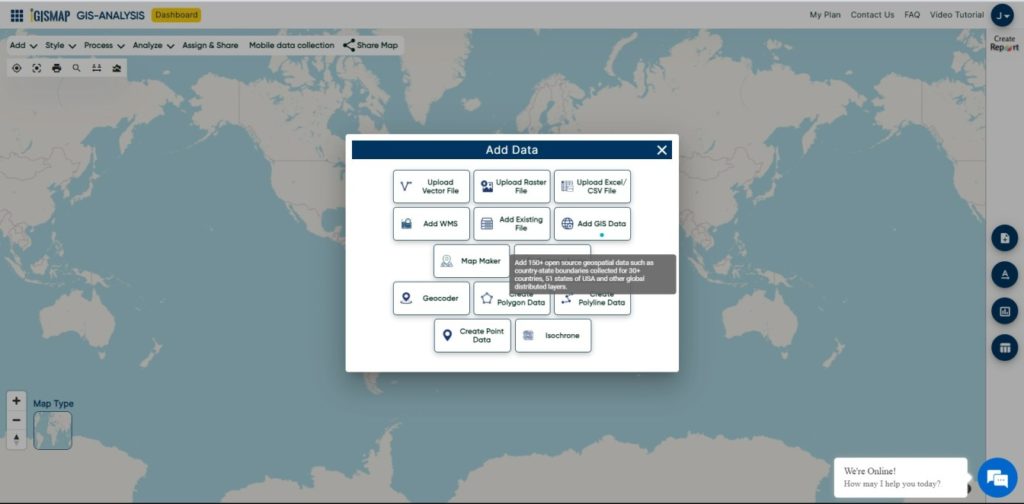
The Add GIS Data tool of IGISMap provides a list of GIS data for several countries and US states. Users of IGISMap can add these data in maps and perform GIS operations for free after selecting the preferred country.
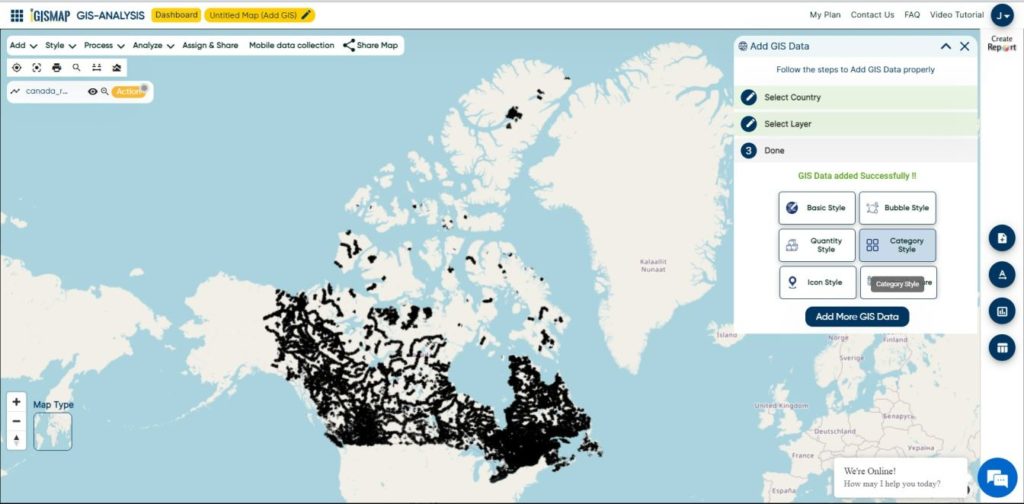
First lets try to add a polygon GIS data from IGISMap using Add GIS Data tool.
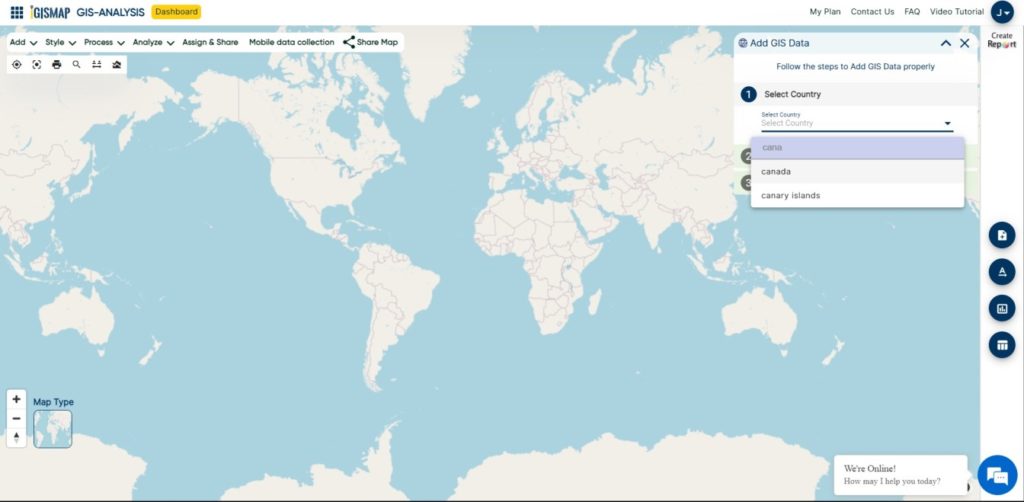
Select Country
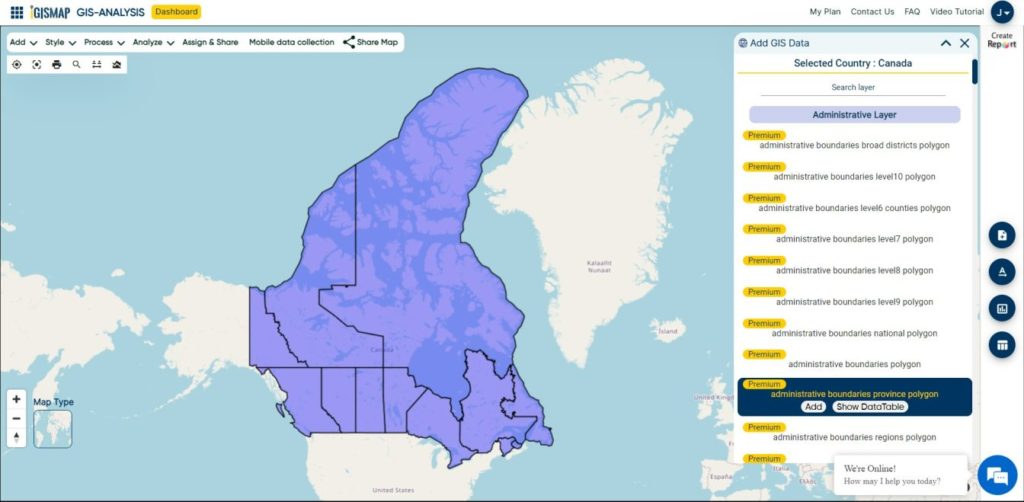
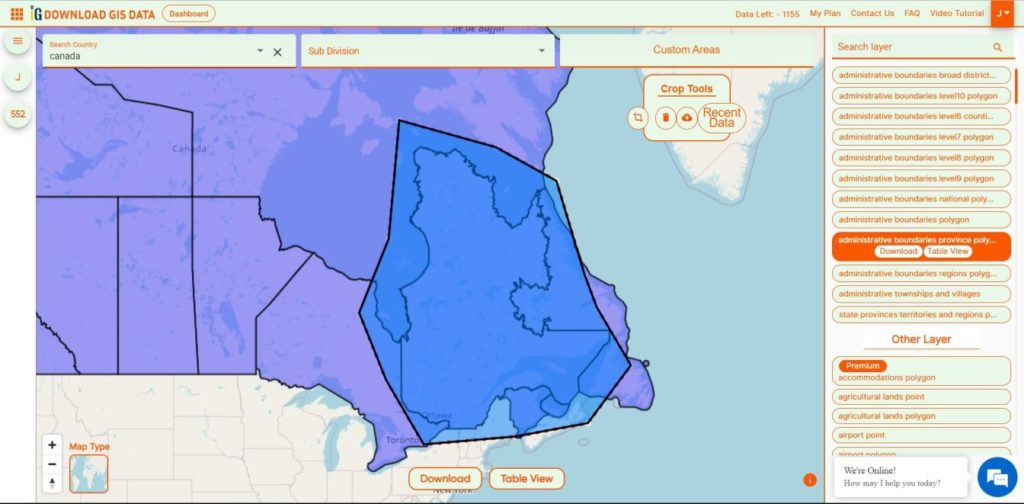
Select Country is the first step in Add GIS Data tool. In the Select Country step, countries are listed. You can also search with the name of the data and filter the list. Here let us select Canada, which will then open step 2 for selecting the layer.
Select Layer
Step 2 is Select Layer that will open the list of GIS data available for the country you selected. You can also use Seach Layer bar to filter the list. Here we will select the Province boundaries of Canada. This data is available in the list as administrative province boundaries full extend. Select the required data to simply preview it on the map. Toggle to Datatable to view the attribute fields and values of each feature of the data.
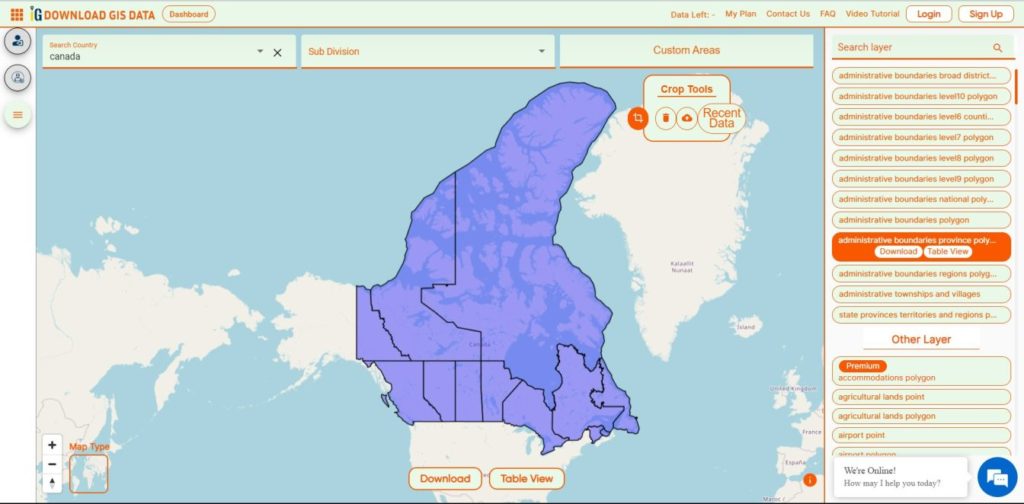
Crop Layer and Add GIS Data
Crop Layer
In Add GIS Data step, you can crop the data if necessary. Just Click on Option Custom Areas, Crop Layer. and Click to start the drawing required features to select for adding.
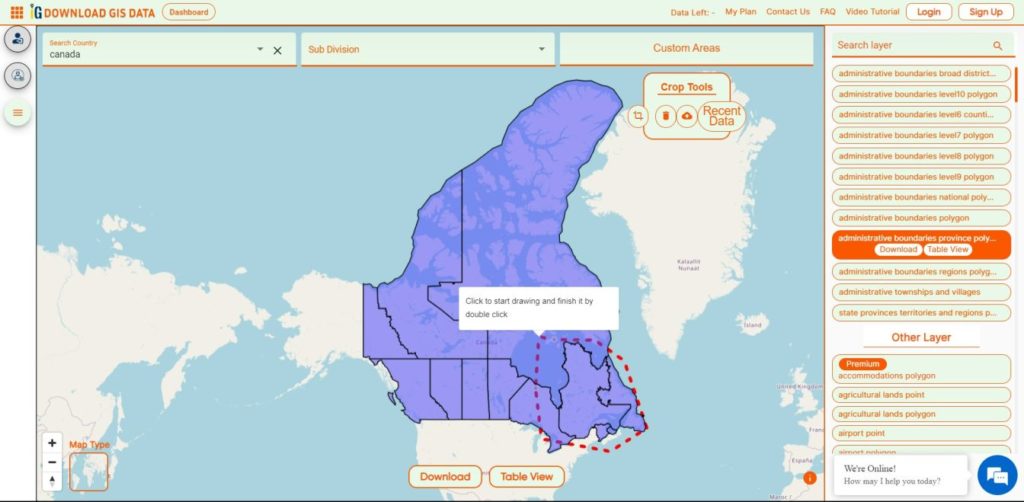
Crop Layer Manually
The Crop Layer option will allow you to draw a polygon on the map, such that all the features that are completely within the polygon will be selected for adding in the map. After selecting the Crop Layer option, draw a polygon that covers the polygon features of your interest.
Crop Layer
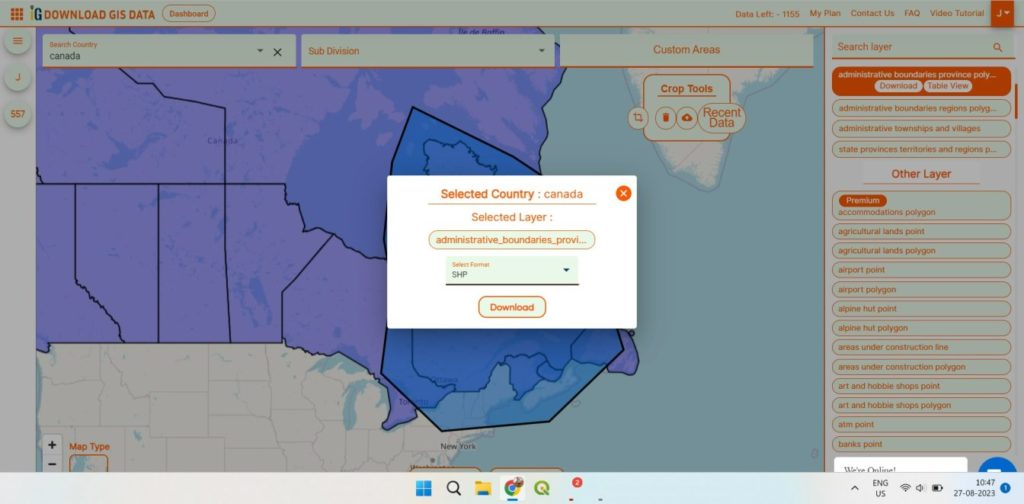
Now to add the data that you have selected or Crop. Click on Download button and select the Format in which you want data.
Download Crop Layer
To Add Downloaded Crop Data Go to to Add Vector File and Drag the data which you have downloaded.
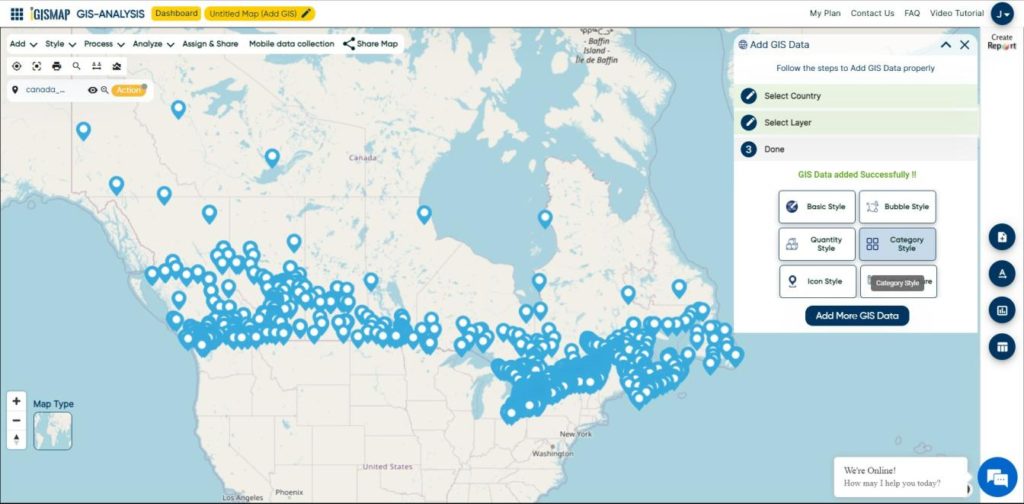
Add Polyline Data
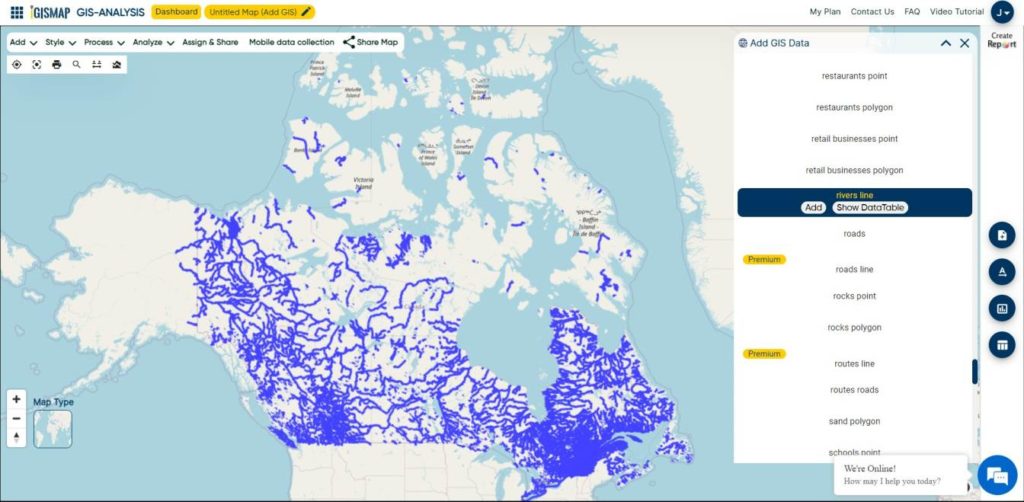
Now let’s try to add a polyline GIS data from Add GIS Data tool
Select Country
Click on Select country, and then select the country of your choice, which is Canada itself.
Select Layer
For demonstrating the adding of polyline GIS data, let’s work with rivers line polyline data of Canada. Search for river to filter the list and select river line data to preview. Then click Add Layer icon to start the process of downloading.
After previewing and confirming to download, click Add Layer icon button to open Add GIS Data step.
Now the data you have selected has added successfully in the map. You can use all IGISMap tools over the data for editing and analysis.
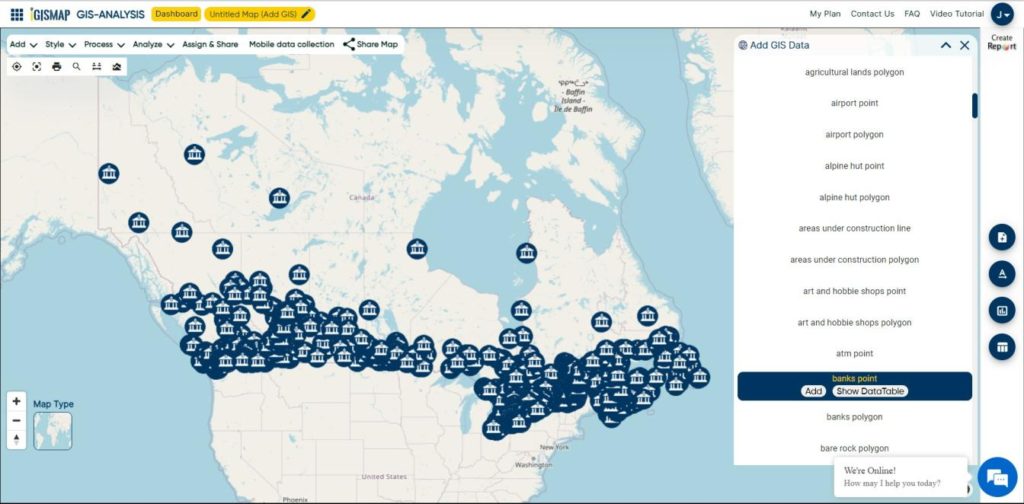
Add Point Data
For the last demonstration, we will add a point GIS data from MAPOG Add GIS Data tool.
Select Layer
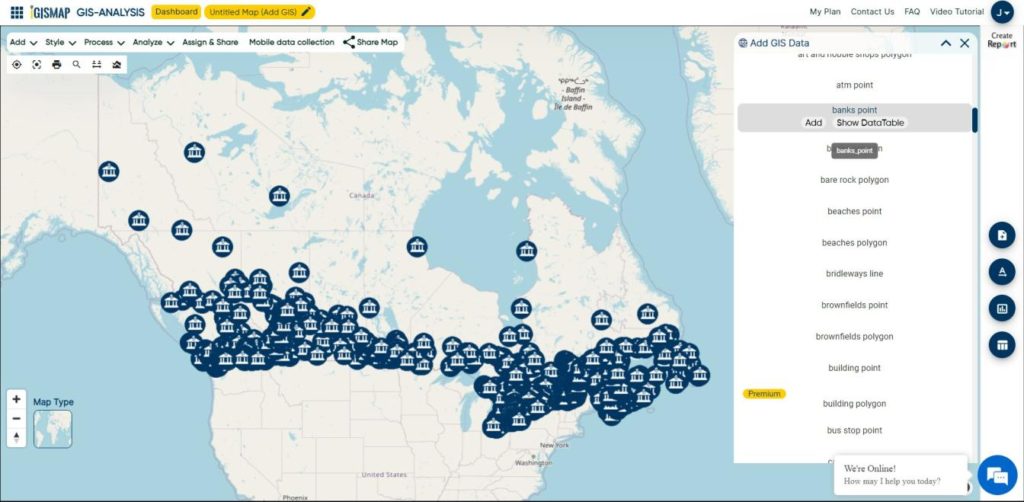
After selecting the country from Select Country, choose the required polyline GIS data. Here we are going to download Banks Point of Canada. Thus select Canada, then select banks point layer from Select Layer step.
After confirming the data by previewing the data on map and checking the data table, click Add Layer button to start the process of adding in the map.
Now the data you have selected has added successfully in the map. You can use all IGISMap tools over the data for editing and analysis.
You can share your map with others in public or private mode. Article Share your Map will help you understand more about Share Map feature of IGISMap.
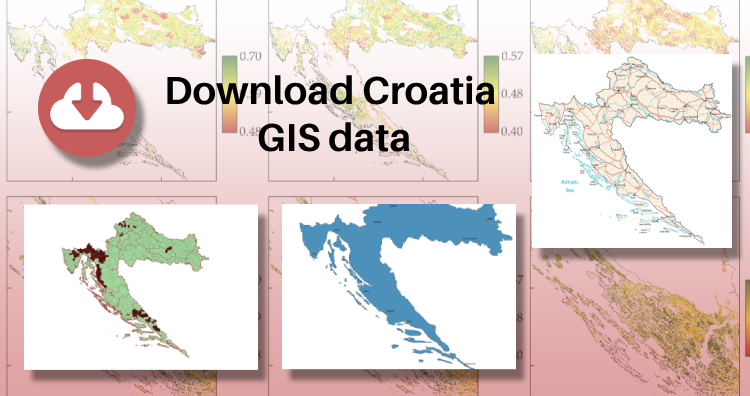
IGISMAP has unveiled Croatia’s GIS data collection, including shapefiles for essential administrative divisions such as counties and municipalities. Accessible in various formats like KML, GeoJSON, and CSV, this dataset empowers GIS enthusiasts to explore and analyze Croatia’s geographical information for mapping and analysis purposes.
Exciting news for GIS data users! IGISMAP has just released GIS data for over 100 new countries, including Croatia GIS data. You can now access shapefiles for essential administrative divisions of Croatia through the provided links. Additionally, data downloads are available in various formats, such as KML, GeoJSON, and CSV. Don’t miss this opportunity to explore and analyze the geographic information of Croatia in detail!
Note:
All data available are in GCS datum EPSG:4326 WGS84 CRS (Coordinate Reference System).
Situated at the crossroads of Central and Southeast Europe, the Republic of Croatia, also known as Republika Hrvatska, entices with its stunning landscapes and vibrant cultural heritage. The country shares borders with Slovenia, Hungary, Serbia, Bosnia and Herzegovina, and Montenegro, and boasts a maritime border with Italy. Croatia’s irresistible blend of natural beauty and historical allure makes it a highly sought-after destination for travelers.
At the core of Croatia lies its lively capital and largest city, Zagreb, forming a significant administrative hub along with twenty counties. This well-organized governance system ensures efficient management and representation at the regional level. Spanning 56,594 square kilometers (21,851 square miles), this enchanting nation is home to nearly 3.9 million people, creating a captivating and welcoming atmosphere for all who visit.
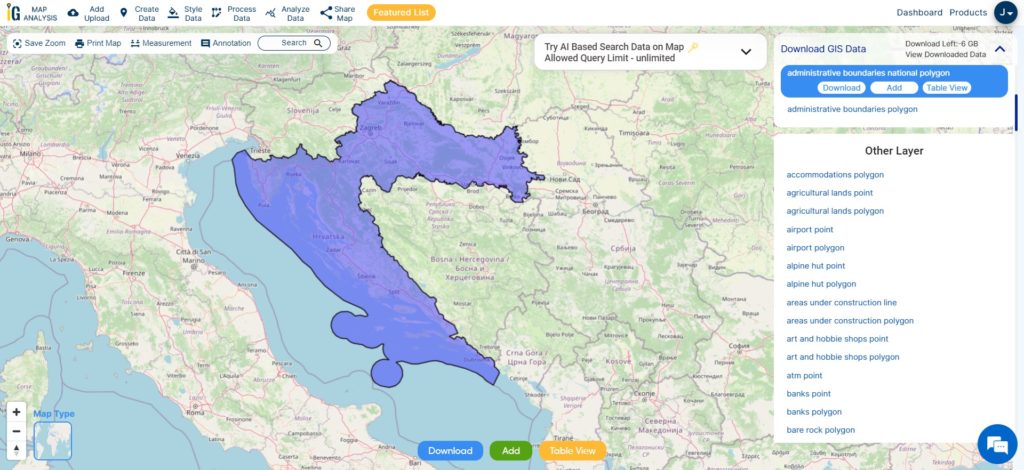
Croatia National Boundary
Once you logged in with a verified email id, select the country. Afterwards select the layer and format. Check data table before downloading Croatia Gis data. In the last click on download button. In addition to download you can crop the layer as per your requirement.
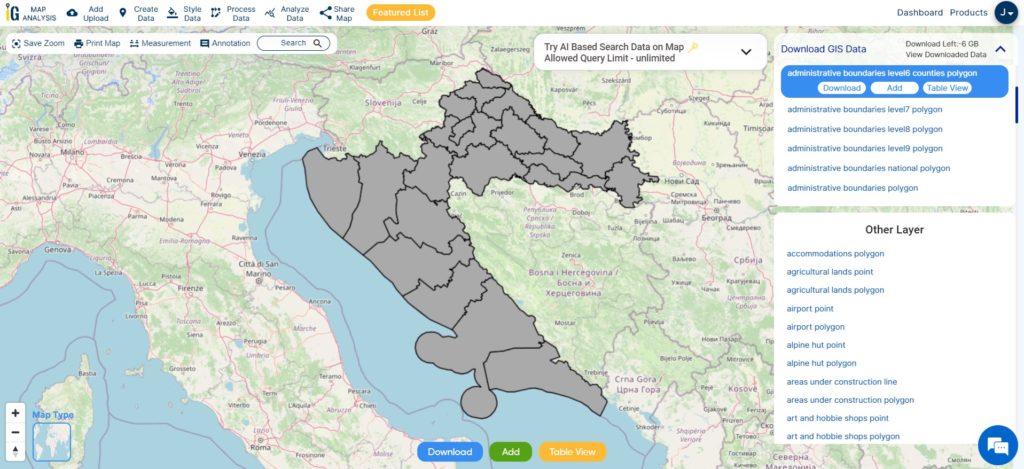
Croatia is divided into 21 counties, each contributing to efficient governance and regional development. The capital city of Zagreb holds special status as both a city and a separate administrative entity, adding to Croatia’s unique administrative structure.
This shapefile covers following counties of croatia listed below:
Bjelovar-Bilogora County
Brod-Posavina County
Dubrovnik-Neretva County
Istria County
Karlovac County
Koprivnica-Križevci County
Krapina-Zagorje County
Lika-Senj County
Međimurje County
Osijek-Baranja County
Požega-Slavonia County
Primorje-Gorski Kotar County
Šibenik-Knin County
Sisak-Moslavina County
Split-Dalmatia County
Varaždin County
Virovitica-Podravina County
Vukovar-Srijem County
Zadar County
Zagreb County
City of Zagreb (the capital)
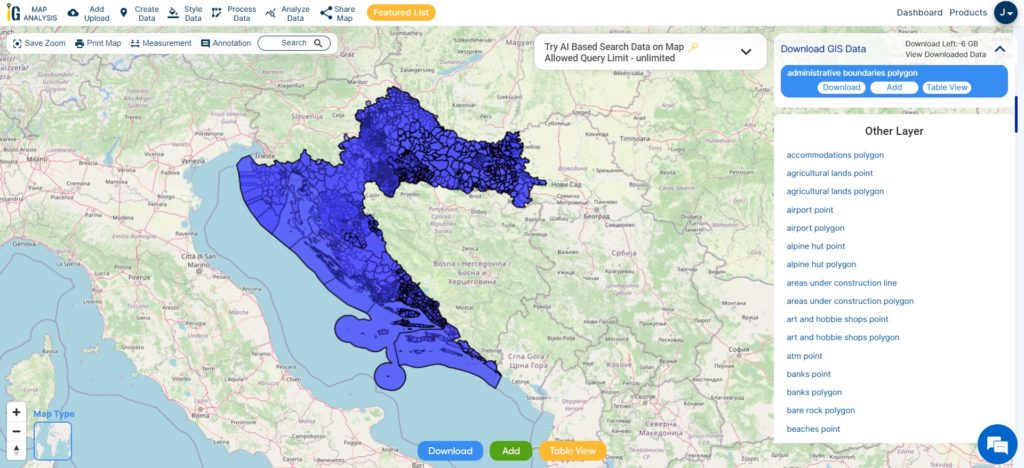
Download Croatia National, County and Municipalities Shapefile Data
Croatia is divided into 20 counties (županije), and its capital city, Zagreb, holds a special status as both a city and a separate administrative entity. Within each county, there are municipalities (općine) and cities (gradovi) that serve as the lowest level of administrative units. These municipalities and cities are responsible for providing essential public services and meeting the local needs and interests of their residents. This layer contain national boundary of Croatia, county and municipality shapefile gis data. Furthermore, you can download it any format i.e. csv, geojson, kml or many more.
Croatia National, County and Municipalities Boundary
Disclaimer : If you find any GIS data of country provided is incorrect do contact us or comment below, so that we will correct the same in our system as well we will try to correct the same in OpenStreetMap.
The applications of GIS tools are expanding in the field of business, research, defense, etc. Thus the features and tools of every GIS software are updating abruptly for helping users in these industries to get the right information by performing complex analyses over GIS data. But working with most of the GIS software in the market requires adequate training and dense knowledge in geospatial concepts.
That is where IGISMap is useful. IGISMap is GIS based web platform providing multiple GIS applications that are most important in the field of geospatial analytics. The peculiarity of IGISMAP in the GIS Industry is its UI/UX that helps the user to perform effortless geospatial operations. In this article, we will discuss Add Existing File tool of IGISMap.
In IGISMap, GIS data is uploaded, created, edited and worked on a map. A map is a spatial interface that supports GIS data and give access to various tools to perform geospatial operations. As a user of IGISMap, you can create any number of maps and add GIS data of any formats.
Add Existing File is a tool that keeps the list of all data that are available on every map in your IGISMap account. Users can open this tool directly from the map or from the dashboard to view the list of data that are published in the maps. You can select any data from the list, preview it and add that data to the map. Thus you dont have to take effort on uploading the data again if it is available in any map.
Let’s look into the application of Add Existing File tool in IGISMap.
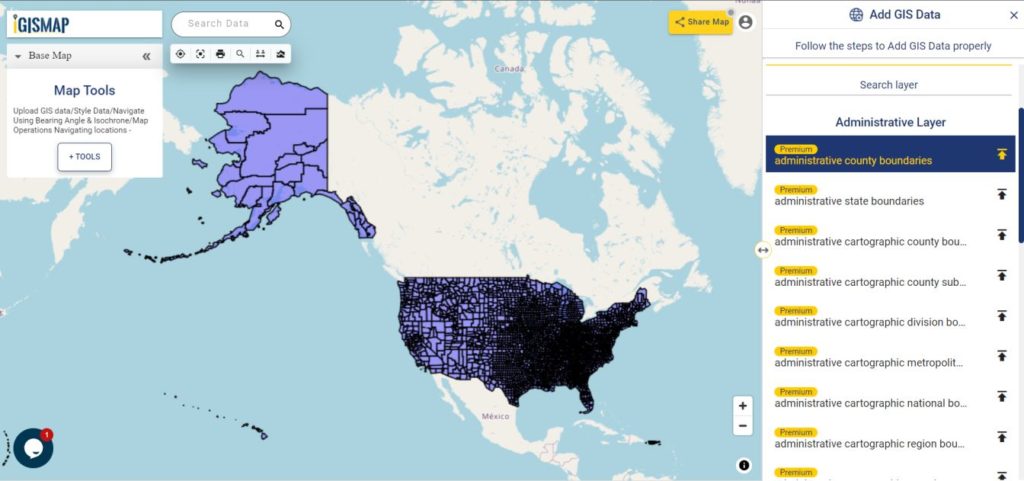
Let’s see how a data published in a map get listed in Add Existing Tool. So let’s first publish a data in a map. For this lets use Add GIS Data and publish USA county boundaries polygono data
Add data from IGISMap GIS data collection
Select united states of america from the list of countries and select the data administrative county boundaries and click Add Layer icon.
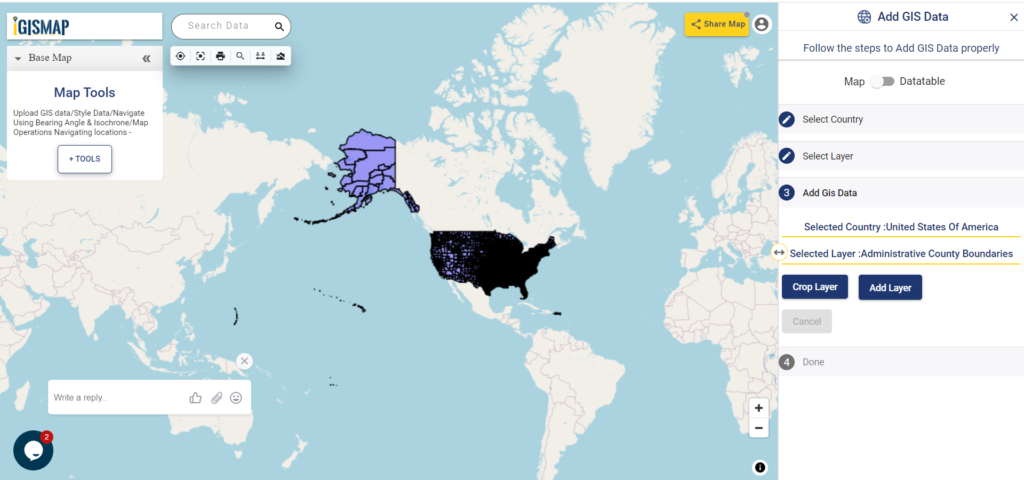
In the next step, since we dont need to crop the data, directly click Add Layer button as shown below.
Add GIS Data – Add Layer
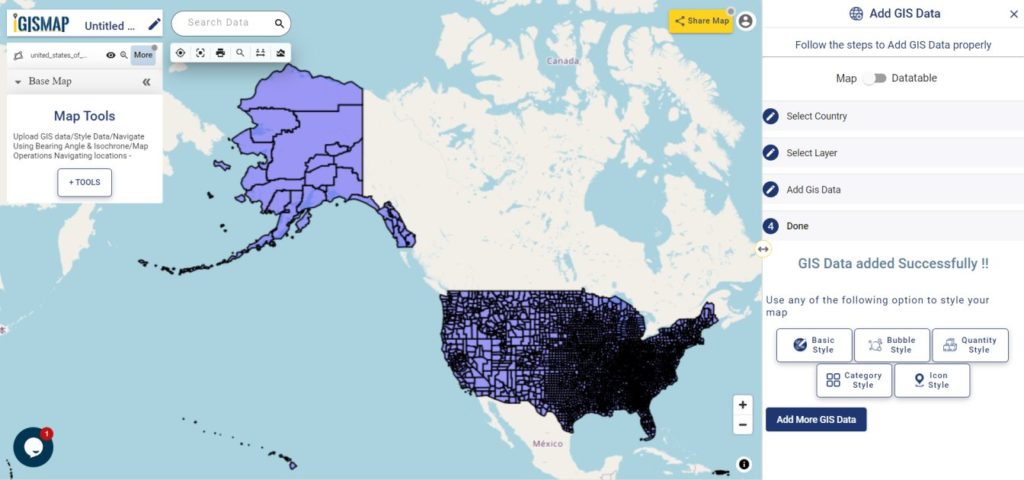
Now, GIS data of USA county boundaries are successfully added in the map.
Data Published
Publish data from Add Existing File
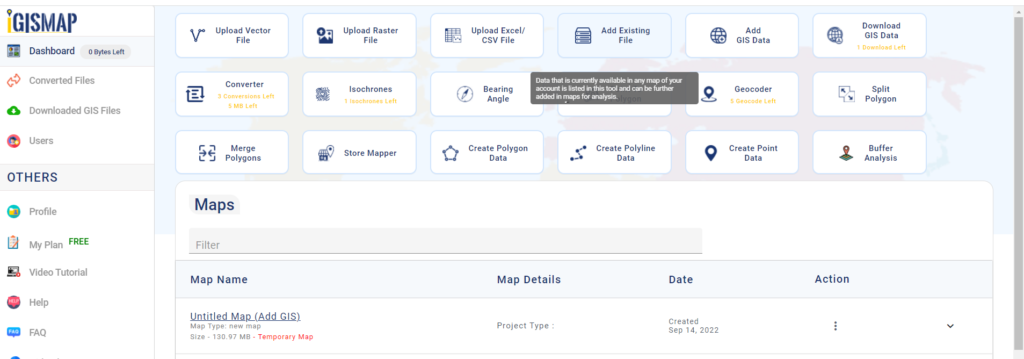
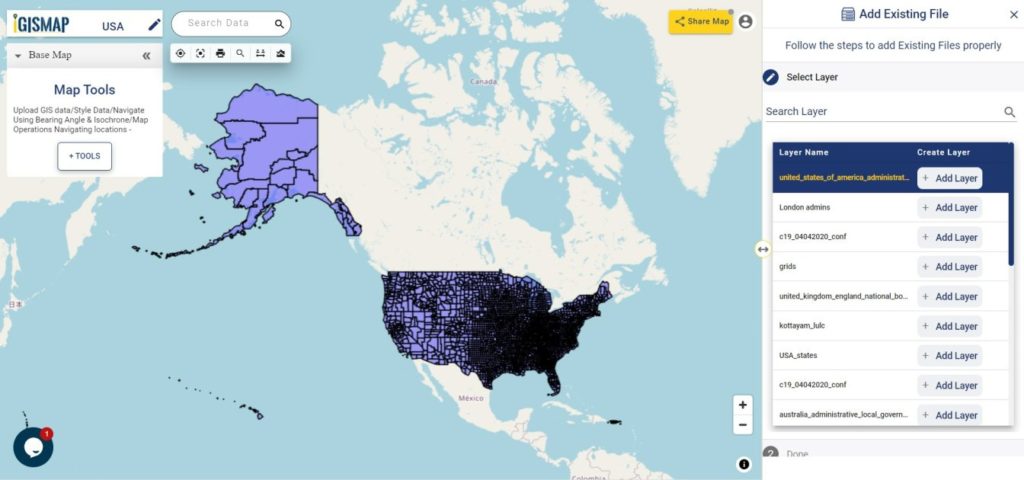
Now, we can add the USA County Level data layer using the Add Existing File. If you want add the data in a new map, open Add Existing File tool from the dashboard.
IGISMap Dasboard
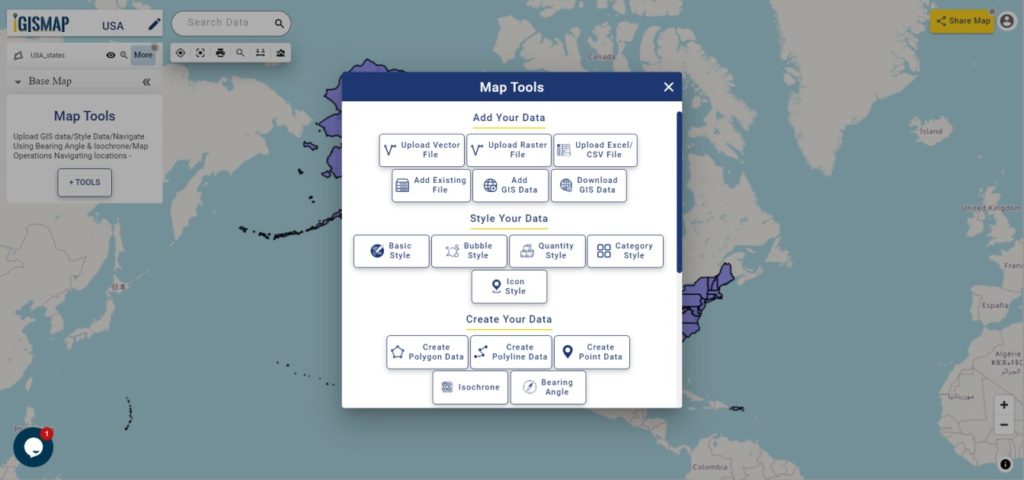
If you want to add the data from an existing map, click the Tools button below the layer list. This will open the list of all tools of IGISMap, as shown below.
In the section Add Your Data, click Add Existing File to open the tool.
Map Tools
Now Add Existing File tool is opened with the list of all images currently published in the maps of your IGISMap account. The data we added from Add GIS Data, which is administrative county boundaries data of USA is listed top of the list. Or you can search the data using Search Layer option.
You can click and preview the data like the following.
Add Existing File tool
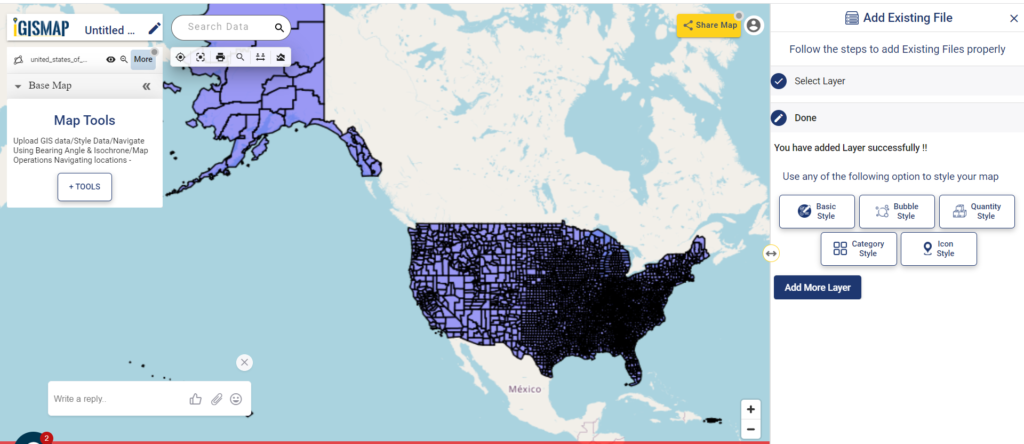
Click Add Layer button to publish this layer in your new map.
Structure of telecommunication networks are complex and create large quantities of geographically dispersed data. Consider you are a data engineer working in the telecommunication sector who wants to plot telephone pole locations with its attribute data to keep the track for its operations and maintenance. The attribute data added with the plotted locations can help you to observe information associated with each telephone pole and maybe embed this map on the department website.
GIStechnology is advancing in various field including the telecommunications sector to build maps and perform GIS analysis. Limited GIS software are available that provides services in both creating maps and hosting them on websites. GIS mapping enables people working in telecommunication sectors to enhance network planning, deployment, maintenance, operations, and even sales and marketing.
IGISMap gives powerful tool sets to create interactive maps of locations and geospatial features associated with any applications based on social services, business analysis, scientific research etc. Using the tools in the IGISMap application, we can track, maintain and analyze the telephone poles. IGISMap is a web platform providing multiple GIS applications that are most important in the field of geospatial analytics. GIS tools of IGISMap application allows users to Add Data, Create Data, Map Data, Style Data, Process Data, Analyze Data and also help users to Share Data privately or publicly.
How to plot Telephone pole locations online with Attributes?
Create Point Datatool of IGISMap is a powerful GIS tool to plot point vector data to represent locations and point objects with latitude and longitude value. Using this online tool, we can plot the locations of telephone poles and can add the attribute data to each location of the data created.
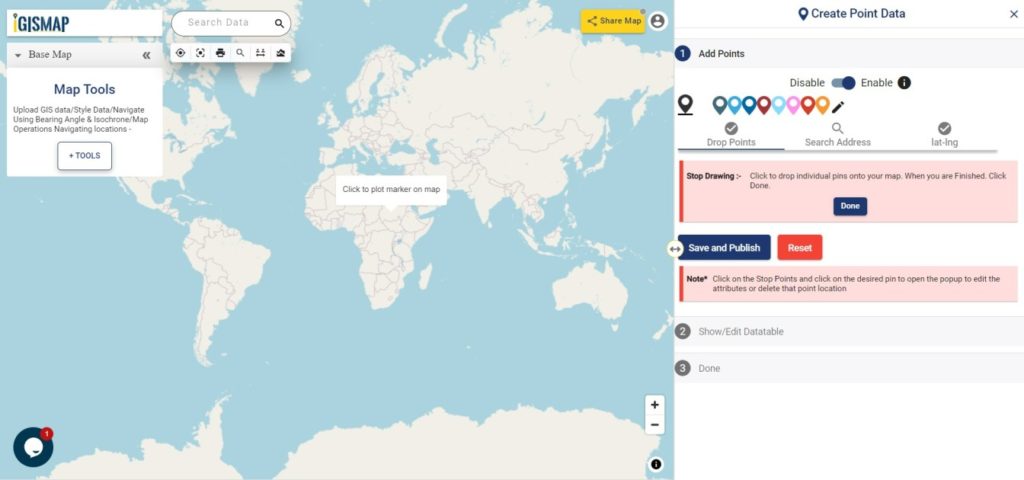
Start Plotting Points for Telephone Pole Locations
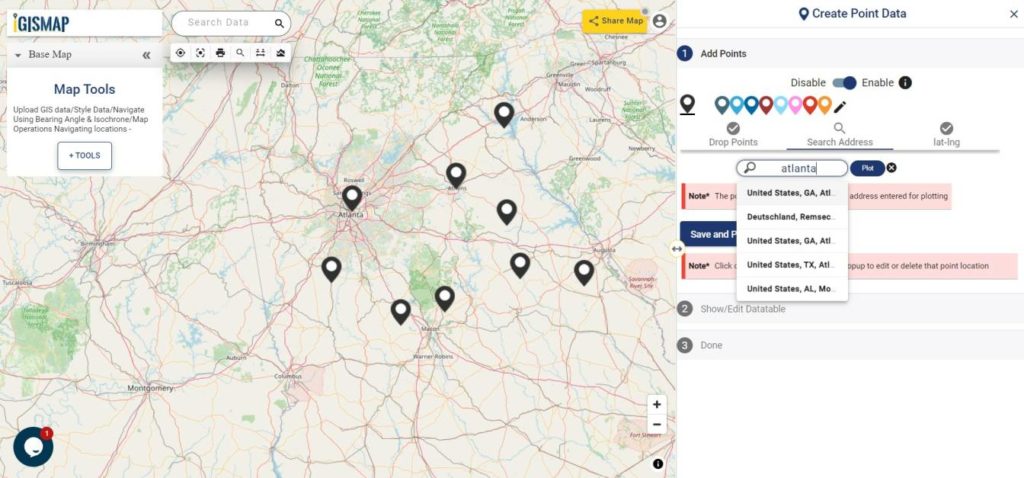
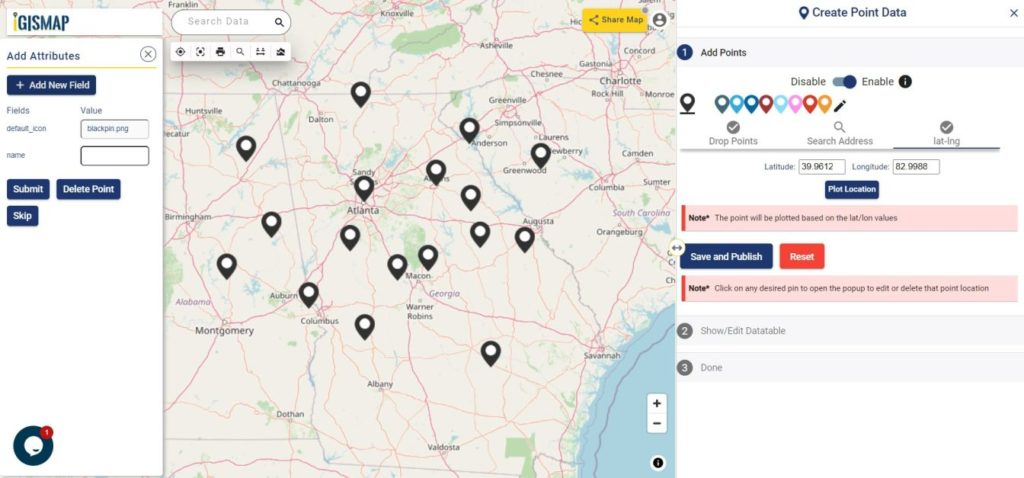
First step is Add Points, where we can start plotting the telephone pole locations as pins. IGISMap provides you with three features for plotting points: Drop Points, Search Address, and Lat Lon Values.
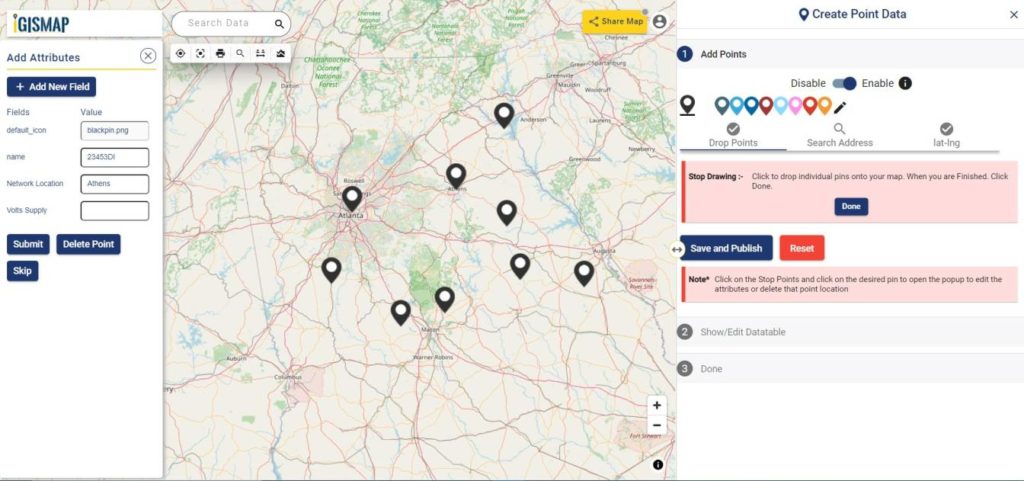
Drop points let us drop a pin at the desired location on the map. Zoom to the location of the telephone pole and click to add the pin.
Add Points – Drop Points
Search Address option opens a search address box, where you can enter an address and choose the right location address from the dropdown and click the Plot button to plot a point on that location.
Add Points – Search Address
Lat Lon Values will open two boxes to enter latitude and longitude values of the location you want to plot, Plot Location button in this option will plot a pin at the location you have entered.
Add Points – Lat Lon
Also, a popup will open for entering attribute values in each attribute field for that telephone pole locations when a point is plotting. Click the Submit button to submit the save the attribute entries. You can choose to delete the point you plotted by clicking the Delete Point button. You can disable the default opening of this popup using the toggle button.
But we can open this popup anytime while plotting, by simply clicking on an existing pin.
Note: If the Drop Points option is active for dropping pins, it should be unselected for selecting the plotted pins to open the attribute popup.
After plotting every desired slum locations for our data, click the Save and Publish button to publish your data in the map.
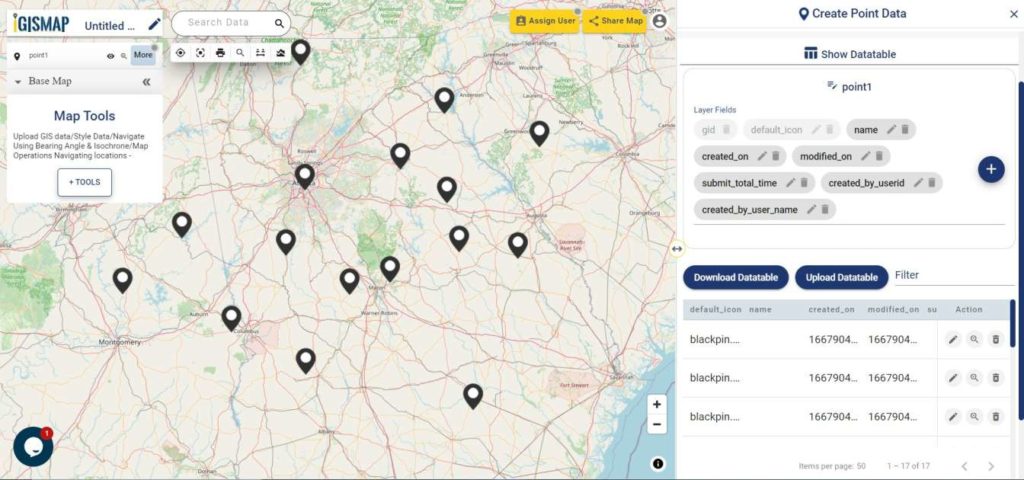
Review and edit the datatable
After publishing Telephone poles, Show/Edit Datatable section will be opened. Here you can edit the attribute values entered for each point location after clicking button in the datatable along each row in the datatable. You can also choose to delete a point by clicking button.
Show Datatable
Options to edit or delete the attribute fields are also available in this step along with the option to add new attribute fields to this data. If you thought of adding more points to the data of ATM Locations, select the Back button to go to the Add Points section, where you can add more points and make changes to the already published data.
Option to update the data table as bulk is available in this section. Where the whole data table can be downloaded in Excel format using Download Datatable button. And to make the changes outside IGISMap, then upload the edited/updated spreadsheet file using Upload Datatable button and integrate with the same point data of ATM locations.
After making all the changes in the datatable, let’s move to the styling section by clicking the Next button to finish plotting.
Style Your Telephone Pole Points
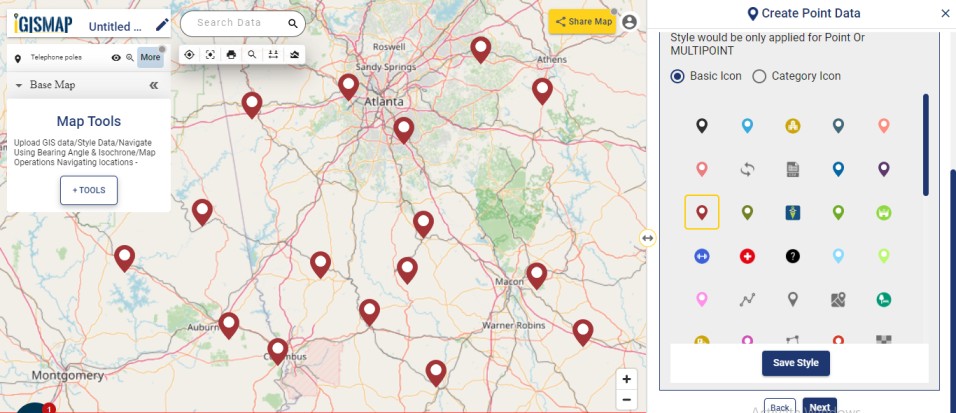
A map will become more meaningful if appropriate icons and colors are used to visualize the features of the map. In IGISMap styling options, Bubble Style and Icon Style are provided for point GIS data.
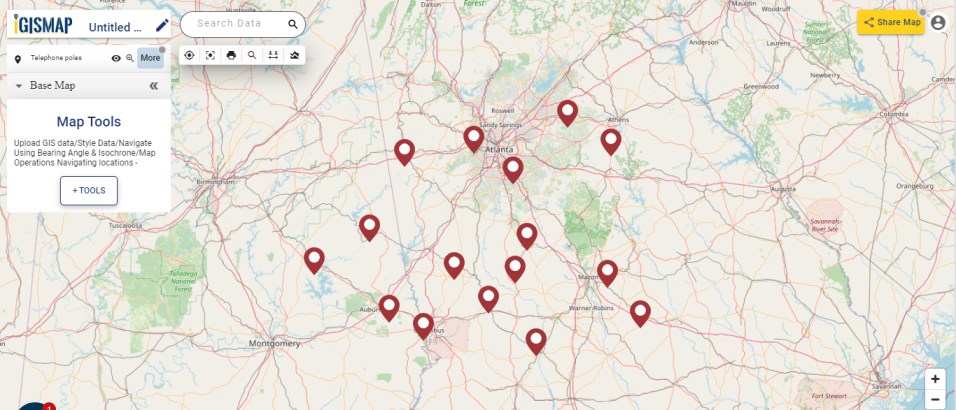
In Icon Styling, IGISMap provides two more options – Basic and Category styling. Basic Style will provide an appropriate pin icon for styling the telephone pole points and apply it on the telephone polesdata as follows.
Basic Icon style
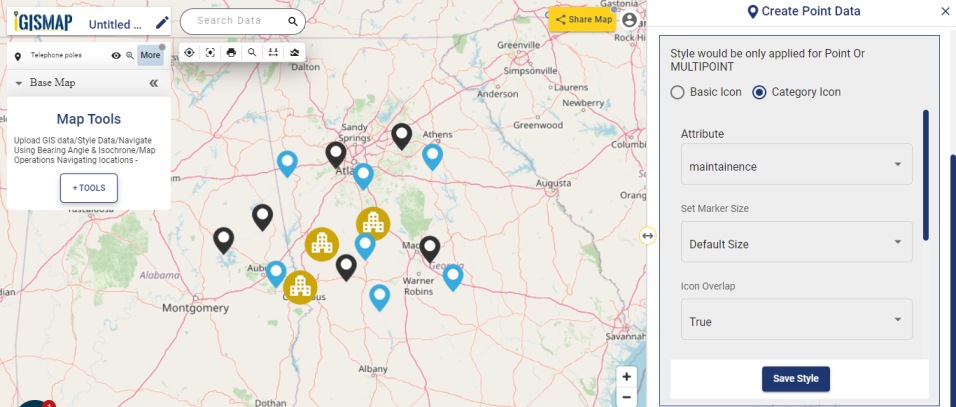
Another style is the Category Icon styling, where users can select the category on the basis of which styling is added to the point data. For example, if the user selects maintenance attribute as a categorical option, style is changed to symbol using those items.
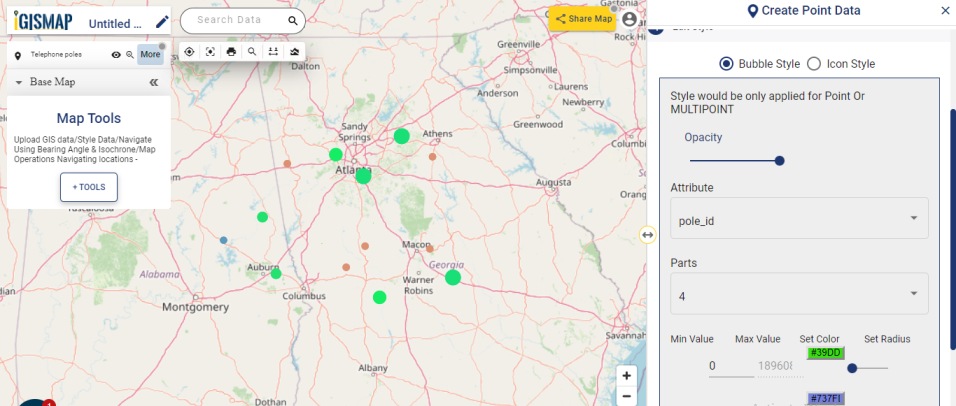
Bubble style is used to visualize the data quantitatively based on the numerical fields in the datatable. We can assign the size and color of the bubble for each class of values.
Click on Save Style option to save the Bubble style option for the added points.
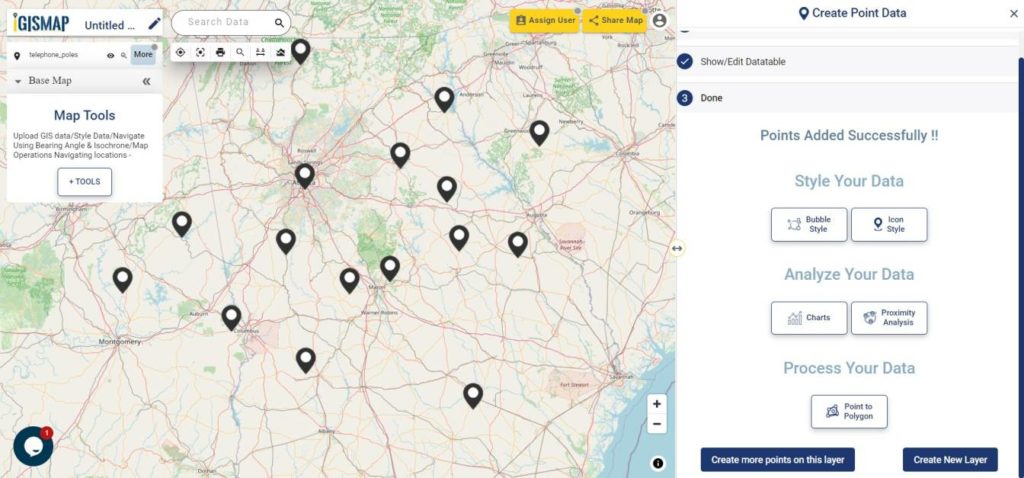
It’s done! Now if the user wants to add more points, click on Create more points on the layer option. If the user wants to create a new layer, select Create New Layer option.
Created point GIS data
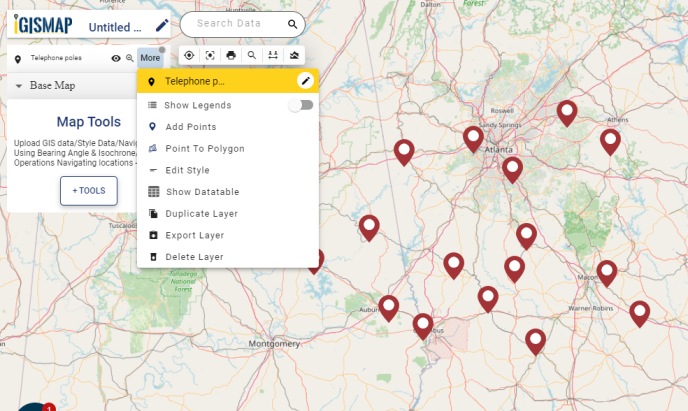
After the point GIS data of telephone pole locations is published in the name Telephone poles, More option beside the data provides list of other features. They can be used for adding more points, showing the legend in the map, editing the style and more.
More options
Check the article Share your Map to understand about Share Map feature of IGISMap.
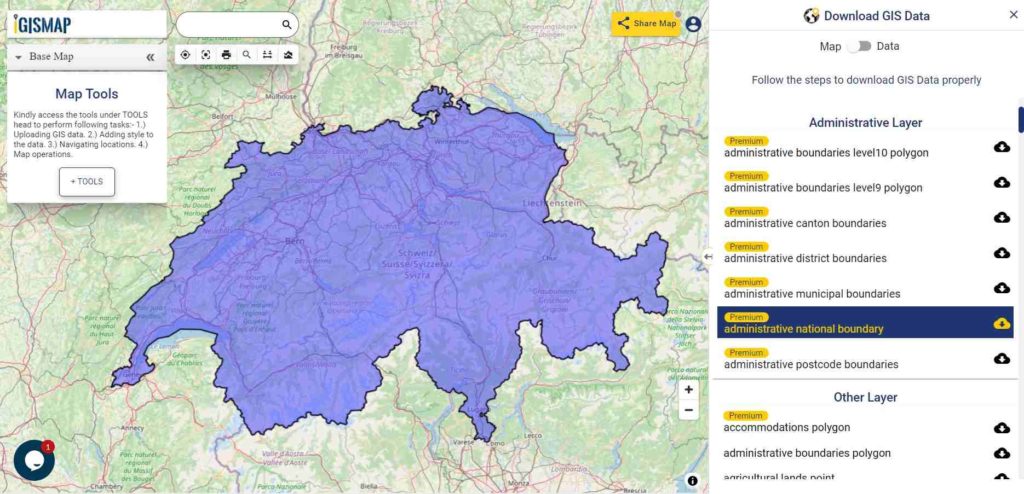
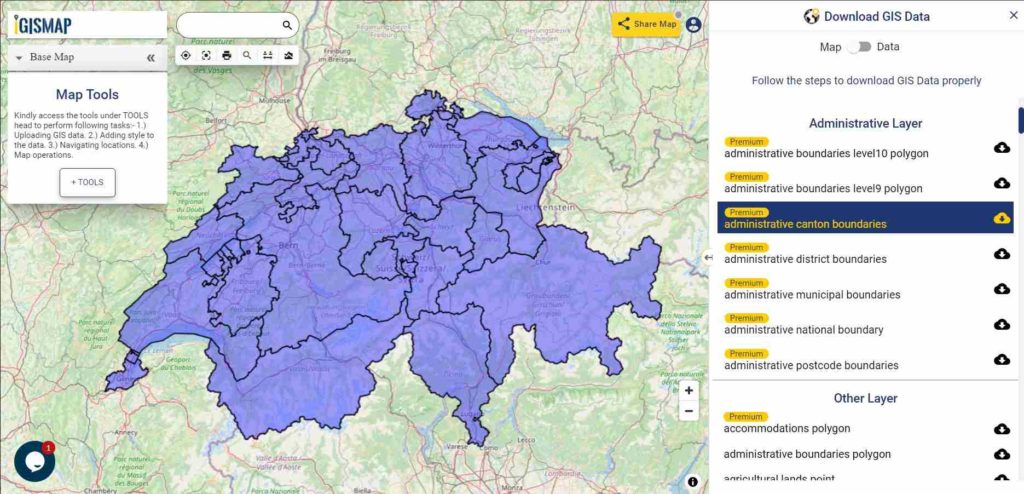
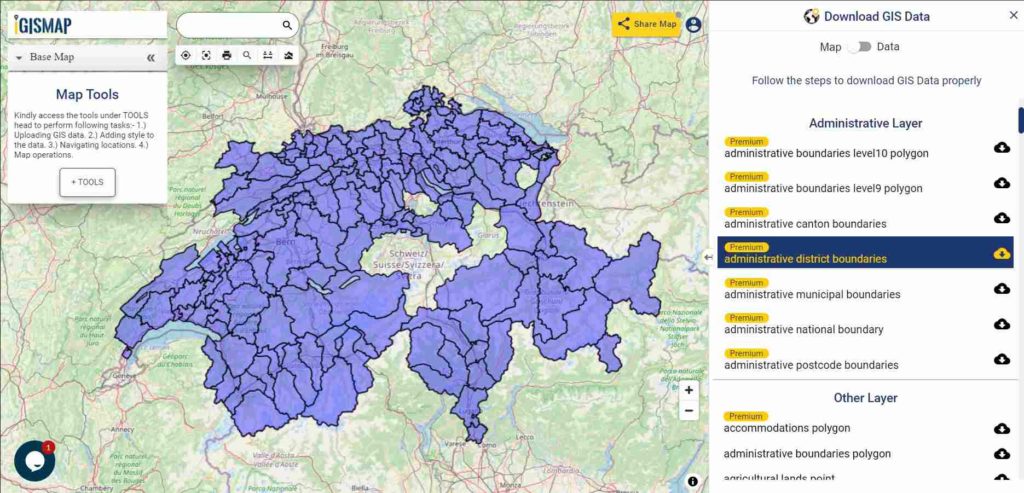
Hello GIS enthusiasts, IGISMAP has now published the latest GIS vector data of Switzerland administrative levels. Links for downloading the shapefiles of the important administrative divisions of Switzerland are provided in the following. You can also download these data in KML, GeoJSON or CSV formats.
Note:
All data available are in GCS datum EPSG:4326 WGS84 CRS (Coordinate Reference System).
You need to login for downloading the shapefile.
Download Free Shapefile Data of Switzerland
Switzerland, officially the Swiss Confederation, is a landlocked country at the confluence of Western, Central and Southern Europe. Switzerland is bordered by Italy to the south, France to the west, Germany to the north and Austria and Liechtenstein to the east. It is geographically divided among the Swiss Plateau, the Alps and the Jura, spanning a total area of 41,285 km2 (15,940 sq mi) and land area of 39,997 km2 (15,443 sq mi).
Districts of Switzerland are a political subdivision for cantons. In the federally constituted Switzerland, each canton is completely free to decide its own internal organization. Following data of Switzerland have 159 district boundaries.
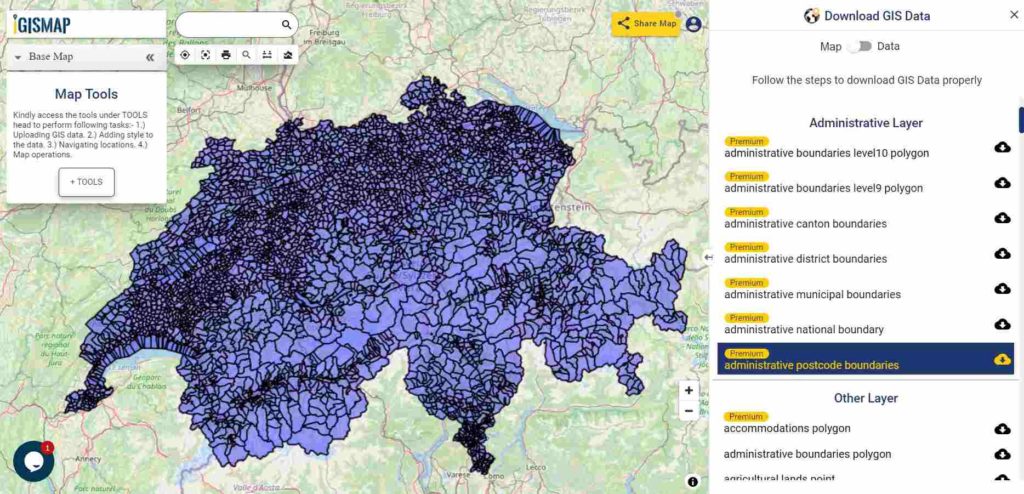
Download Switzerland Postcode areas Shapefile Data
Switzerland is divided into nine postal districts, numbered from west to east. Each district is subdivided into postal areas. Each area contains a maximum of one hundred units. There are 4116 Postcode in the following data.
Disclaimer : If you find any shapefile data of country provided is in correct do contact us or comment below, so that we will correct the same in our system as well we will try to correct the same in OSM.
Hello GIS enthusiasts, IGISMAP has now published the latest GIS vector data of Ireland administrative levels. Links for downloading the shapefiles of the important administrative divisions of Ireland are provided in the following. You can also download these data in KML, GeoJSON or CSV formats.
Note:
All data available are in GCS datum EPSG:4326 WGS84 CRS (Coordinate Reference System).
You need to login for downloading the shapefile.
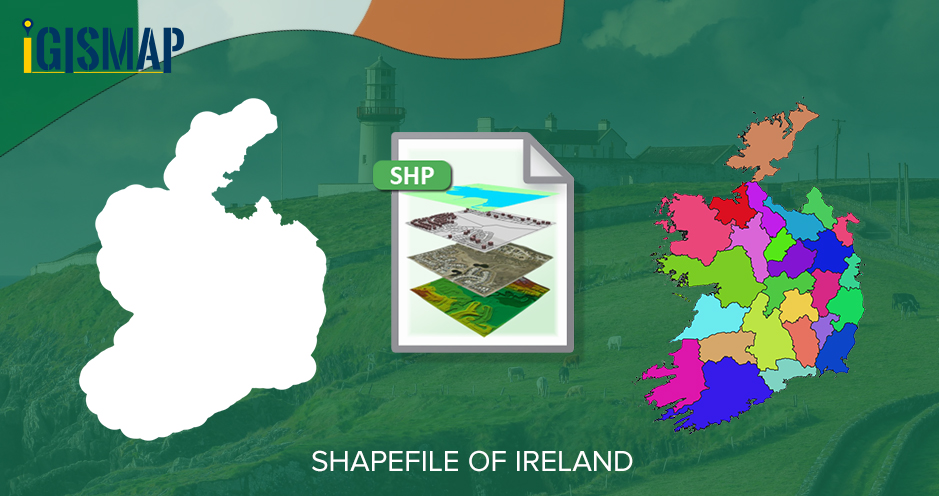
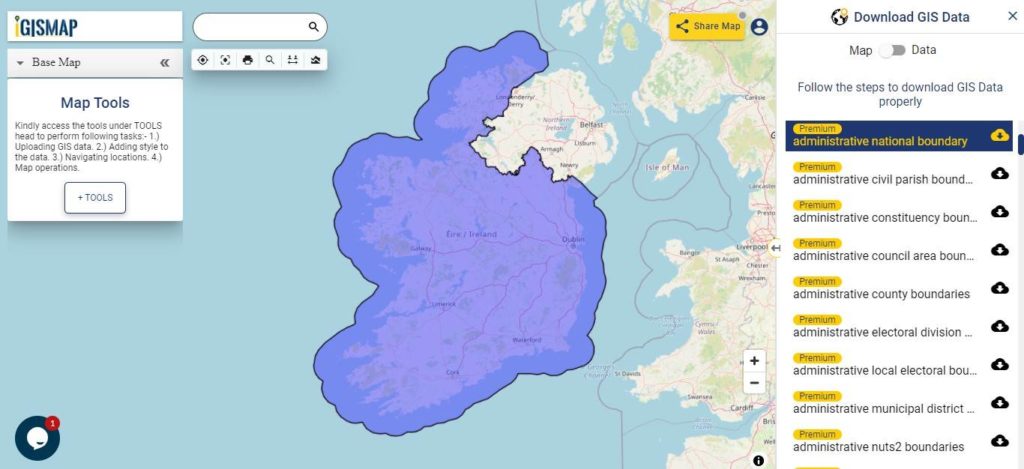
Download Free Shapefile Data of Ireland
Ireland also known as the Republic of Ireland is a country in north-western Europe consisting of 26 of the 32 counties of the island of Ireland. The capital and largest city is Dublin, on the eastern side of the island. Around 40% of the country’s population of 5 million people resides in the Greater Dublin Area. The sovereign state shares its only land border with Northern Ireland, which is part of the United Kingdom.
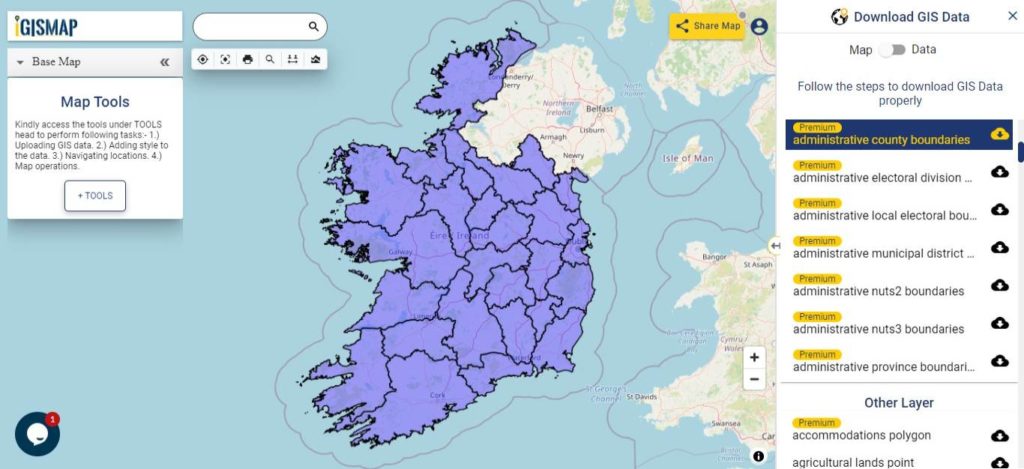
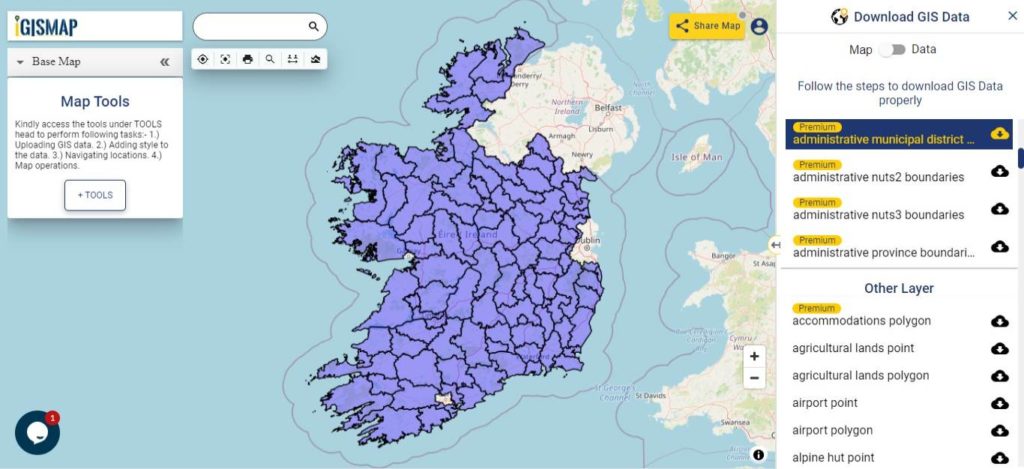
Download Ireland Municipal Districts Shapefile Data
A municipal district is an area of a council area that comprises one or more electoral area. In most cases the electoral area constitutes the municipal district. All counties and cities apart from the local authorities in the areas of Dun Laoghaire, Fingal and South Dublin and the cities of Dublin, Cork and Galway are divided into municipal districts. Councillors represent both the municipal district and the local authority. In total, there are 95 municipal districts in the country.
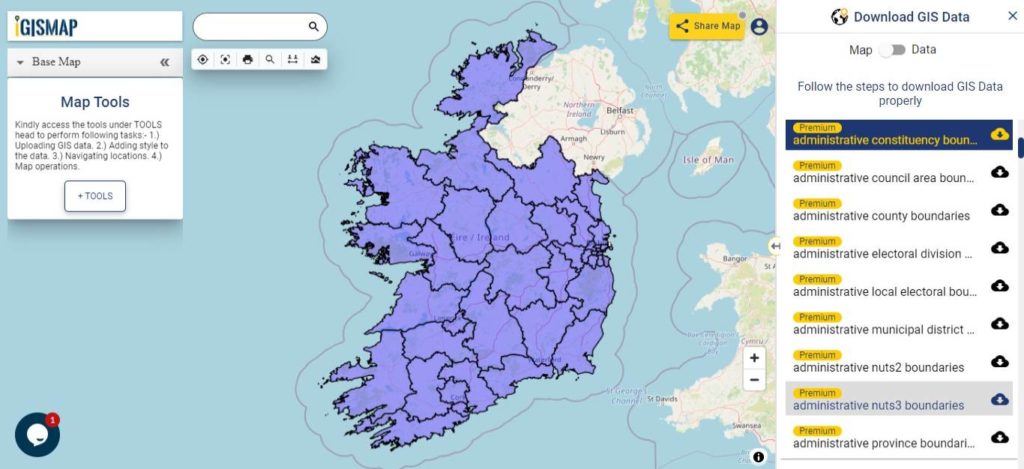
Download Ireland Parliamentary Constituencies Shapefile Data
There are 39 multi-memberelectoral districts, known as Dáil constituencies, that elect 160 TDs (members of parliament), to Dáil Éireann, Ireland’s lower house of the Oireachtas, or parliament, by means of the single transferable vote, to a maximum term of five years.
Disclaimer : If you find any shapefile data of country provided is in correct do contact us or comment below, so that we will correct the same in our system as well we will try to correct the same in OSM.
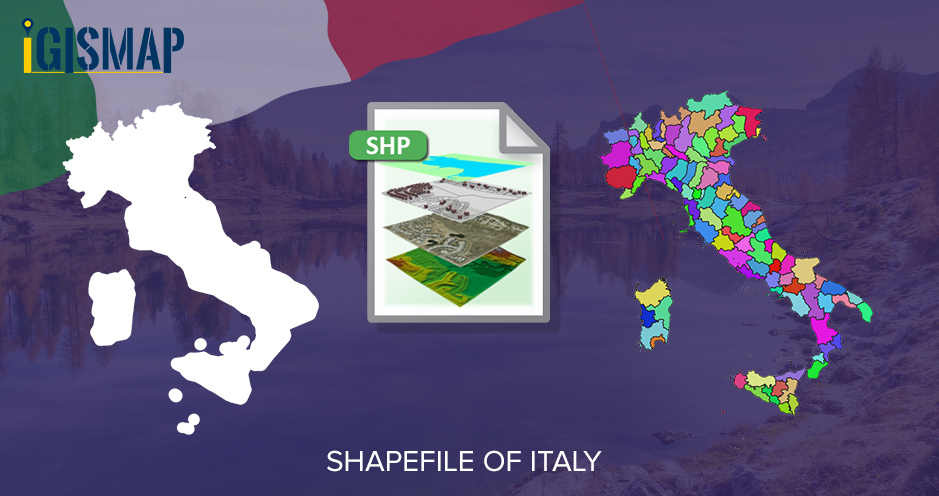
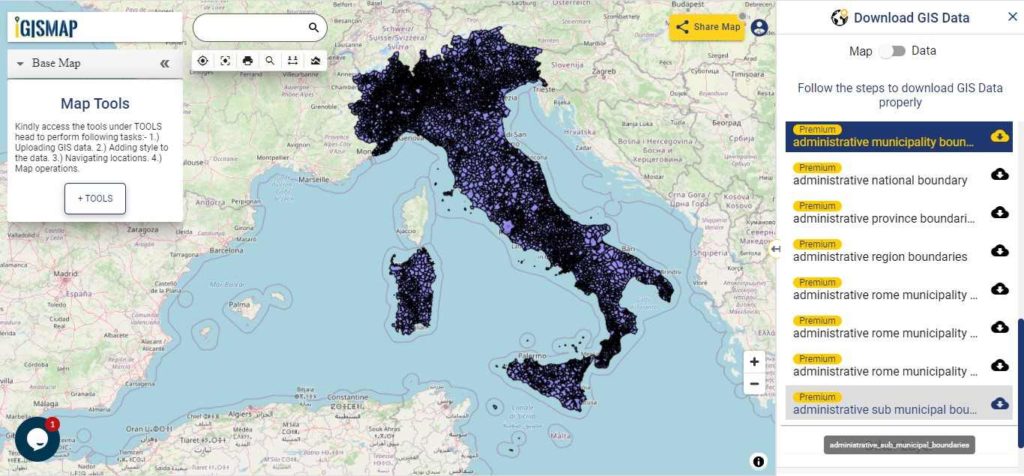
Hello GIS enthusiasts, IGISMAP has now published the latest GIS vector data of Italy administrative levels. Links for downloading the shapefiles of the important administrative divisions of Italy are provided in the following. You can also download these data in KML, GeoJSON or CSV formats.
Note:
All data available are in GCS datum EPSG:4326 WGS84 CRS (Coordinate Reference System).
You need to login for downloading the shapefile.
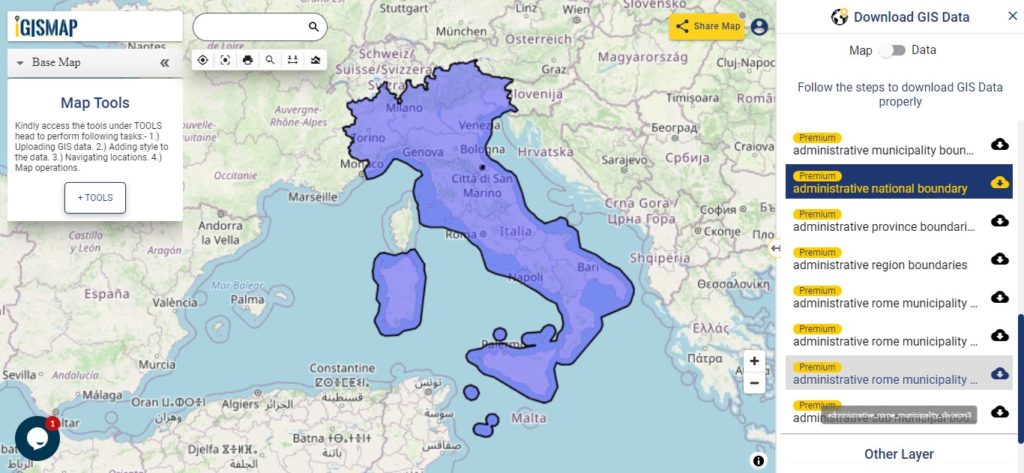
Download Free Shapefile Data of Italy
Italy officially known as the Italian Republic is a country consisting of a peninsula delimited by the Alps and several islands surrounding it, whose territory largely coincides with the homonymous geographical region. Italy is located in the centre of the Mediterranean Sea, in Southern Europe and is also considered part of Western Europe. A unitary parliamentary republic with Rome as its capital and largest city, the country covers a total area of 301,340 km2 (116,350 sq mi) and shares land borders with France, Switzerland, Austria, Slovenia, and the enclaved microstates of Vatican City and San Marino.
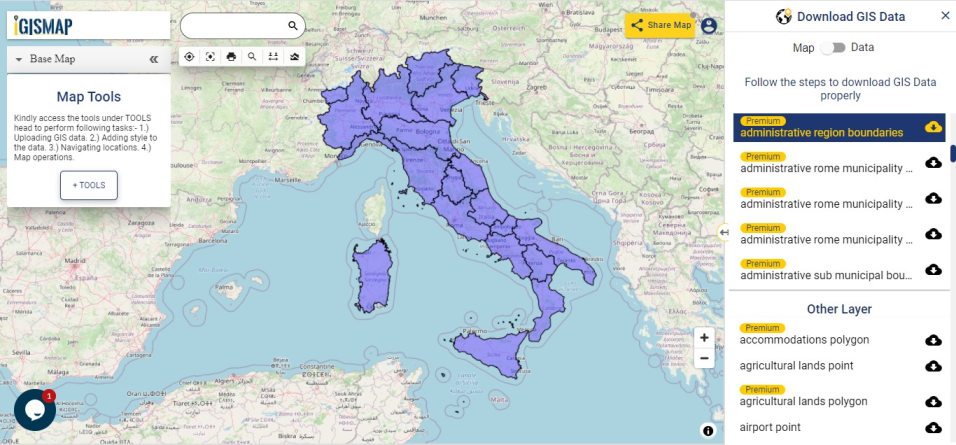
The regions of Italy are the first-level constituent entities of the Italian Republic, constituting its second NUTS administrative level. There are 20 regions, of which five have greater autonomy than the other fifteen. Under the Italian Constitution, each region is an autonomous entity with defined powers. With the exception of the Aosta Valley, each region is divided into a number of provinces.
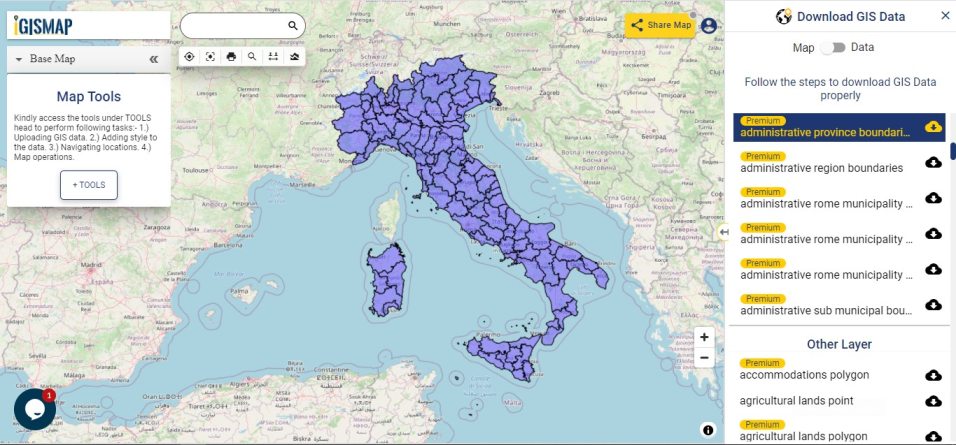
The provinces of Italy are the constituent entities of the Italian Republic, on an intermediate level between a municipality (comune) and a region (regione). Since 2015, provinces have been classified as ‘institutional bodies of second level’. There are currently 107 Provinces in Italy, including 80 ordinary provinces, 2 autonomous provinces, 4 regional decentralization entities, 6 free municipal consortia, and 14 metropolitan cities, as well as the Aosta Valley region (which also exercises the powers of a province). Italian provinces (with the exception of the current Sardinian provinces) correspond to the NUTS 3 regions.
The Municipalities also known as comune is a local administrative division of Italy, roughly equivalent to a township. In 2020, Italy counted 7914 municipalities. Between 2011 and 2020, the number of municipalities experienced a constant decrease. In 2011, there were over eight thousand municipalities in the country.
Disclaimer : If you find any shapefile data of country provided is in correct do contact us or comment below, so that we will correct the same in our system as well we will try to correct the same in OSM.
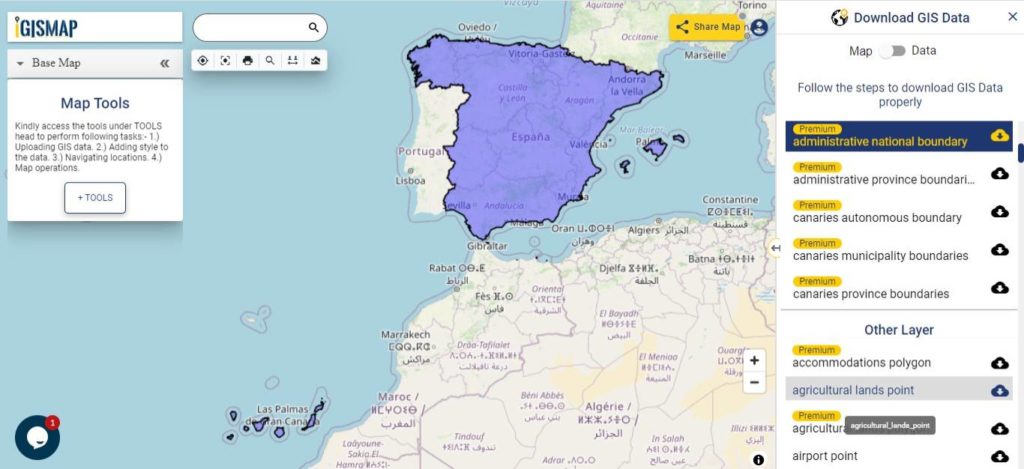
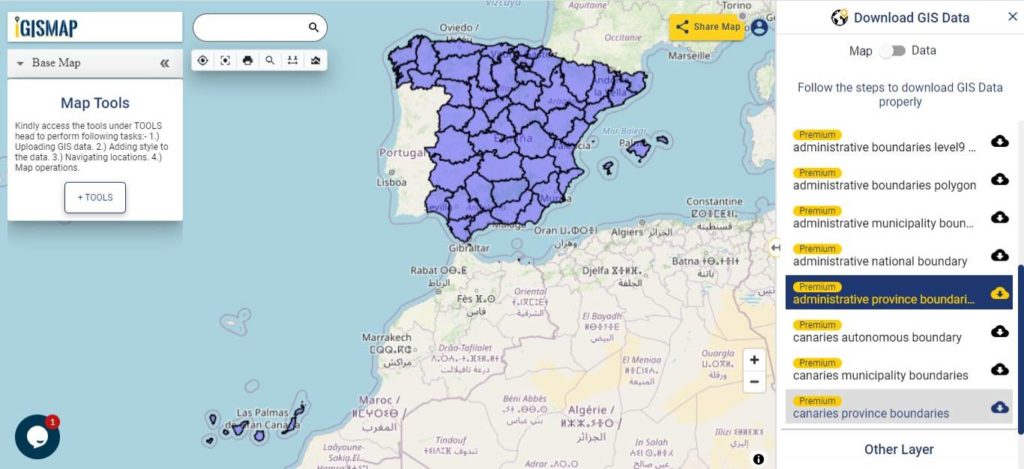
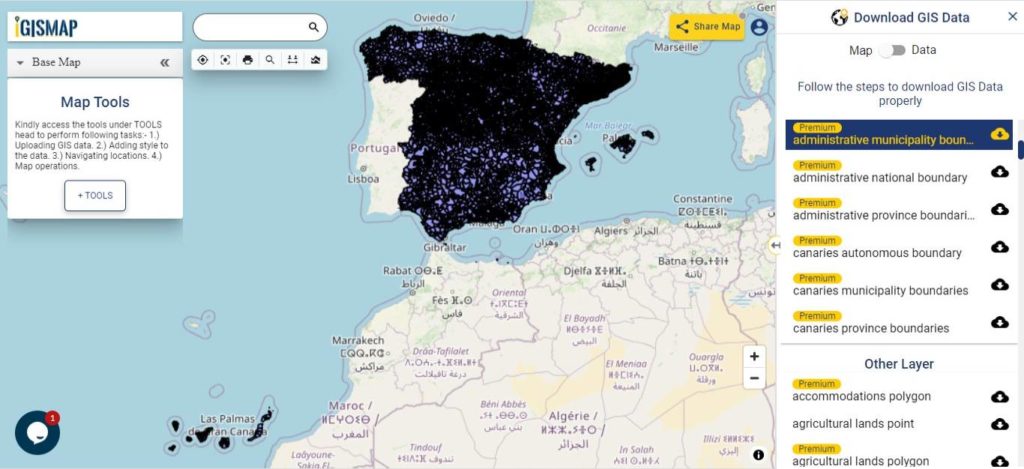
Hello GIS enthusiasts, IGISMAP has now published the latest GIS vector data of Spain administrative levels. Links for downloading the shapefiles of the important administrative divisions of Spain are provided in the following. You can also download these data in KML, GeoJSON or CSV formats.
Note:
All data available are in GCS datum EPSG:4326 WGS84 CRS (Coordinate Reference System).
You need to login for downloading the shapefile.
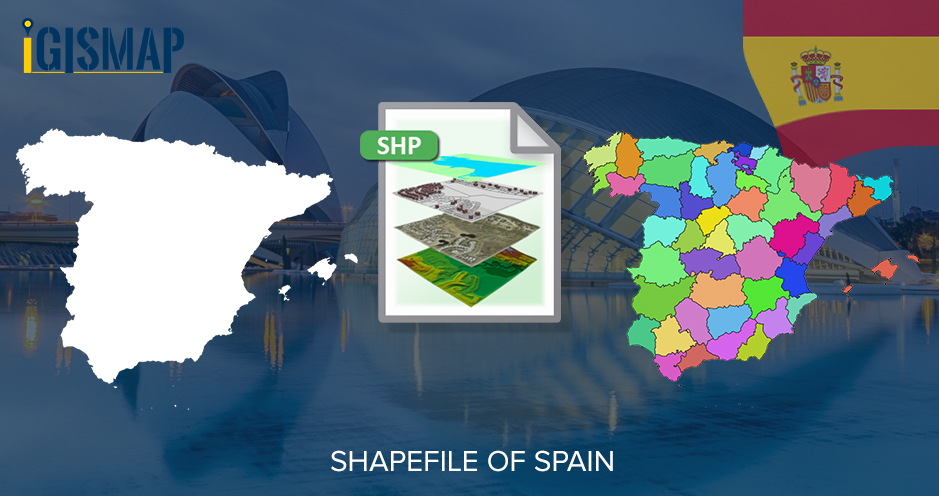
Download Free Shapefile Data of Spain
Spain officially known as the Kingdom of Spain is a country in Southwestern Europe with some pockets of territory in the Mediterranean Sea, offshore in the Atlantic Ocean. The country’s mainland is bordered to the south by the British overseas territory of Gibraltar, to the south and east by the Mediterranean Sea to the north by France, Andorra and the Bay of Biscay and to the west by Portugal and the Atlantic Ocean.
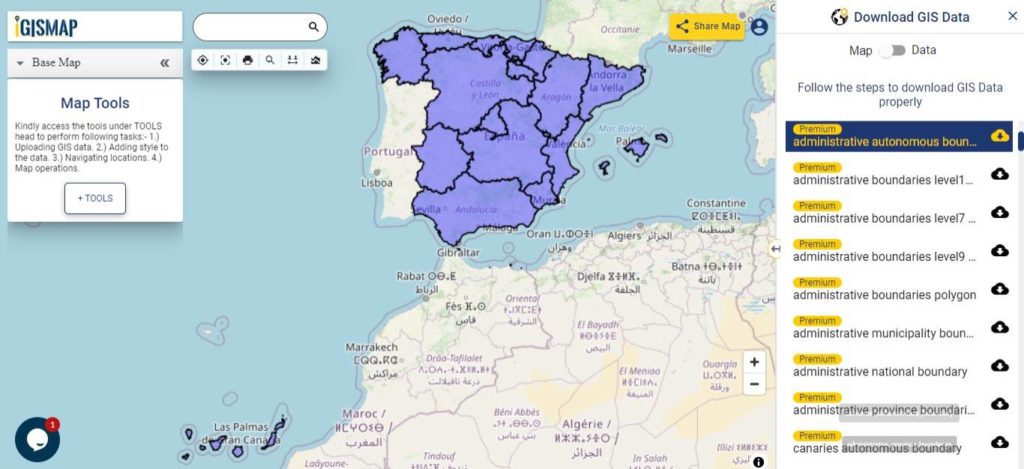
Download Spain Autonomous Communities Shapefile Data
In Spain, an autonomous community is a first level political and administrative division, created in accordance with the Spanish Constitution of 1978, with the aim of guaranteeing limited autonomy of the nationalities and regions that make up Spain. There are 17 autonomous communities and two autonomous cities that are collectively known as autonomies.
Spain and its 17 autonomous communities are subdivided into 50 provinces. Seven of the autonomous communities comprise no more than one province each: Asturias, the Balearic Islands, Cantabria, La Rioja, Madrid, Murcia, and Navarre. These are sometimes referred to as uniprovincial communities.
There is a total of 8124 municipalities in Spain, including the autonomous cities of Ceuta and Melilla. Burgos is the province with the most municipalities (371) and Las Palmas the one with the least (34).
Disclaimer : If you find any shapefile data of country provided is in correct do contact us or comment below, so that we will correct the same in our system as well we will try to correct the same in OSM.