Download Fruit Orchards GIS Data – Shapefile, KML, GeoJSON for All Countries

Looking to map agricultural landscapes more precisely? Download fruit orchards data effortlessly using GIS Data by MAPOG. This powerful and user-friendly platform offers seamless access to agricultural datasets in a wide range of GIS formats, including Shapefile, KML, MID, and over 15 others. Designed for agronomists, planners, researchers, and GIS professionals, the platform provides detailed, well-structured datasets that make analyzing orchard locations, coverage, and patterns easier than ever.

How to Download Fruit Orchards Data?

MAPOG simplifies the journey from data search to final download. With over 900+ layers and comprehensive global coverage, the platform supports popular formats like SHP, KML, MID, CSV, GeoJSON, DXF, GML, TOPOJSON, and MIF, among others—making it an ideal tool for both beginners and experts.

Download Fruit Orchards Data of any countries

Note:
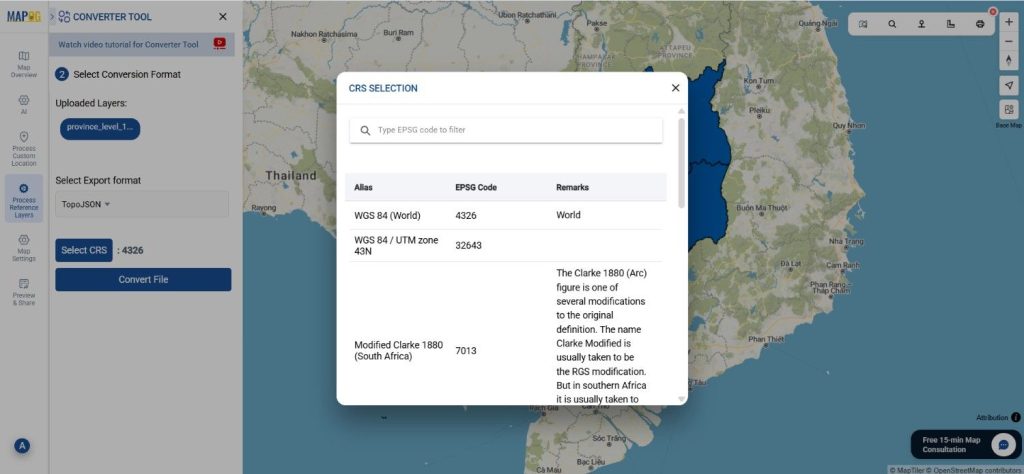
  • All data is provided in GCS datum EPSG:4326 WGS84 CRS (Coordinate Reference System).
  • Users need to log in to access and download their preferred data formats.

Step-by-Step Guide to Download Fruit Orchards Data

Step 1: Search for Fruit Orchards Data

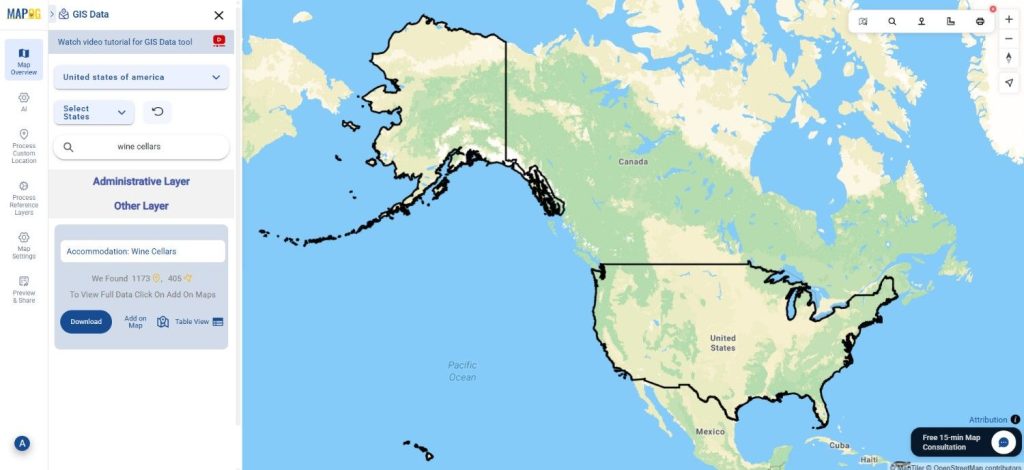
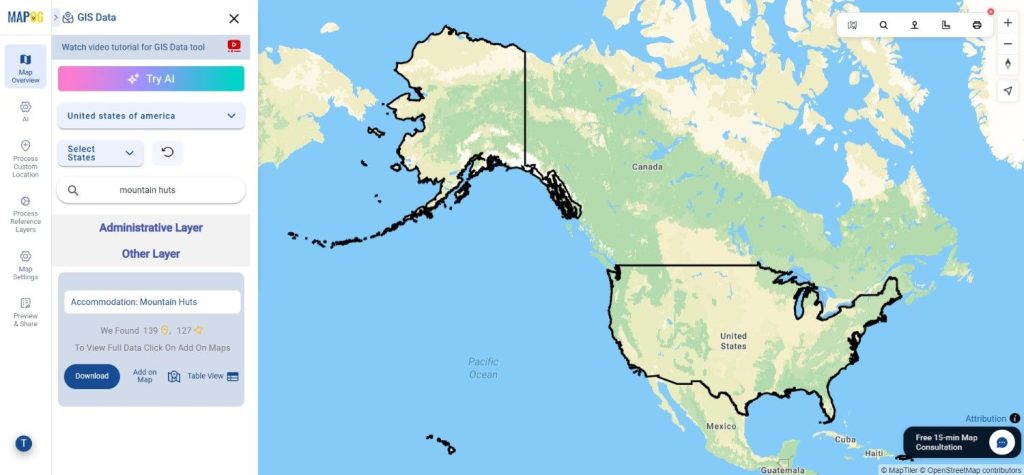
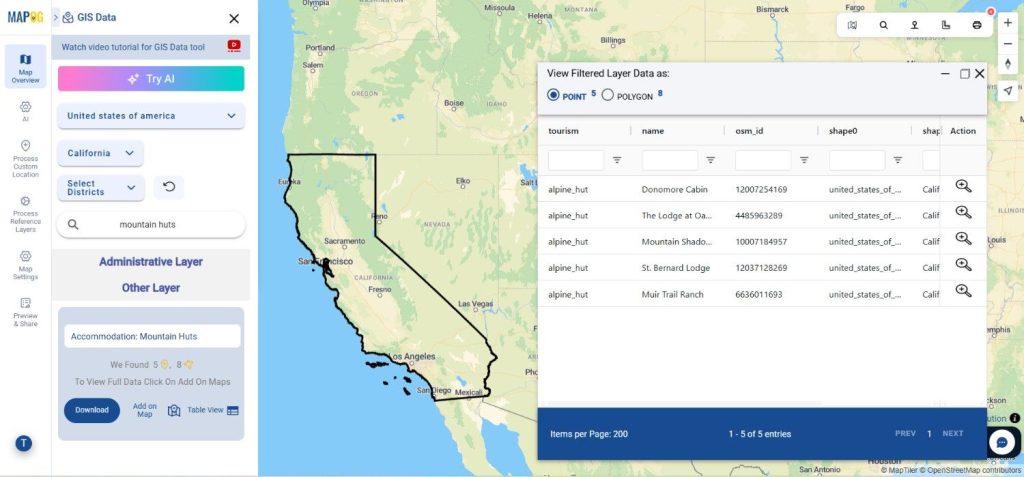
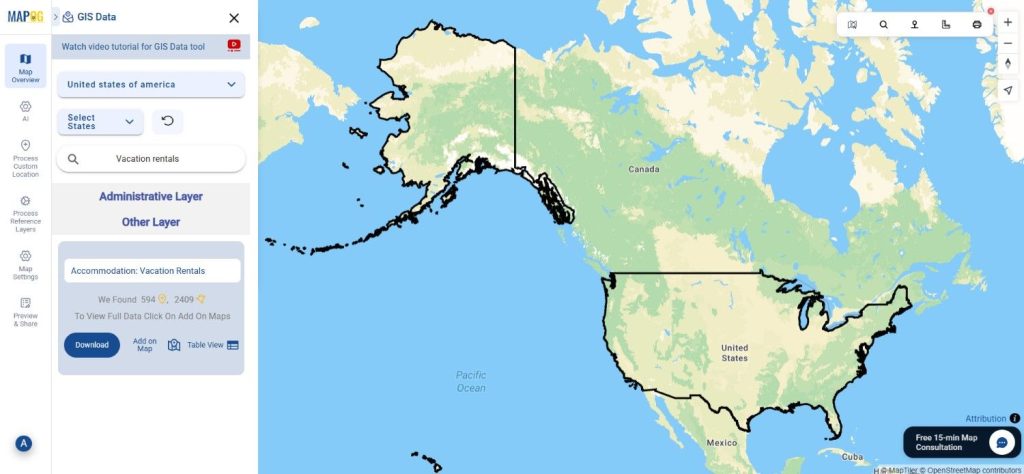
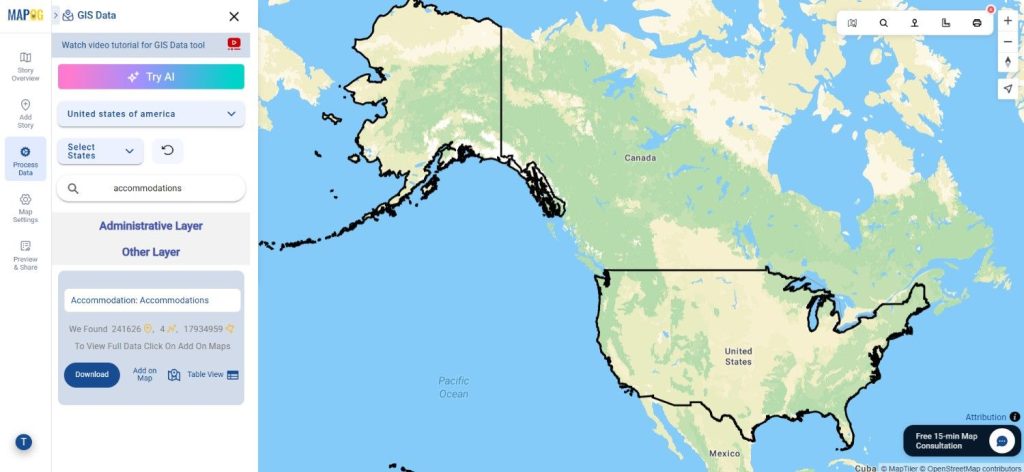
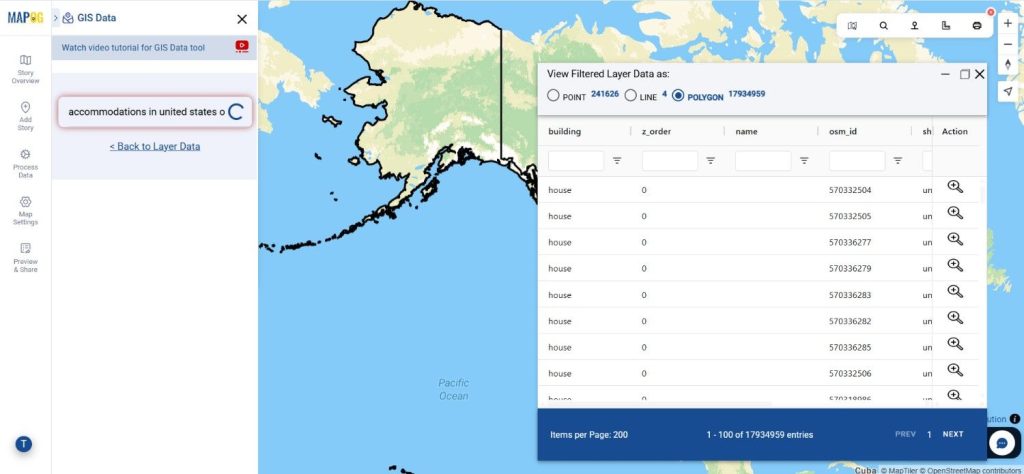
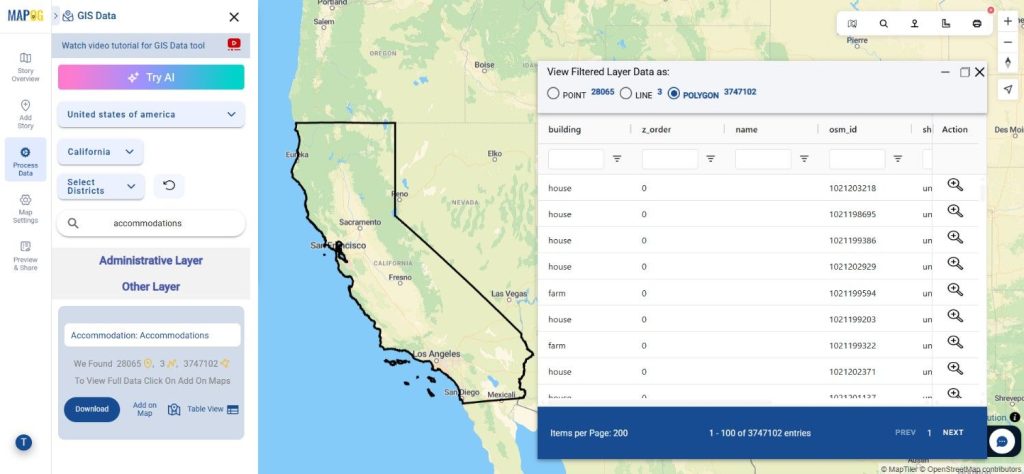
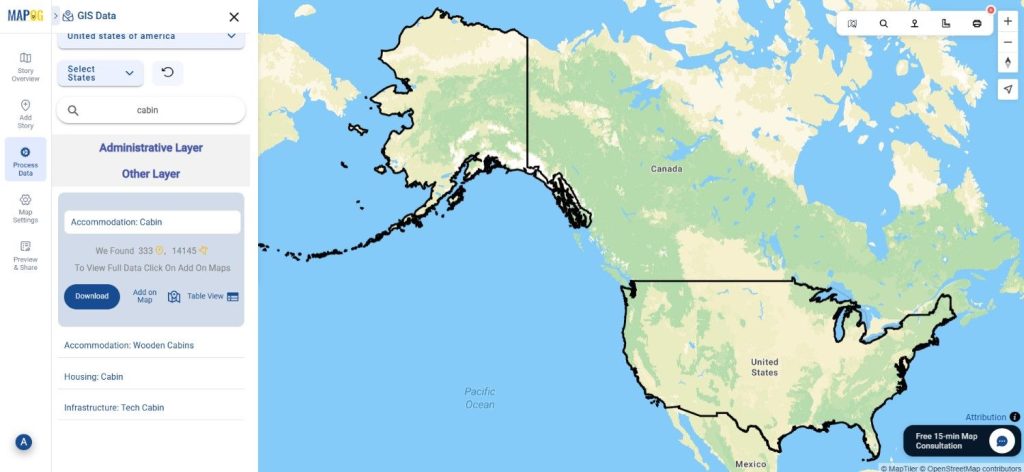
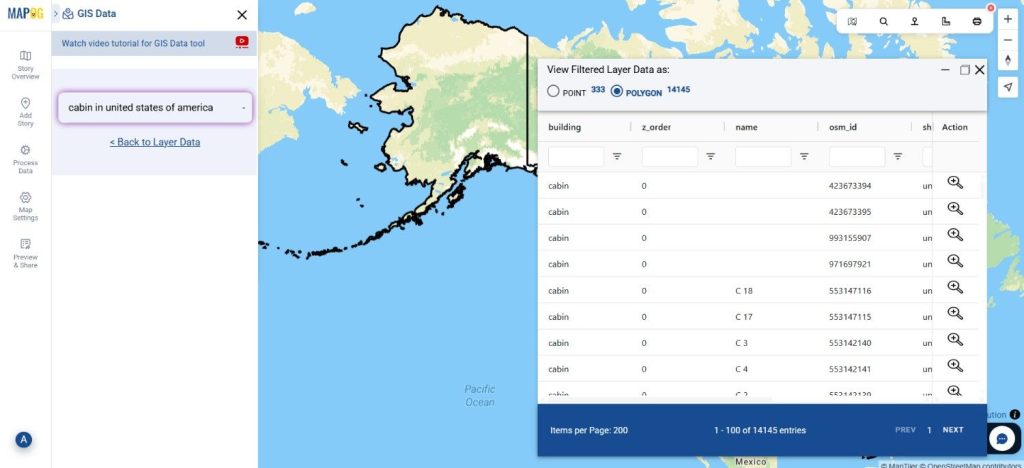
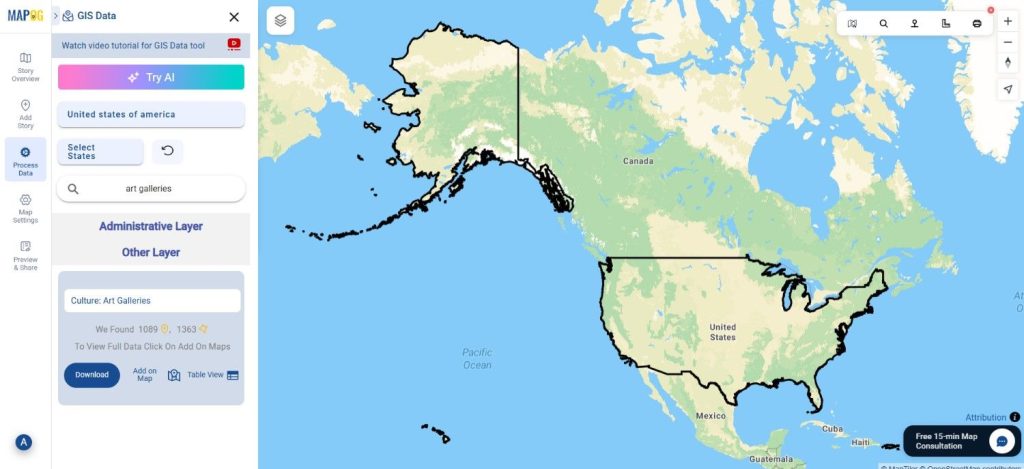
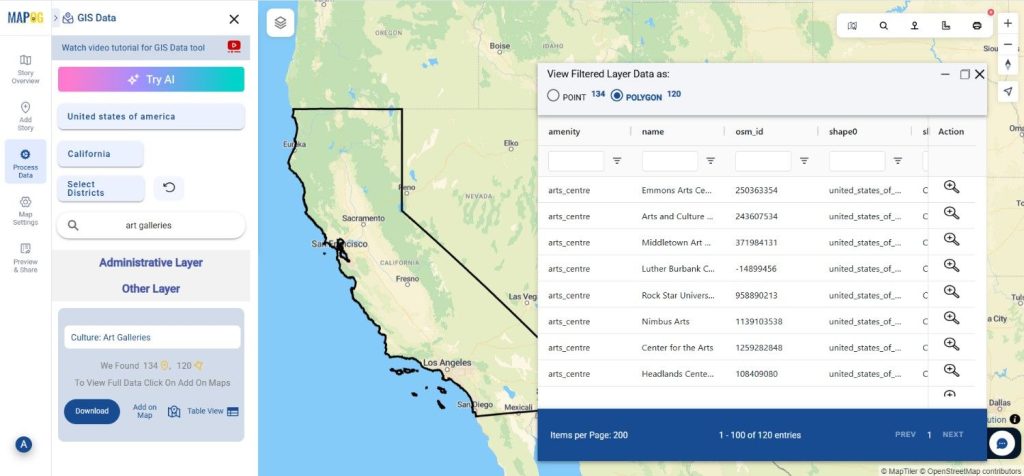
Begin by navigating to the GIS Data by MAPOG map interface. Use the search bar or explore layers to find “Fruit Orchards Data.” Preview the metadata to identify whether the data is represented as points or polygons and to understand attribute details.

Download Fruit Orchards Data
Step 2: Use the AI-Powered Search Tool

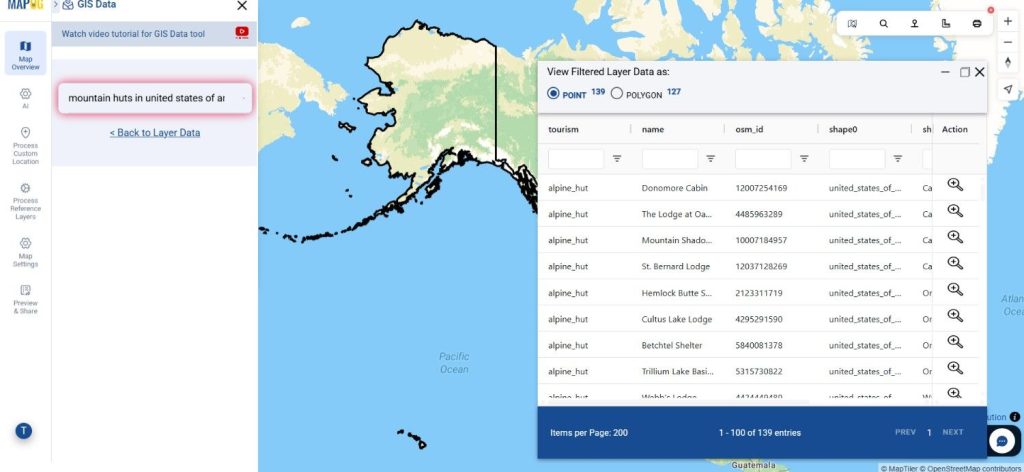
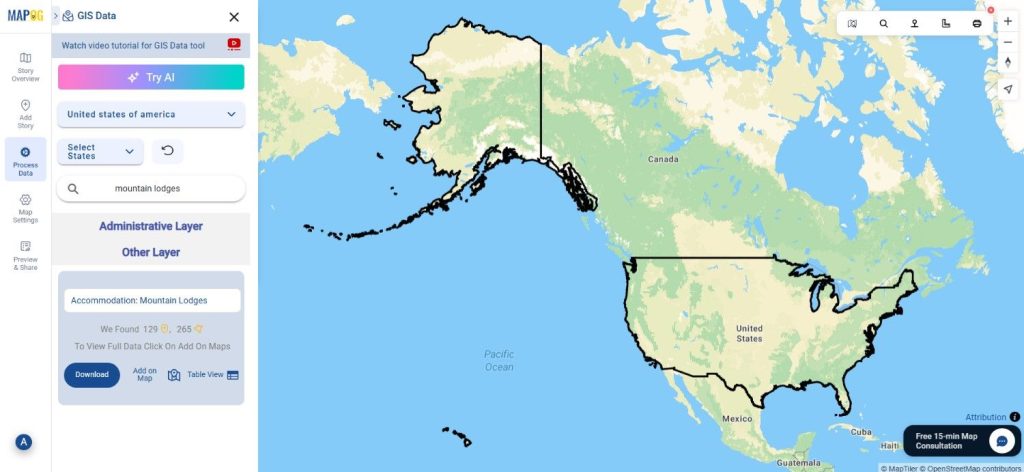
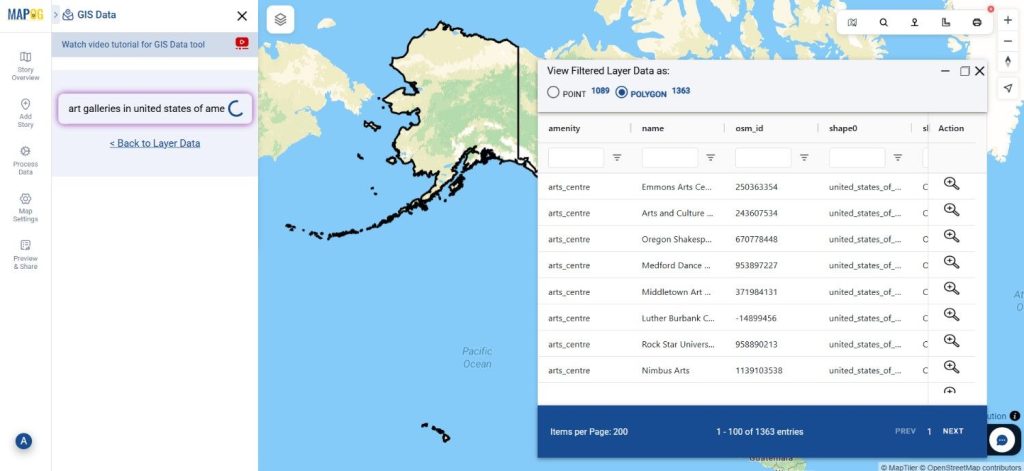
Tap into MAPOG’s “Try AI” feature to simplify your search. By entering a phrase like “fruit orchards near my location” or “orchard areas by district,” you’ll get instant suggestions and relevant layers. This tool is especially helpful when you’re unsure about naming conventions or regional layer titles.

Download Fruit Orchards Data
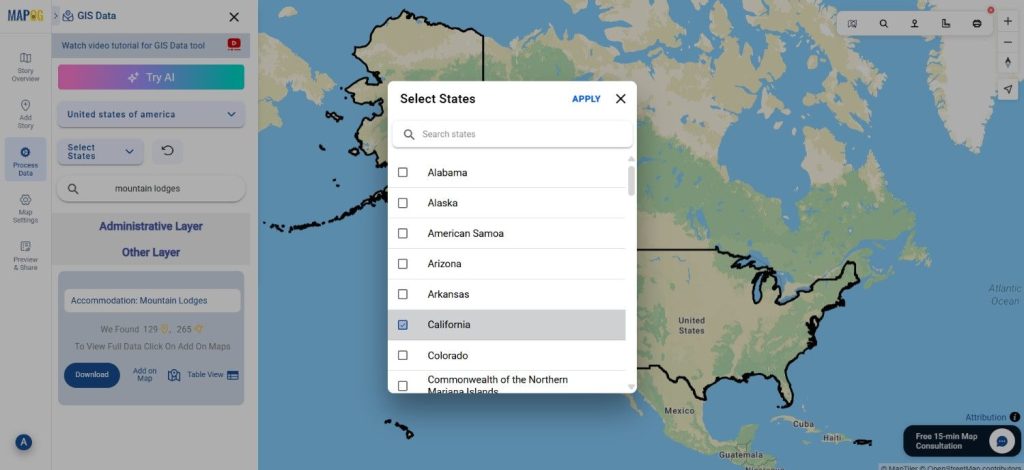
Step 3: Apply Smart Data Filters

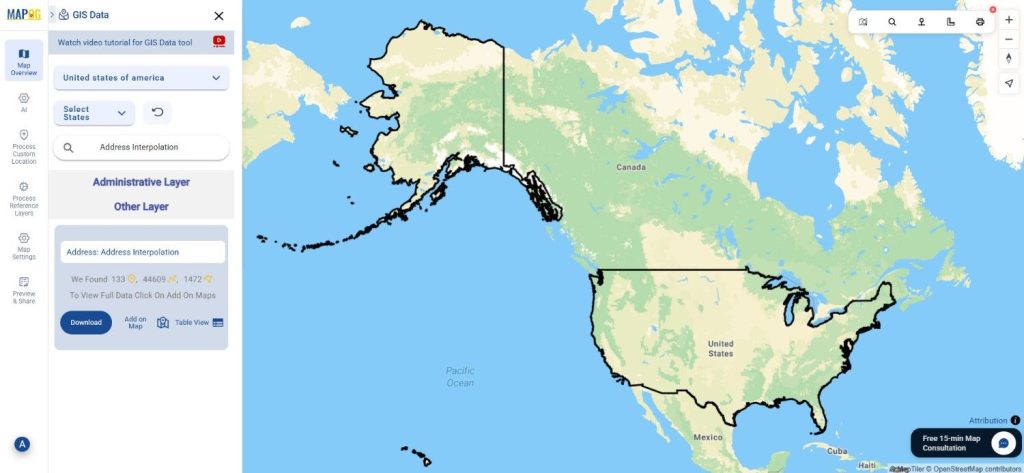
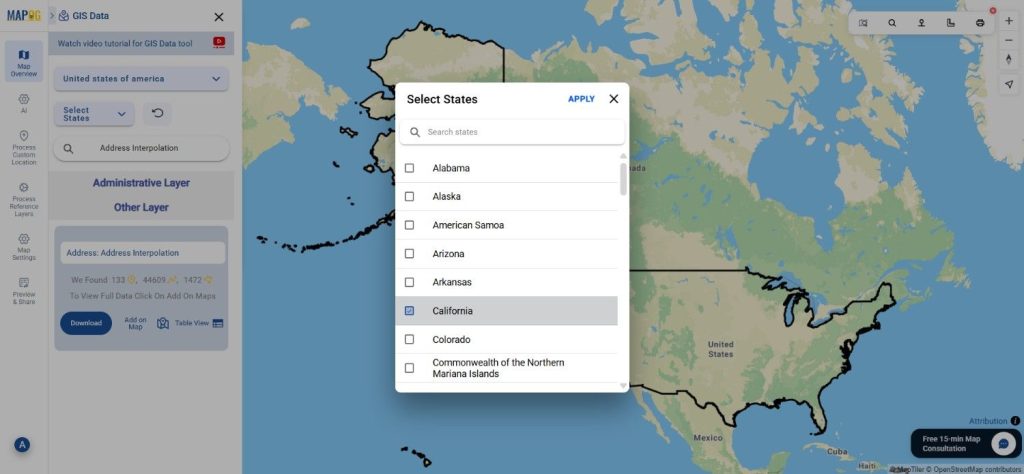
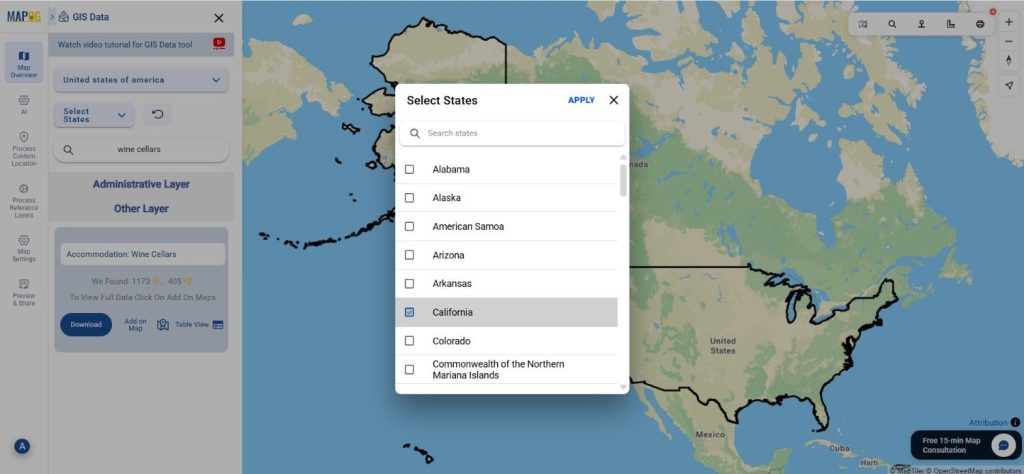
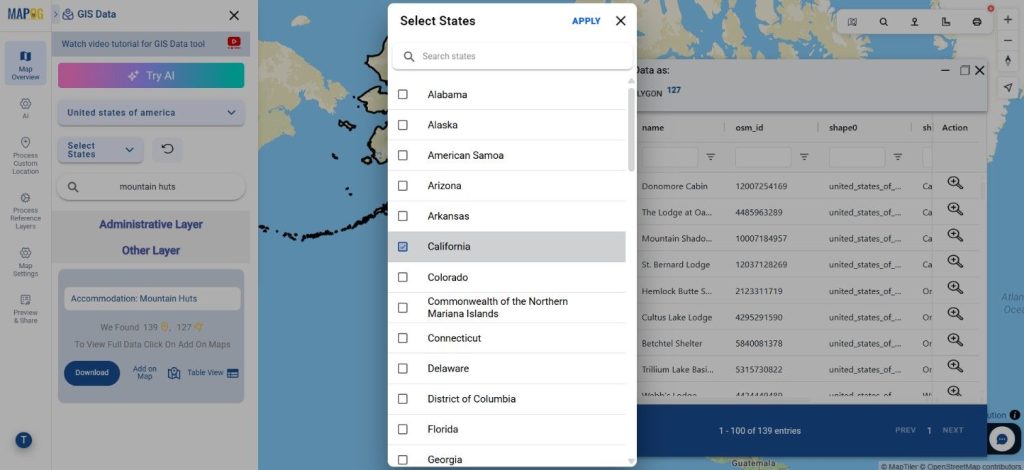
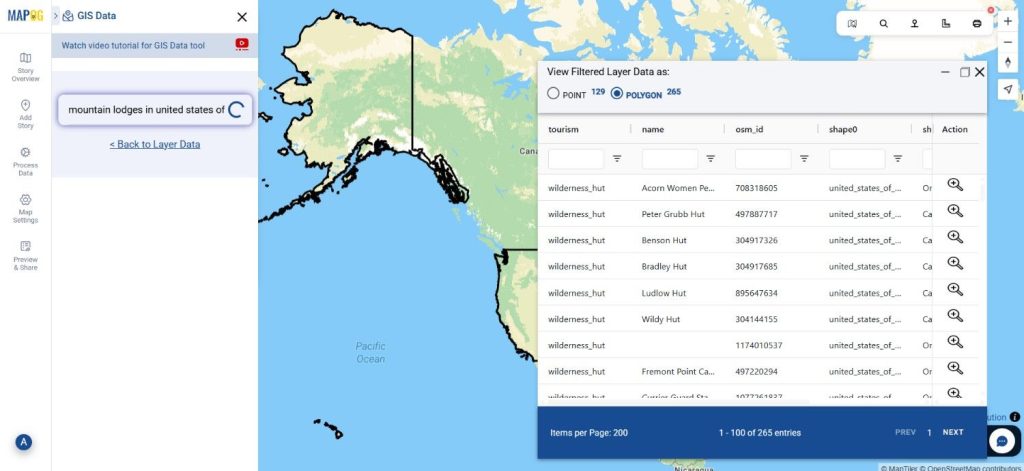
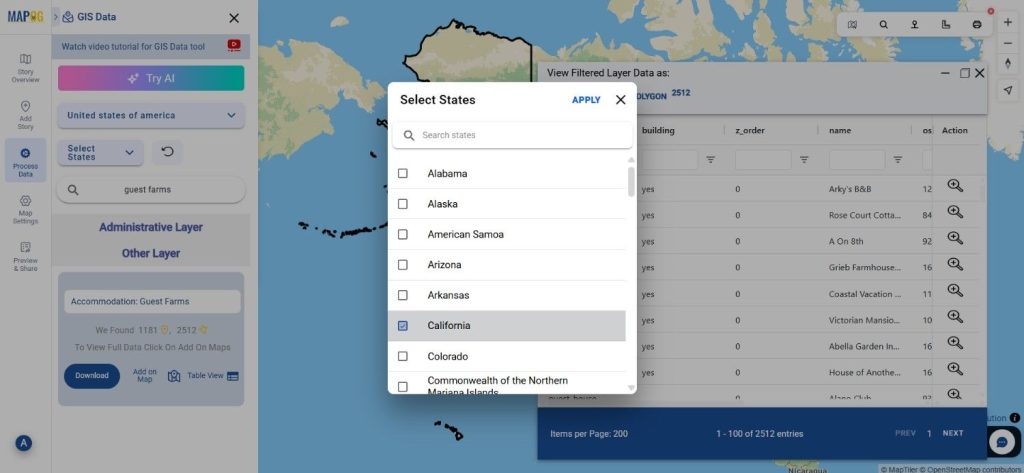
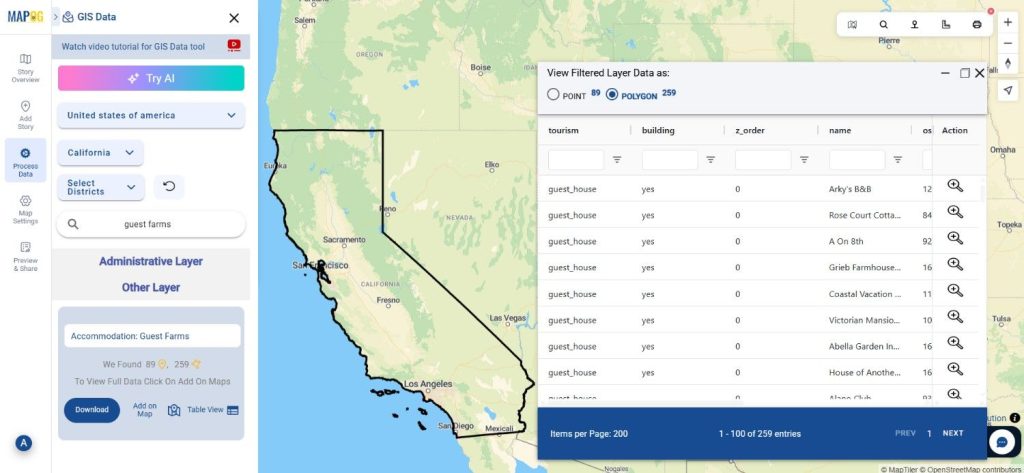
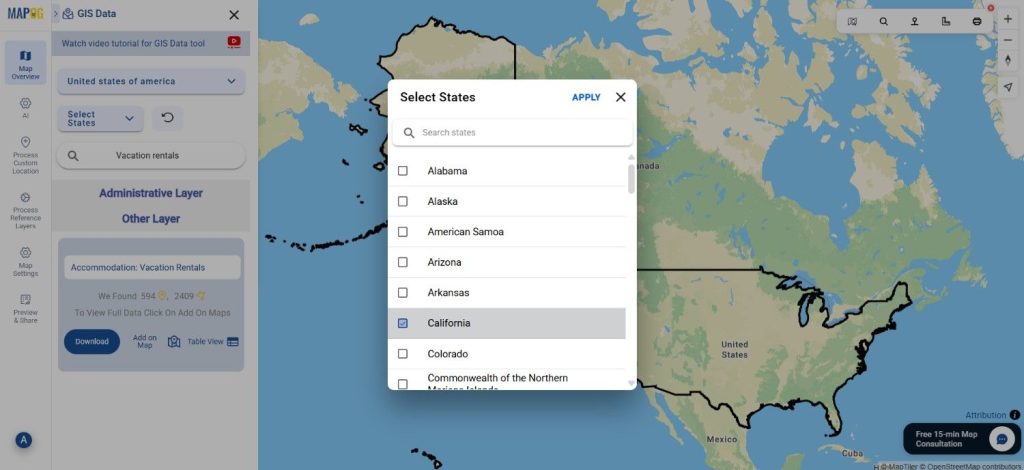
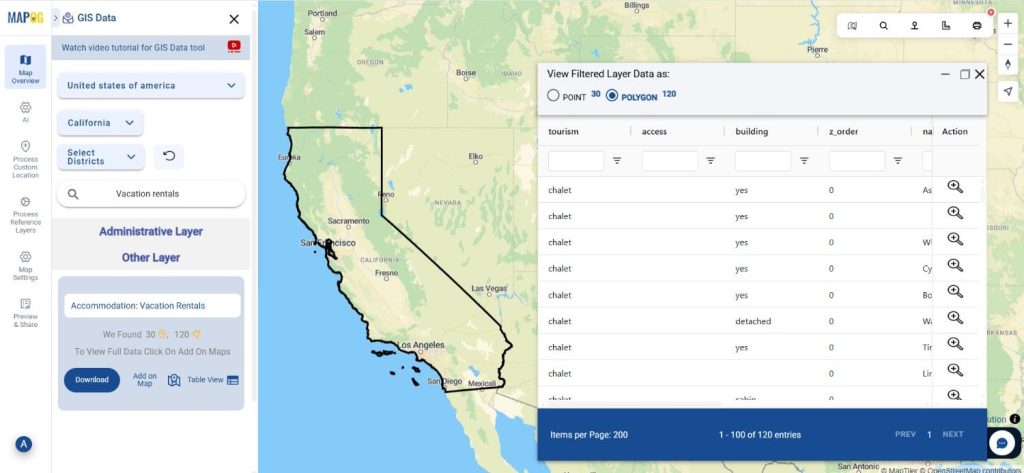
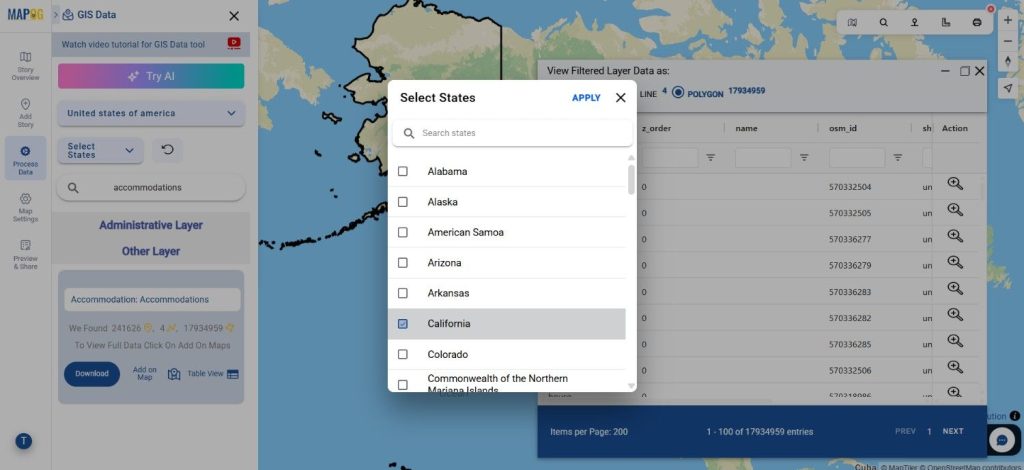
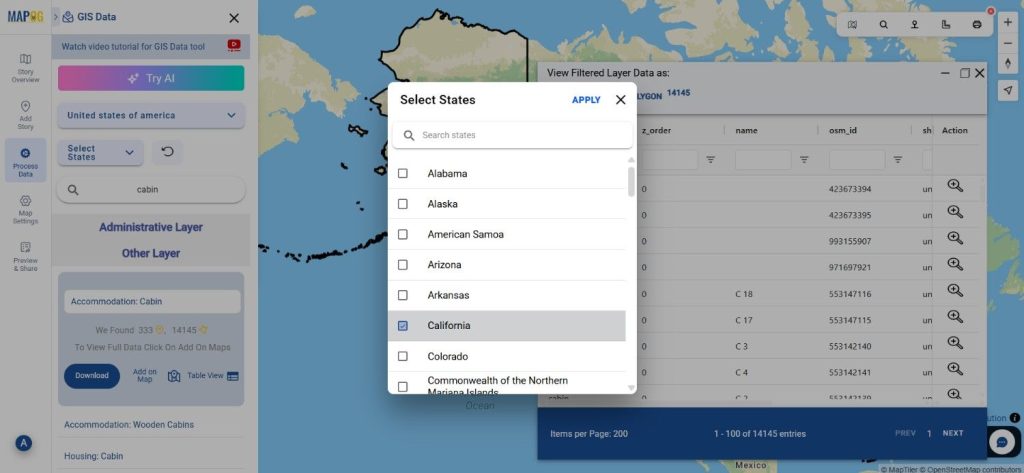
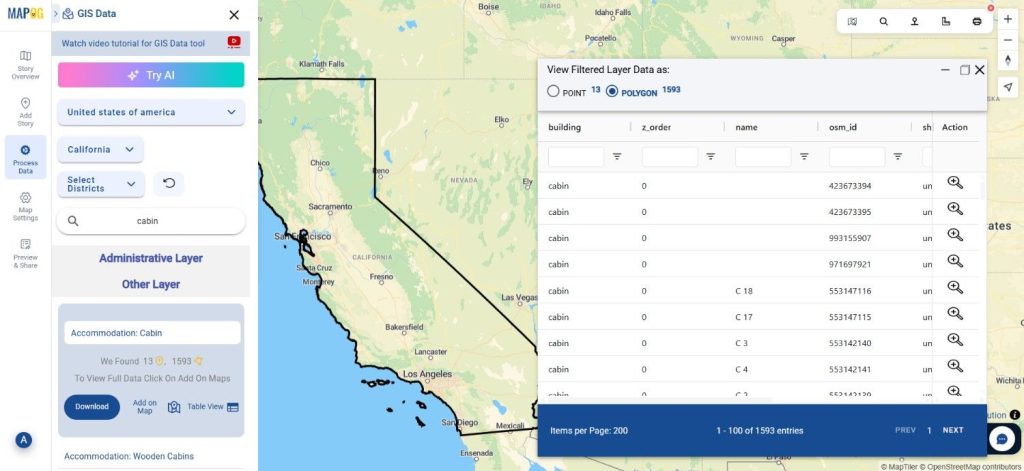
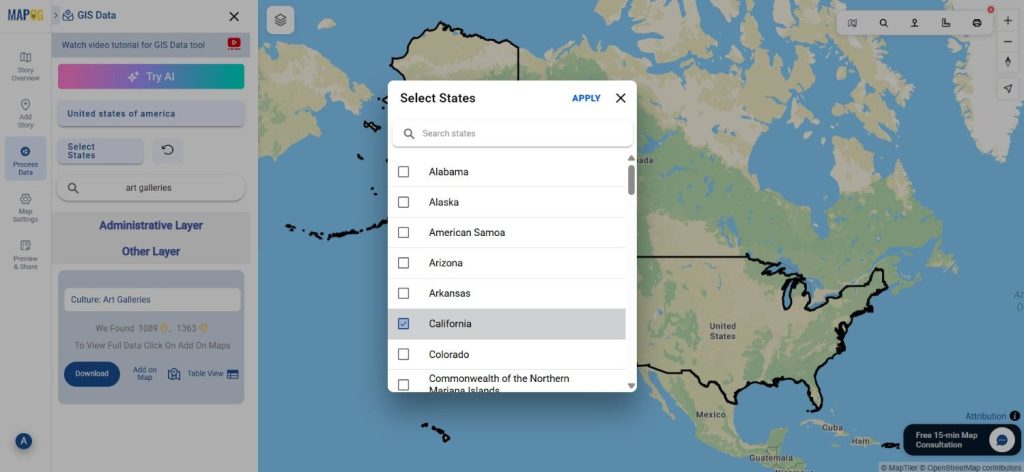
Narrow down your results with the Filter Data option. Here, you can select specific states or districts to tailor your dataset for regional mapping. When working with larger country-wide data, this helps focus on precise agricultural zones without overloading your GIS environment.

Download Fruit Orchards Data
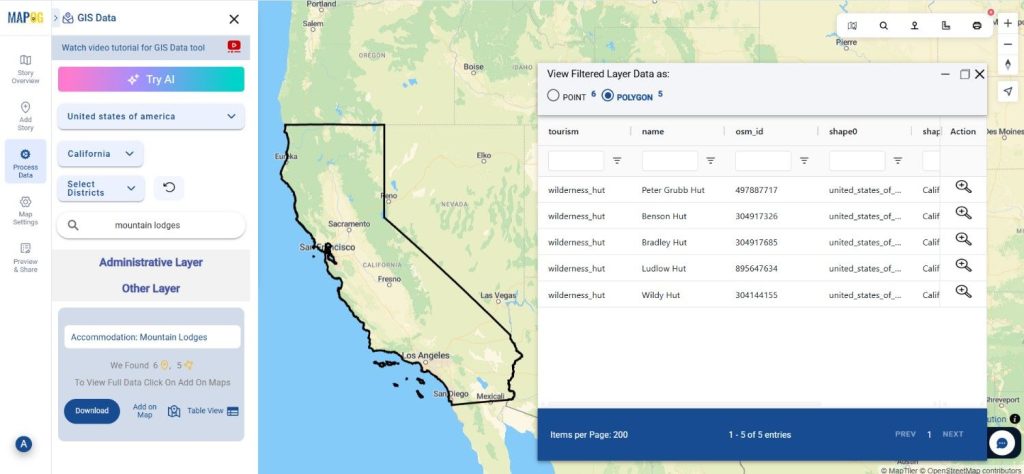
Step 4: Visualize with ‘Add on Map’

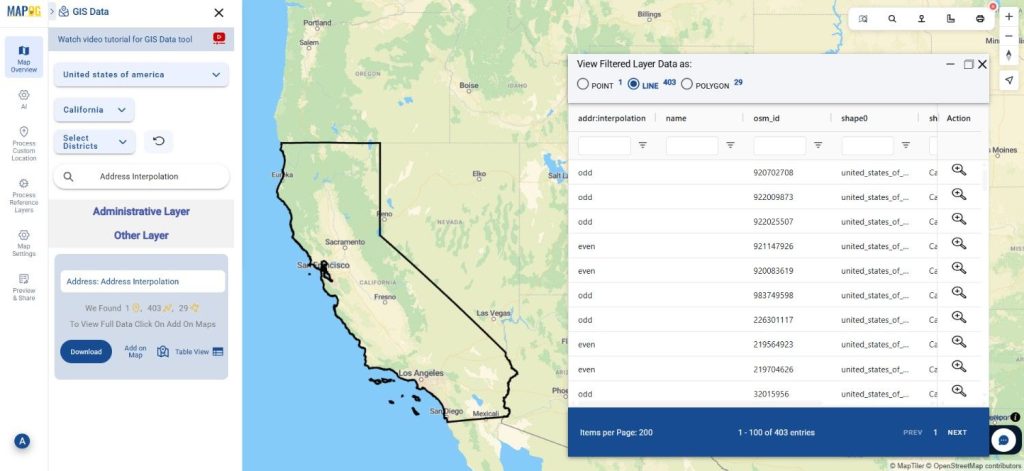
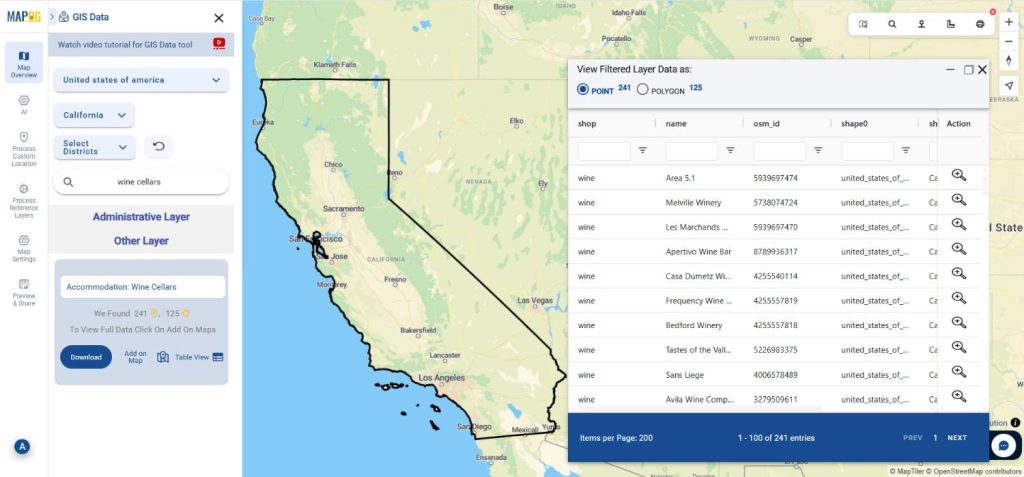
Activate the Add on Map feature to overlay orchard layers directly onto MAPOG’s interactive GIS interface. This visualization helps in spotting distribution trends, comparing land use areas, and planning agricultural or environmental strategies.

Download Fruit Orchards Data
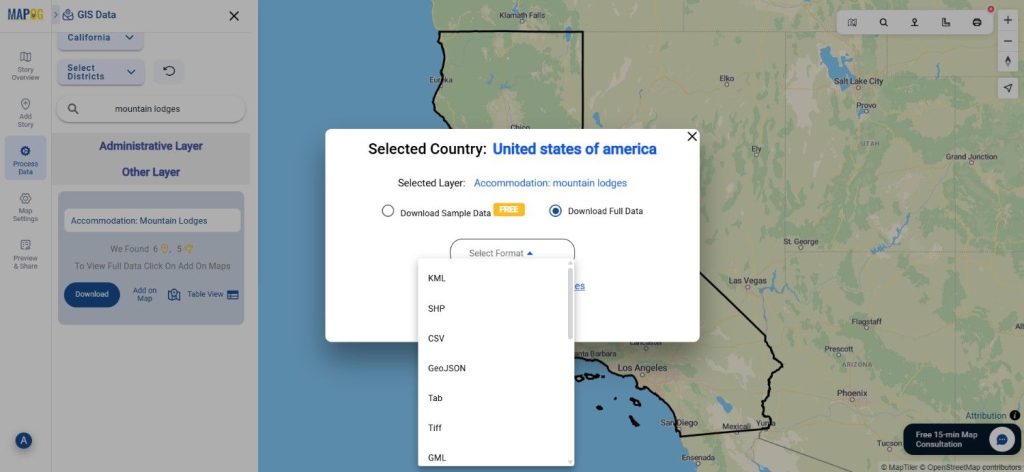
Step 5: Download Fruit Orchards Data

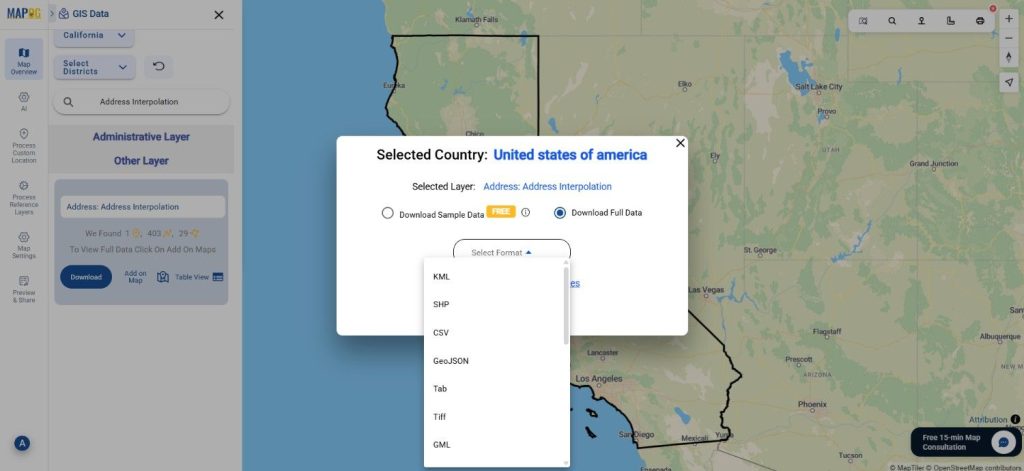
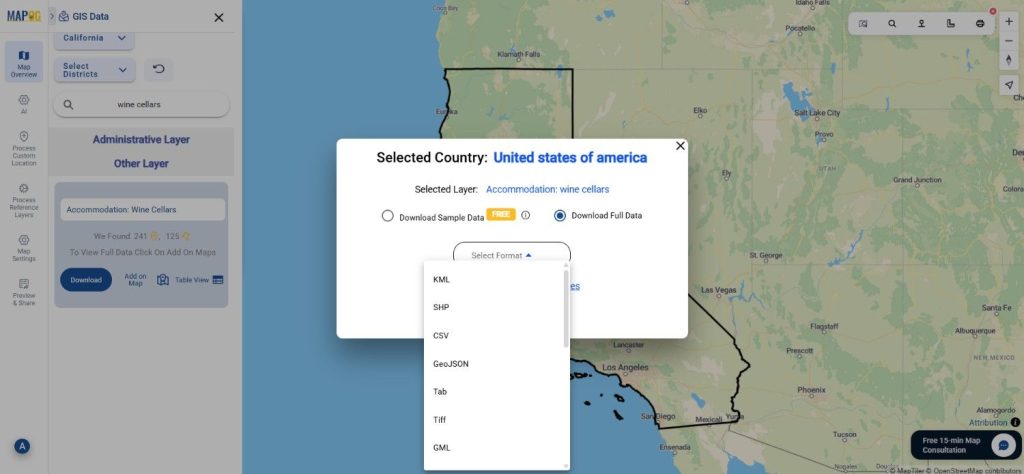
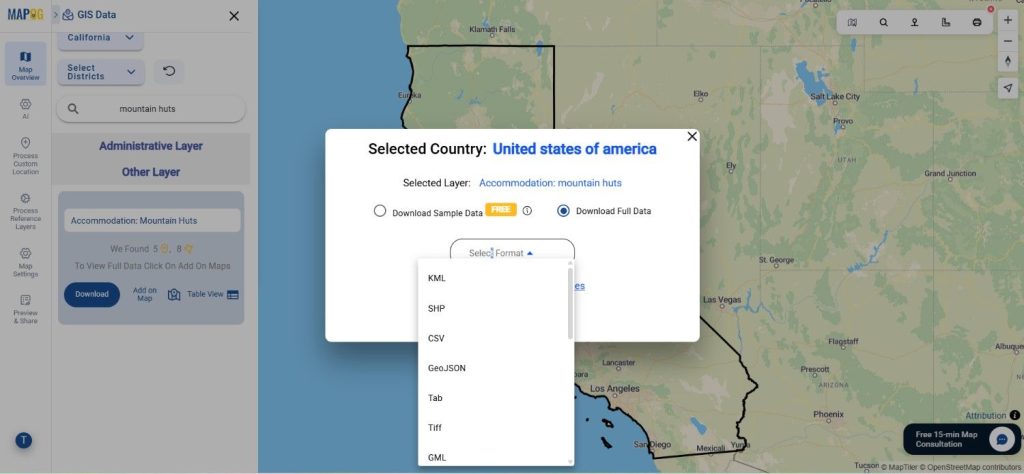
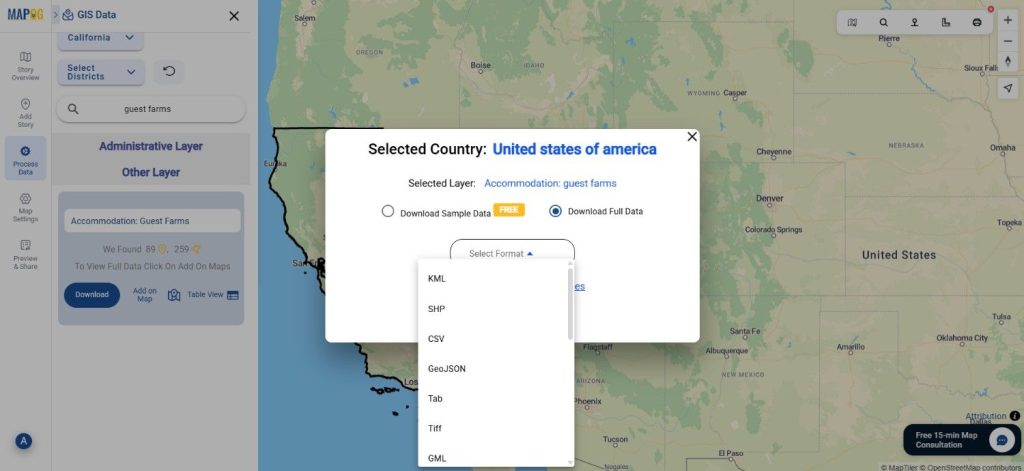
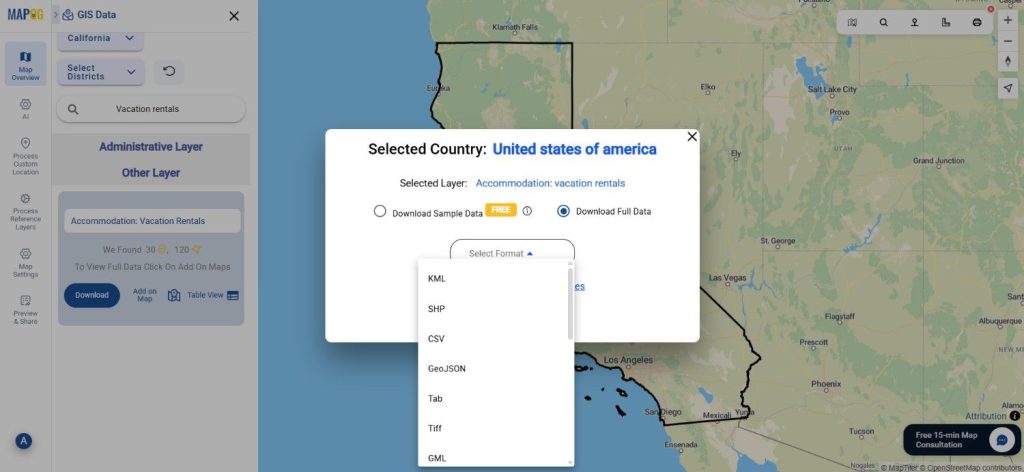
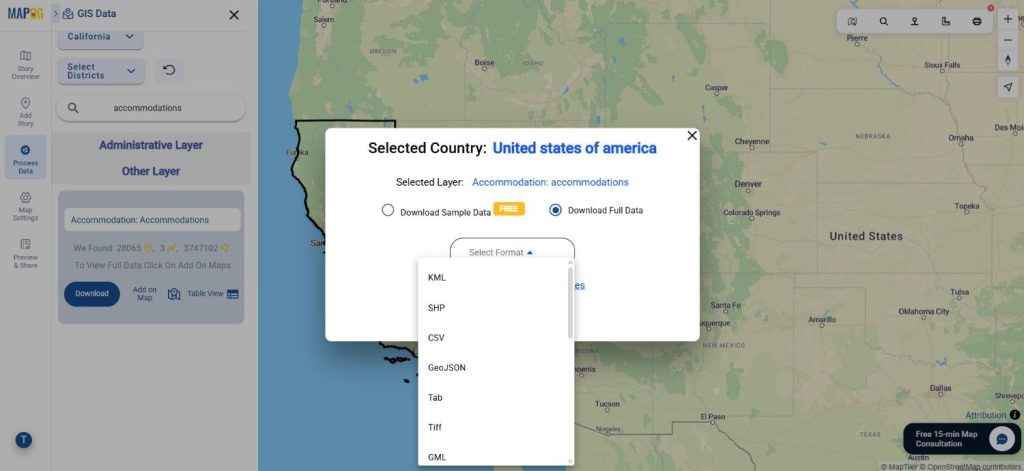
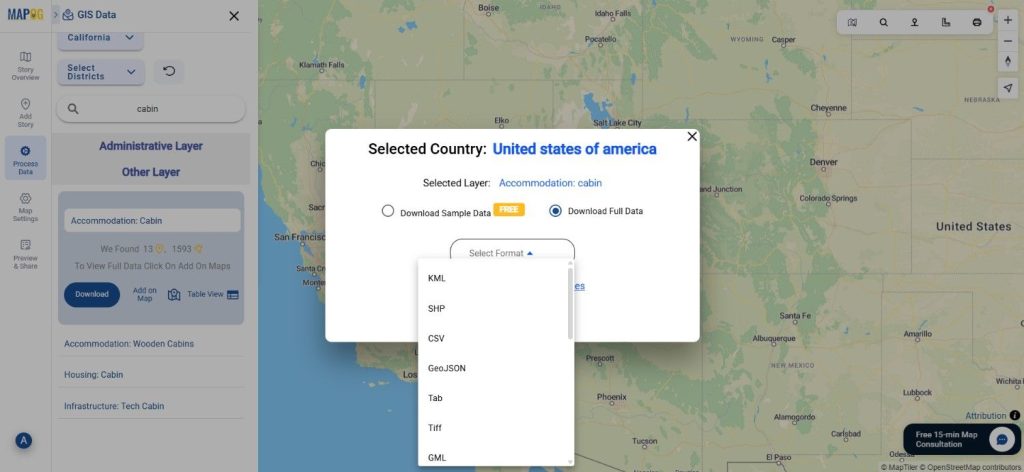
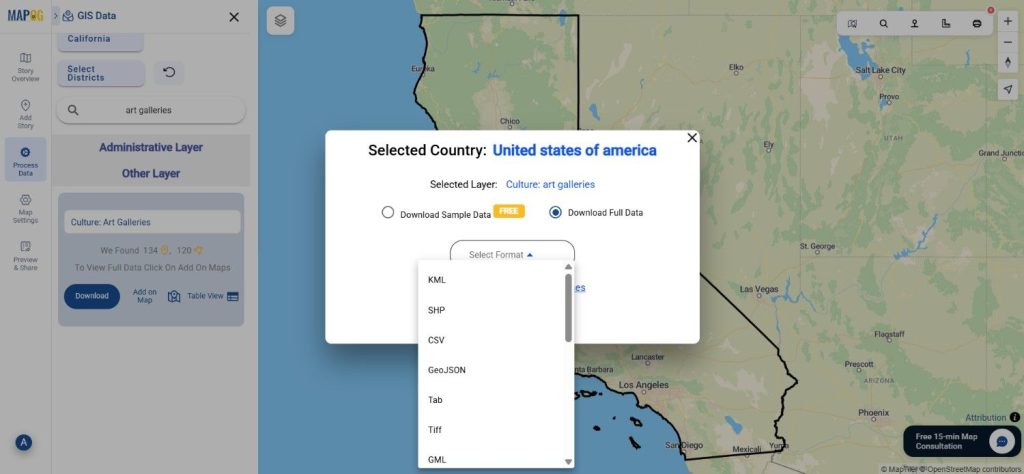
After finalizing your selection, click “Download Data.” You’ll have the option to download a sample or the complete dataset. Choose your desired format—whether it’s Shapefile, KML, GeoJSON, MID, or others—agree to the terms, and initiate the download.

Download Fruit Orchards Data

Final Thoughts

Thanks to MAPOG’s intuitive design and wide format support, the ability to download fruit orchards data is no longer a complex task. Whether you’re conducting agricultural research, land use planning, or environmental monitoring, this platform equips you with reliable and customizable data. Take full advantage of its tools to filter, visualize, and download fruit orchards data in formats best suited for your GIS project goals.

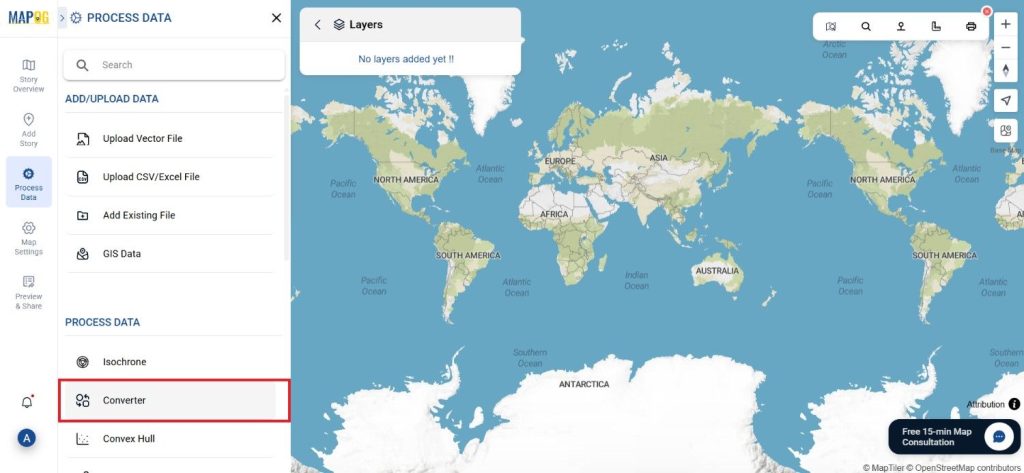
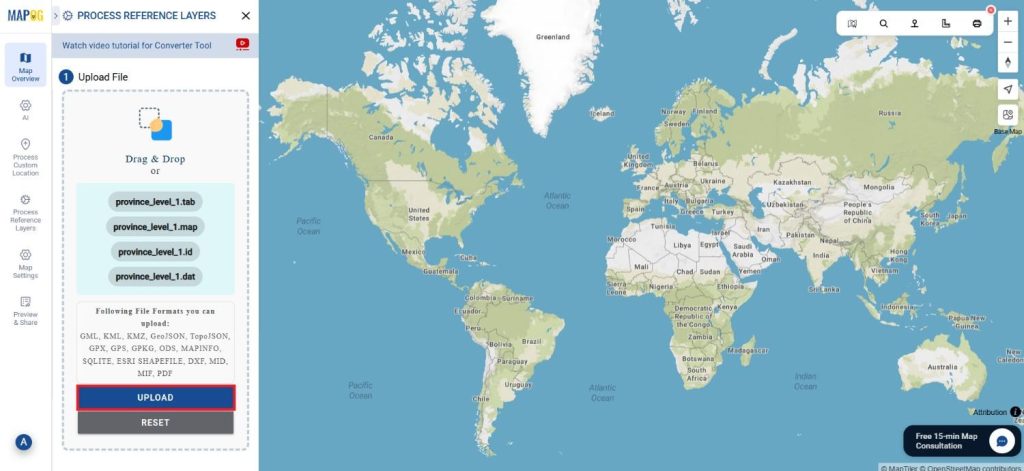
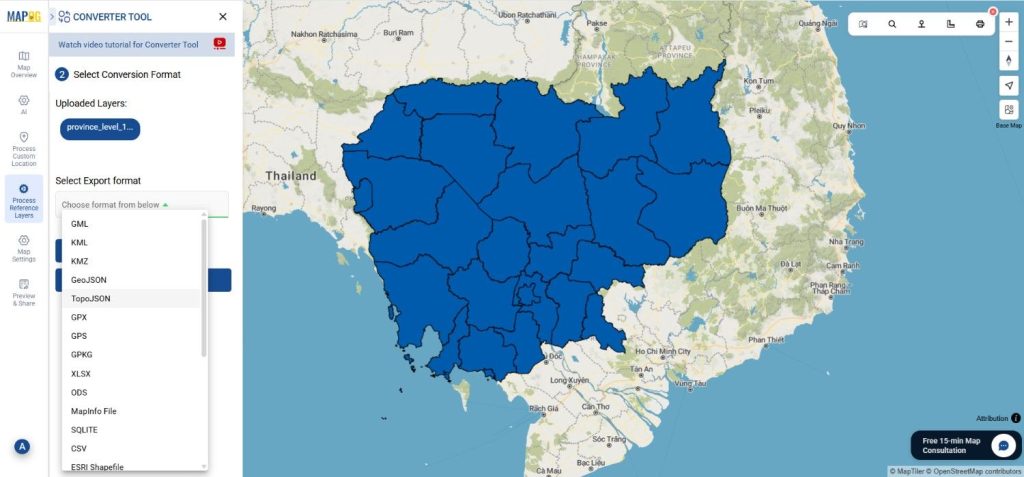
With MAPOG’s versatile toolkit, you can effortlessly upload vector and upload Excel or CSV data, incorporate existing layers, perform polyline splitting, use the converter for various formats, calculate isochrones, and utilize the Export Tool.

For any questions or further assistance, feel free to reach out to us at support@mapog.com. We’re here to help you make the most of your GIS data.

Download Shapefile for the following:

  1. World Countries Shapefile
  2. Australia
  3. Argentina
  4. Austria
  5. Belgium
  6. Brazil
  7. Canada
  8. Denmark
  9. Fiji
  10. Finland
  11. Germany
  12. Greece
  13. India
  14. Indonesia
  15. Ireland
  16. Italy
  17. Japan
  18. Kenya
  19. Lebanon
  20. Madagascar
  21. Malaysia
  22. Mexico
  23. Mongolia
  24. Netherlands
  25. New Zealand
  26. Nigeria
  27. Papua New Guinea
  28. Philippines
  29. Poland
  30. Russia
  31. Singapore
  32. South Africa
  33. South Korea
  34. Spain
  35. Switzerland
  36. Tunisia
  37. United Kingdom Shapefile
  38. United States of America
  39. Vietnam
  40. Croatia
  41. Chile
  42. Norway
  43. Maldives
  44. Bhutan
  45. Colombia
  46. Libya
  47. Comoros
  48. Hungary
  49. Laos
  50. Estonia
  51. Iraq
  52. Portugal
  53. Azerbaijan
  54. Macedonia
  55. Romania
  56. Peru
  57. Marshall Islands
  58. Slovenia
  59. Nauru
  60. Guatemala
  61. El Salvador
  62. Afghanistan
  63. Cyprus
  64. Syria
  65. Slovakia
  66. Luxembourg
  67. Jordan
  68. Armenia
  69. Haiti And Dominican Republic
  70. Malta
  71. Djibouti
  72. East Timor
  73. Micronesia
  74. Morocco
  75. Liberia
  76. Kosovo
  77. Isle Of Man
  78. Paraguay
  79. Tokelau
  80. Palau
  81. Ile De Clipperton
  82. Mauritius
  83. Equatorial Guinea
  84. Tonga
  85. Myanmar
  86. Thailand
  87. New Caledonia
  88. Niger
  89. Nicaragua
  90. Pakistan
  91. Nepal
  92. Seychelles
  93. Democratic Republic of the Congo
  94. China
  95. Kenya
  96. Kyrgyzstan
  97. Bosnia Herzegovina
  98. Burkina Faso
  99. Canary Island
  100. Togo
  101. Israel And Palestine
  102. Algeria
  103. Suriname
  104. Angola
  105. Cape Verde
  106. Liechtenstein
  107. Taiwan
  108. Turkmenistan
  109. Tuvalu
  110. Ivory Coast
  111. Moldova
  112. Somalia
  113. Belize
  114. Swaziland
  115. Solomon Islands
  116. North Korea
  117. Sao Tome And Principe
  118. Guyana
  119. Serbia
  120. Senegal And Gambia
  121. Faroe Islands
  122. Guernsey Jersey
  123. Monaco
  124. Tajikistan
  125. Pitcairn

Disclaimer : The GIS data provided for download in this article was initially sourced from OpenStreetMap (OSM) and further modified to enhance its usability. Please note that the original data is licensed under the Open Database License (ODbL) by the OpenStreetMap contributors. While modifications have been made to improve the data, any use, redistribution, or modification of this data must comply with the ODbL license terms. For more information on the ODbL, please visit OpenStreetMap’s License Page.

Here are some blogs you might be interested in:

Download Garage Location Data in GIS Formats (Shapefile, KML, GeoJSON & More)

Need detailed and structured garage location information for your next project? Download Garage Data effortlessly with GIS Data by MAPOG—a powerful, easy-to-navigate platform that supports over 15 GIS formats including Shapefile, KML, GeoJSON, MID, and more. Whether you’re working on transportation planning, urban infrastructure development, or spatial accessibility studies, MAPOG equips you with up-to-date, ready-to-analyze garage datasets compatible with all major GIS tools.

Understanding Garage Data and the MAPOG Advantage

Garage data typically includes the geographic locations of public and private vehicle garages, their capacities, and types—valuable information for city planners, researchers, and logistics professionals. GIS Data by MAPOG simplifies the retrieval process by providing access to garage datasets across diverse layers with advanced tools for filtering, visualization, and export.

Download Garage Data of any countries

Note:
  • All data is provided in GCS datum EPSG:4326 WGS84 CRS (Coordinate Reference System).
  • Users need to log in to access and download their preferred data formats.

Step-by-Step Guide to Download Garage Data

Step 1: Search for Garage Data

Start by typing “Garage Data” in the search bar after selecting your desired region. Use the layer details to check if the data includes points or polygons, and review the attribute table for more context.

Download Garage Data
Step 2: Use AI Search Tool for Faster Access

Take advantage of the “Try AI” feature. Simply enter a phrase like “Garages in central area” and let the AI fetch relevant datasets instantly. This smart tool streamlines data discovery and enhances accuracy.

Download Garage Data
Step 3: Filter Data by Region

Drill down using the Filter Data option. This feature allows you to narrow the dataset by state and district, making it easy to identify and download data tailored to your specific geographic focus.

Download Garage Data
Step 4: Visualize with “Add on Map”

With “Add on Map,” the selected garage dataset can be instantly overlaid on the interactive GIS interface. This function is particularly useful for visual analysis, route optimization, or capacity planning, as it brings clarity to spatial relationships.

Download Garage Data
Step 5: Download Garage Data

After reviewing the dataset and finalizing your selection, hit the “Download Data” button. Choose between a preview or full download, pick your desired file format (such as Shapefile, KML, MID, etc.), accept the terms, and proceed to download.

Download Garage Data

Conclusion

From visualization to format flexibility, MAPOG makes the entire process to Download Garage Data fast, accurate, and accessible. Whether you’re a GIS professional, transport analyst, or urban planner, this platform gives you the tools and data you need to make informed, spatially-aware decisions. With just a few clicks, your next garage-related GIS analysis is ready to begin.

With MAPOG’s versatile toolkit, you can effortlessly upload vector and upload Excel or CSV data, incorporate existing layers, perform polyline splitting, use the converter for various formats, calculate isochrones, and utilize the Export Tool.

For any questions or further assistance, feel free to reach out to us at support@mapog.com. We’re here to help you make the most of your GIS data.

Download Shapefile for the following:

  1. World Countries Shapefile
  2. Australia
  3. Argentina
  4. Austria
  5. Belgium
  6. Brazil
  7. Canada
  8. Denmark
  9. Fiji
  10. Finland
  11. Germany
  12. Greece
  13. India
  14. Indonesia
  15. Ireland
  16. Italy
  17. Japan
  18. Kenya
  19. Lebanon
  20. Madagascar
  21. Malaysia
  22. Mexico
  23. Mongolia
  24. Netherlands
  25. New Zealand
  26. Nigeria
  27. Papua New Guinea
  28. Philippines
  29. Poland
  30. Russia
  31. Singapore
  32. South Africa
  33. South Korea
  34. Spain
  35. Switzerland
  36. Tunisia
  37. United Kingdom Shapefile
  38. United States of America
  39. Vietnam
  40. Croatia
  41. Chile
  42. Norway
  43. Maldives
  44. Bhutan
  45. Colombia
  46. Libya
  47. Comoros
  48. Hungary
  49. Laos
  50. Estonia
  51. Iraq
  52. Portugal
  53. Azerbaijan
  54. Macedonia
  55. Romania
  56. Peru
  57. Marshall Islands
  58. Slovenia
  59. Nauru
  60. Guatemala
  61. El Salvador
  62. Afghanistan
  63. Cyprus
  64. Syria
  65. Slovakia
  66. Luxembourg
  67. Jordan
  68. Armenia
  69. Haiti And Dominican Republic
  70. Malta
  71. Djibouti
  72. East Timor
  73. Micronesia
  74. Morocco
  75. Liberia
  76. Kosovo
  77. Isle Of Man
  78. Paraguay
  79. Tokelau
  80. Palau
  81. Ile De Clipperton
  82. Mauritius
  83. Equatorial Guinea
  84. Tonga
  85. Myanmar
  86. Thailand
  87. New Caledonia
  88. Niger
  89. Nicaragua
  90. Pakistan
  91. Nepal
  92. Seychelles
  93. Democratic Republic of the Congo
  94. China
  95. Kenya
  96. Kyrgyzstan
  97. Bosnia Herzegovina
  98. Burkina Faso
  99. Canary Island
  100. Togo
  101. Israel And Palestine
  102. Algeria
  103. Suriname
  104. Angola
  105. Cape Verde
  106. Liechtenstein
  107. Taiwan
  108. Turkmenistan
  109. Tuvalu
  110. Ivory Coast
  111. Moldova
  112. Somalia
  113. Belize
  114. Swaziland
  115. Solomon Islands
  116. North Korea
  117. Sao Tome And Principe
  118. Guyana
  119. Serbia
  120. Senegal And Gambia
  121. Faroe Islands
  122. Guernsey Jersey
  123. Monaco
  124. Tajikistan
  125. Pitcairn

Disclaimer : The GIS data provided for download in this article was initially sourced from OpenStreetMap (OSM) and further modified to enhance its usability. Please note that the original data is licensed under the Open Database License (ODbL) by the OpenStreetMap contributors. While modifications have been made to improve the data, any use, redistribution, or modification of this data must comply with the ODbL license terms. For more information on the ODbL, please visit OpenStreetMap’s License Page.

Here are some blogs you might be interested in:

Download Farmyard Data in Shapefile, KML, MID of any country

Looking to map and analyze rural agricultural zones? Download Farmyard Data easily with GIS Data by MAPOG—an intuitive platform built for all levels of GIS users. Farmyards, which typically include clusters of barns, livestock shelters, machinery sheds, and storage areas, are vital components in rural planning, livestock management, and food production analysis. Whether you’re a researcher, policy planner, or agri-tech developer, MAPOG enables you to obtain structured farmyard data across multiple GIS formats like Shapefile, KML, GeoJSON, and MID for seamless use in professional mapping tools.

How to Download Farmyard Data

GIS Data by MAPOG simplifies the entire data retrieval process. From a wide collection of over 900+ categorized layers, users can easily locate and Download Farmyard Data from various regions. The platform supports 15+ GIS formats including CSV, SQL, DXF, MIF, TOPOJSON, GPX, and more, making it ideal for multi-purpose usage in agriculture, land-use planning, and environmental assessments.

Download Farmyard Data of any countries

Note:
  • All data is provided in GCS datum EPSG:4326 WGS84 CRS (Coordinate Reference System).
  • Users need to log in to access and download their preferred data formats.

Step-by-Step Guide to Download Farmyard Data

Step 1: Search for Farmyard Data

Begin by opening the GIS Data by MAPOG platform and using the search layer bar. Type “Farmyard Data” and browse through the layers provided. Review metadata to confirm if the features are represented as point, line, or polygon geometries.

Download Farmyard Data
Step 2: Try the AI Search Tool

Save time with MAPOG’s smart “Try AI” tool. Enter a phrase like “Farmyards near district” and let the AI deliver the most accurate datasets available for your region of interest.

Download Farmyard Data
Step 3: Apply State and District Filters

Use the Filter Data option to focus your search. Narrow down datasets by specific states or districts to ensure you’re downloading the most relevant farmyard data for local-scale analysis. This is especially useful when dealing with country-level layers where local filtering becomes essential.

Download Farmyard Data
Step 4: Add on Map for Analysis

Click on the “Add on Map” button to visualize your selected farmyard dataset directly on MAPOG’s map interface. This interactive step is perfect for analyzing proximity, spatial distribution, and accessibility of farmyards in relation to roads, water sources, or settlements.

Download Farmyard Data
Step 5: Download Farmyard Data

Once you’re confident in your selection, proceed to download. Choose between a free sample or the complete dataset. Then, pick your preferred format—Shapefile, KML, MID, or any of the supported formats—accept the terms, and hit download.

Download Farmyard Data

Conclusion

With its simplified workflow and robust format support, GIS Data by MAPOG makes it incredibly efficient to Download Farmyard Data for diverse GIS applications. Whether you’re building an agri-map, conducting a land-use study, or integrating rural data into a GIS dashboard, MAPOG equips you with the tools and datasets needed for in-depth spatial analysis and smarter decision-making.

With MAPOG’s versatile toolkit, you can effortlessly upload vector and upload Excel or CSV data, incorporate existing layers, perform polyline splitting, use the converter for various formats, calculate isochrones, and utilize the Export Tool.

For any questions or further assistance, feel free to reach out to us at support@mapog.com. We’re here to help you make the most of your GIS data.

Download Shapefile for the following:

  1. World Countries Shapefile
  2. Australia
  3. Argentina
  4. Austria
  5. Belgium
  6. Brazil
  7. Canada
  8. Denmark
  9. Fiji
  10. Finland
  11. Germany
  12. Greece
  13. India
  14. Indonesia
  15. Ireland
  16. Italy
  17. Japan
  18. Kenya
  19. Lebanon
  20. Madagascar
  21. Malaysia
  22. Mexico
  23. Mongolia
  24. Netherlands
  25. New Zealand
  26. Nigeria
  27. Papua New Guinea
  28. Philippines
  29. Poland
  30. Russia
  31. Singapore
  32. South Africa
  33. South Korea
  34. Spain
  35. Switzerland
  36. Tunisia
  37. United Kingdom Shapefile
  38. United States of America
  39. Vietnam
  40. Croatia
  41. Chile
  42. Norway
  43. Maldives
  44. Bhutan
  45. Colombia
  46. Libya
  47. Comoros
  48. Hungary
  49. Laos
  50. Estonia
  51. Iraq
  52. Portugal
  53. Azerbaijan
  54. Macedonia
  55. Romania
  56. Peru
  57. Marshall Islands
  58. Slovenia
  59. Nauru
  60. Guatemala
  61. El Salvador
  62. Afghanistan
  63. Cyprus
  64. Syria
  65. Slovakia
  66. Luxembourg
  67. Jordan
  68. Armenia
  69. Haiti And Dominican Republic
  70. Malta
  71. Djibouti
  72. East Timor
  73. Micronesia
  74. Morocco
  75. Liberia
  76. Kosovo
  77. Isle Of Man
  78. Paraguay
  79. Tokelau
  80. Palau
  81. Ile De Clipperton
  82. Mauritius
  83. Equatorial Guinea
  84. Tonga
  85. Myanmar
  86. Thailand
  87. New Caledonia
  88. Niger
  89. Nicaragua
  90. Pakistan
  91. Nepal
  92. Seychelles
  93. Democratic Republic of the Congo
  94. China
  95. Kenya
  96. Kyrgyzstan
  97. Bosnia Herzegovina
  98. Burkina Faso
  99. Canary Island
  100. Togo
  101. Israel And Palestine
  102. Algeria
  103. Suriname
  104. Angola
  105. Cape Verde
  106. Liechtenstein
  107. Taiwan
  108. Turkmenistan
  109. Tuvalu
  110. Ivory Coast
  111. Moldova
  112. Somalia
  113. Belize
  114. Swaziland
  115. Solomon Islands
  116. North Korea
  117. Sao Tome And Principe
  118. Guyana
  119. Serbia
  120. Senegal And Gambia
  121. Faroe Islands
  122. Guernsey Jersey
  123. Monaco
  124. Tajikistan
  125. Pitcairn

Disclaimer : The GIS data provided for download in this article was initially sourced from OpenStreetMap (OSM) and further modified to enhance its usability. Please note that the original data is licensed under the Open Database License (ODbL) by the OpenStreetMap contributors. While modifications have been made to improve the data, any use, redistribution, or modification of this data must comply with the ODbL license terms. For more information on the ODbL, please visit OpenStreetMap’s License Page.

Here are some blogs you might be interested in:

Download Quarry Data in Shapefile, KML, MID +15 GIS Formats

Looking to Download Quarry Data for your next GIS project? GIS Data by MAPOG makes it seamless to access detailed and structured quarry location datasets. Quarries—sites where stone, rock, sand, or minerals are extracted from the surface—play a crucial role in construction, mining, and resource management. With MAPOG’s intuitive interface, users can effortlessly download quarry data in multiple formats such as Shapefile, KML, MID, GeoJSON, and more, ensuring compatibility with a wide range of GIS software and tools.

How Quarry Data Retrieval Works

MAPOG offers an advanced and organized way to explore and download spatial datasets from over 200 countries and 900+ thematic layers. Whether you’re engaged in environmental studies, resource planning, or land use analysis, the platform allows you to Download Quarry Data in 15+ GIS formats, including DXF, SQL, TOPOJSON, CSV, and GPX. All datasets are provided in the globally accepted GCS datum EPSG:4326 (WGS84 CRS), ensuring consistency across applications.

Download Quarry Data of any countries

Note:
  • All data is provided in GCS datum EPSG:4326 WGS84 CRS (Coordinate Reference System).
  • Users need to log in to access and download their preferred data formats.

Step-by-Step Guide to Download Quarry Data

Step 1: Search for Quarry Data

Begin by logging into the GIS Data by MAPOG platform. Use the search bar or browse through categories to find “Quarry Data.” Check whether the data is available in point or polygon formats by reviewing its attributes.

Download Quarry Data
Step 2: Use the AI-Powered Search Tool

The “Try AI” feature helps speed up the data discovery process. Simply type phrases like “Quarries near industrial zones,” and the AI will pull up the most relevant datasets. This smart tool enhances both convenience and accuracy.

Download Quarry Data
Step 3: Apply Data Filters for Precision

Refine your search results using MAPOG’s Filter Data option. You can drill down by selecting specific states and districts, making it easier to locate quarry data in targeted areas. This is especially useful when working on regional or site-specific projects.

Download Quarry Data
Step 4: Visualize with “Add on Map”

The “Add on Map” feature allows you to overlay selected layers directly on the map interface. This interactive visualization supports advanced spatial analysis, helping you understand quarry distribution, proximity to other features, and land usage.

Download Quarry Data
Step 5: Download Quarry Data in Desired Format

Once your dataset is finalized, proceed to the download section. Choose whether you want a sample or complete dataset. Then, select your desired format—be it SHP, KML, MID, GeoJSON, or another. After agreeing to the terms, simply click download, and your data will be ready to use.

Download Quarry Data

Final Thoughts

With its powerful tools and user-friendly features, GIS Data by MAPOG makes it incredibly simple to download Quarry Data for professional or academic use. From smart filtering and AI search to multi-format support and map visualization, every step is designed to enhance your GIS workflow. Whether you’re a planner, researcher, or environmental analyst, this platform equips you with the spatial insights needed for informed decisions.

With MAPOG’s versatile toolkit, you can effortlessly upload vector and upload Excel or CSV data, incorporate existing layers, perform polyline splitting, use the converter for various formats, calculate isochrones, and utilize the Export Tool.

For any questions or further assistance, feel free to reach out to us at support@mapog.com. We’re here to help you make the most of your GIS data.

Download Shapefile for the following:

  1. World Countries Shapefile
  2. Australia
  3. Argentina
  4. Austria
  5. Belgium
  6. Brazil
  7. Canada
  8. Denmark
  9. Fiji
  10. Finland
  11. Germany
  12. Greece
  13. India
  14. Indonesia
  15. Ireland
  16. Italy
  17. Japan
  18. Kenya
  19. Lebanon
  20. Madagascar
  21. Malaysia
  22. Mexico
  23. Mongolia
  24. Netherlands
  25. New Zealand
  26. Nigeria
  27. Papua New Guinea
  28. Philippines
  29. Poland
  30. Russia
  31. Singapore
  32. South Africa
  33. South Korea
  34. Spain
  35. Switzerland
  36. Tunisia
  37. United Kingdom Shapefile
  38. United States of America
  39. Vietnam
  40. Croatia
  41. Chile
  42. Norway
  43. Maldives
  44. Bhutan
  45. Colombia
  46. Libya
  47. Comoros
  48. Hungary
  49. Laos
  50. Estonia
  51. Iraq
  52. Portugal
  53. Azerbaijan
  54. Macedonia
  55. Romania
  56. Peru
  57. Marshall Islands
  58. Slovenia
  59. Nauru
  60. Guatemala
  61. El Salvador
  62. Afghanistan
  63. Cyprus
  64. Syria
  65. Slovakia
  66. Luxembourg
  67. Jordan
  68. Armenia
  69. Haiti And Dominican Republic
  70. Malta
  71. Djibouti
  72. East Timor
  73. Micronesia
  74. Morocco
  75. Liberia
  76. Kosovo
  77. Isle Of Man
  78. Paraguay
  79. Tokelau
  80. Palau
  81. Ile De Clipperton
  82. Mauritius
  83. Equatorial Guinea
  84. Tonga
  85. Myanmar
  86. Thailand
  87. New Caledonia
  88. Niger
  89. Nicaragua
  90. Pakistan
  91. Nepal
  92. Seychelles
  93. Democratic Republic of the Congo
  94. China
  95. Kenya
  96. Kyrgyzstan
  97. Bosnia Herzegovina
  98. Burkina Faso
  99. Canary Island
  100. Togo
  101. Israel And Palestine
  102. Algeria
  103. Suriname
  104. Angola
  105. Cape Verde
  106. Liechtenstein
  107. Taiwan
  108. Turkmenistan
  109. Tuvalu
  110. Ivory Coast
  111. Moldova
  112. Somalia
  113. Belize
  114. Swaziland
  115. Solomon Islands
  116. North Korea
  117. Sao Tome And Principe
  118. Guyana
  119. Serbia
  120. Senegal And Gambia
  121. Faroe Islands
  122. Guernsey Jersey
  123. Monaco
  124. Tajikistan
  125. Pitcairn

Disclaimer : The GIS data provided for download in this article was initially sourced from OpenStreetMap (OSM) and further modified to enhance its usability. Please note that the original data is licensed under the Open Database License (ODbL) by the OpenStreetMap contributors. While modifications have been made to improve the data, any use, redistribution, or modification of this data must comply with the ODbL license terms. For more information on the ODbL, please visit OpenStreetMap’s License Page.

Here are some blogs you might be interested in:

Download Dental Clinics Data in Shapefile, KML, MID & more

Looking for accurate and structured information on dental clinic locations? With GIS Data by MAPOG, you can easily Download Dental Clinics Data in multiple formats, including Shapefile, KML, GeoJSON, and MID, along with 15+ other GIS-supported file types. Whether the purpose is healthcare accessibility analysis, urban planning, or medical research, MAPOG delivers up-to-date, geo-referenced datasets that are ready for seamless mapping and integration into various GIS platforms.

How to Download Dental Clinics Data

MAPOG makes the process simple and efficient, providing access to data from thousands of layers across the globe. With support for formats like KML, SHP, CSV, GeoJSON, SQL, DXF, MIF, TOPOJSON, and GPX, the platform caters to a wide range of GIS users—whether you’re an analyst, researcher, or policymaker.

Download Dental Clinics Data of any countries

Note:
  • All data is provided in GCS datum EPSG:4326 WGS84 CRS (Coordinate Reference System).
  • Users need to log in to access and download their preferred data formats.

Step-by-Step Guide to Download Dental Clinics Data

Step 1: Search for Dental Clinics Data

Begin by entering “Dental Clinics Data” in the search layer function. Review the dataset’s attributes to confirm whether the information is available in point or polygon format.

Download Dental Clinics Data
Step 2: Use the AI Search Tool

Leverage the “Try AI” feature in MAPOG by typing keywords such as “Dental Clinics in area.” The AI will instantly fetch the most relevant datasets, reducing search time and ensuring better precision.

Download Dental Clinics Data
Step 3: Apply Data Filters

For more targeted results, use the Filter Data option to narrow down information by state and district. This feature is particularly useful when analyzing data within a specific region for in-depth planning or research.

Download Dental Clinics Data
Step 4: Visualize with “Add on Map”

Select the “Add on Map” option to overlay your chosen data layer on MAPOG’s interactive GIS interface. This allows you to visualize dental clinic distribution patterns, proximity to communities, and accessibility, aiding in detailed analysis.

Download Dental Clinics Data
Step 5: Download Dental Clinics Data

Once you’ve finalized the dataset, click “Download Data.” Choose between downloading a sample or the complete dataset, select your desired format (Shapefile, KML, GeoJSON, MID, or others), agree to the terms, and proceed with the download.

Download Dental Clinics Data

Final Thoughts

With GIS Data by MAPOG, the process to Download Dental Clinics Data is quick, accurate, and highly customizable. From healthcare planners to GIS professionals, anyone can benefit from these detailed datasets to make informed decisions. By combining precise data with powerful visualization and filtering tools, MAPOG ensures that your mapping and analysis needs are met with efficiency and reliability.

With MAPOG’s versatile toolkit, you can effortlessly upload vector and upload Excel or CSV data, incorporate existing layers, perform Split polygon by line, use the converter for various formats, calculate isochrones, and utilize the Export Tool.

For any questions or further assistance, feel free to reach out to us at support@mapog.com. We’re here to help you make the most of your GIS data.

Download Shapefile for the following:

  1. World Countries Shapefile
  2. Australia
  3. Argentina
  4. Austria
  5. Belgium
  6. Brazil
  7. Canada
  8. Denmark
  9. Fiji
  10. Finland
  11. Germany
  12. Greece
  13. India
  14. Indonesia
  15. Ireland
  16. Italy
  17. Japan
  18. Kenya
  19. Lebanon
  20. Madagascar
  21. Malaysia
  22. Mexico
  23. Mongolia
  24. Netherlands
  25. New Zealand
  26. Nigeria
  27. Papua New Guinea
  28. Philippines
  29. Poland
  30. Russia
  31. Singapore
  32. South Africa
  33. South Korea
  34. Spain
  35. Switzerland
  36. Tunisia
  37. United Kingdom Shapefile
  38. United States of America
  39. Vietnam
  40. Croatia
  41. Chile
  42. Norway
  43. Maldives
  44. Bhutan
  45. Colombia
  46. Libya
  47. Comoros
  48. Hungary
  49. Laos
  50. Estonia
  51. Iraq
  52. Portugal
  53. Azerbaijan
  54. Macedonia
  55. Romania
  56. Peru
  57. Marshall Islands
  58. Slovenia
  59. Nauru
  60. Guatemala
  61. El Salvador
  62. Afghanistan
  63. Cyprus
  64. Syria
  65. Slovakia
  66. Luxembourg
  67. Jordan
  68. Armenia
  69. Haiti And Dominican Republic
  70. Malta
  71. Djibouti
  72. East Timor
  73. Micronesia
  74. Morocco
  75. Liberia
  76. Kosovo
  77. Isle Of Man
  78. Paraguay
  79. Tokelau
  80. Palau
  81. Ile De Clipperton
  82. Mauritius
  83. Equatorial Guinea
  84. Tonga
  85. Myanmar
  86. Thailand
  87. New Caledonia
  88. Niger
  89. Nicaragua
  90. Pakistan
  91. Nepal
  92. Seychelles
  93. Democratic Republic of the Congo
  94. China
  95. Kenya
  96. Kyrgyzstan
  97. Bosnia Herzegovina
  98. Burkina Faso
  99. Canary Island
  100. Togo
  101. Israel And Palestine
  102. Algeria
  103. Suriname
  104. Angola
  105. Cape Verde
  106. Liechtenstein
  107. Taiwan
  108. Turkmenistan
  109. Tuvalu
  110. Ivory Coast
  111. Moldova
  112. Somalia
  113. Belize
  114. Swaziland
  115. Solomon Islands
  116. North Korea
  117. Sao Tome And Principe
  118. Guyana
  119. Serbia
  120. Senegal And Gambia
  121. Faroe Islands
  122. Guernsey Jersey
  123. Monaco
  124. Tajikistan
  125. Pitcairn

Disclaimer : The GIS data provided for download in this article was initially sourced from OpenStreetMap (OSM) and further modified to enhance its usability. Please note that the original data is licensed under the Open Database License (ODbL) by the OpenStreetMap contributors. While modifications have been made to improve the data, any use, redistribution, or modification of this data must comply with the ODbL license terms. For more information on the ODbL, please visit OpenStreetMap’s License Page.

Here are some blogs you might be interested in:

Download Post Office Data in Shapefile, KML, MID and more

Looking for structured post office location data? Download Post Office Data effortlessly using GIS Data by MAPOG. This powerful platform provides multiple GIS formats, including Shapefile, KML, MID, and GeoJSON, ensuring seamless integration with various GIS applications. Whether the data is required for logistics, urban development, or postal network analysis, MAPOG delivers precise and up-to-date geographic datasets for accurate mapping and research.

How to Download Post Office Data

GIS Data by MAPOG streamlines the entire process, offering users access to thousands of geographic datasets in over 900+ layers. The platform supports numerous formats such as SHP, KML, CSV, GeoJSON, SQL, DXF, MIF, TOPOJSON, and GPX, making it a go-to resource for GIS professionals, researchers, and planners.

Download Post Office Data of any countries

Note:
  • All data is provided in GCS datum EPSG:4326 WGS84 CRS (Coordinate Reference System).
  • Users need to log in to access and download their preferred data formats.

Step-by-Step Guide to Download Post Office Data

Step 1: Search for Post Office Data

Begin by selecting the region of interest in GIS Data by MAPOG. Utilize the search function to find “Post Office Data.” Check whether the dataset is available in point or polygon format based on your needs.

Download Post Office Data
Step 2: Utilize the AI Search Tool

For faster and more precise results, use MAPOG’s “Try AI” search feature. Simply enter relevant keywords like “Post Offices in area,” and the AI tool will instantly fetch the most accurate datasets. This enhances efficiency and ensures quick access to relevant data.

Download Post Office Data
Step 3: Apply Data Filters

Narrow down results using the Filter Data option. Users can refine searches based on states and districts, allowing for a more detailed and targeted approach to data collection. If a country-wide dataset is available, filtering at the state and district level enables a deeper understanding of postal distribution.

Download Post Office Data
Step 4: Visualize with ‘Add on Map’

The Add on Map feature provides users with an interactive way to overlay selected datasets onto a GIS interface for analysis. This visualization step is crucial in identifying postal service coverage, accessibility, and spatial patterns before downloading the dataset.

Download Post Office Data
Step 5: Download Post Office Data

Once satisfied with the dataset, proceed to the Download Data option. Choose between a sample dataset or the complete version. Select the required format (Shapefile, KML, MID, or others), accept the terms, and click download. The data will be ready for use in various GIS tools for further analysis.

Download Post Office Data

Final Thoughts

With GIS Data by MAPOG, Downloading Post Office Data has never been more accessible. The platform ensures users can obtain comprehensive datasets in multiple formats, making it an invaluable resource for postal network analysis, logistics, and GIS-based planning. Whether for research, infrastructure management, or service optimization, this tool provides the insights needed for data-driven decision-making.

With MAPOG’s versatile toolkit, you can effortlessly upload vector and upload Excel or CSV data, incorporate existing layers, perform polyline splitting, use the converter for various formats, calculate isochrones, and utilize the Export Tool.

For any questions or further assistance, feel free to reach out to us at support@mapog.com. We’re here to help you make the most of your GIS data.

Download Shapefile for the following:

  1. World Countries Shapefile
  2. Australia
  3. Argentina
  4. Austria
  5. Belgium
  6. Brazil
  7. Canada
  8. Denmark
  9. Fiji
  10. Finland
  11. Germany
  12. Greece
  13. India
  14. Indonesia
  15. Ireland
  16. Italy
  17. Japan
  18. Kenya
  19. Lebanon
  20. Madagascar
  21. Malaysia
  22. Mexico
  23. Mongolia
  24. Netherlands
  25. New Zealand
  26. Nigeria
  27. Papua New Guinea
  28. Philippines
  29. Poland
  30. Russia
  31. Singapore
  32. South Africa
  33. South Korea
  34. Spain
  35. Switzerland
  36. Tunisia
  37. United Kingdom Shapefile
  38. United States of America
  39. Vietnam
  40. Croatia
  41. Chile
  42. Norway
  43. Maldives
  44. Bhutan
  45. Colombia
  46. Libya
  47. Comoros
  48. Hungary
  49. Laos
  50. Estonia
  51. Iraq
  52. Portugal
  53. Azerbaijan
  54. Macedonia
  55. Romania
  56. Peru
  57. Marshall Islands
  58. Slovenia
  59. Nauru
  60. Guatemala
  61. El Salvador
  62. Afghanistan
  63. Cyprus
  64. Syria
  65. Slovakia
  66. Luxembourg
  67. Jordan
  68. Armenia
  69. Haiti And Dominican Republic
  70. Malta
  71. Djibouti
  72. East Timor
  73. Micronesia
  74. Morocco
  75. Liberia
  76. Kosovo
  77. Isle Of Man
  78. Paraguay
  79. Tokelau
  80. Palau
  81. Ile De Clipperton
  82. Mauritius
  83. Equatorial Guinea
  84. Tonga
  85. Myanmar
  86. Thailand
  87. New Caledonia
  88. Niger
  89. Nicaragua
  90. Pakistan
  91. Nepal
  92. Seychelles
  93. Democratic Republic of the Congo
  94. China
  95. Kenya
  96. Kyrgyzstan
  97. Bosnia Herzegovina
  98. Burkina Faso
  99. Canary Island
  100. Togo
  101. Israel And Palestine
  102. Algeria
  103. Suriname
  104. Angola
  105. Cape Verde
  106. Liechtenstein
  107. Taiwan
  108. Turkmenistan
  109. Tuvalu
  110. Ivory Coast
  111. Moldova
  112. Somalia
  113. Belize
  114. Swaziland
  115. Solomon Islands
  116. North Korea
  117. Sao Tome And Principe
  118. Guyana
  119. Serbia
  120. Senegal And Gambia
  121. Faroe Islands
  122. Guernsey Jersey
  123. Monaco
  124. Tajikistan
  125. Pitcairn

Disclaimer : The GIS data provided for download in this article was initially sourced from OpenStreetMap (OSM) and further modified to enhance its usability. Please note that the original data is licensed under the Open Database License (ODbL) by the OpenStreetMap contributors. While modifications have been made to improve the data, any use, redistribution, or modification of this data must comply with the ODbL license terms. For more information on the ODbL, please visit OpenStreetMap’s License Page.

Here are some blogs you might be interested in:

Download Orchard Data in Shapefile, KML, MID & in GIS Formats

Need spatial data for agricultural or environmental planning? Download Orchard Data effortlessly using GIS Data by MAPOG—a comprehensive platform offering multi-format GIS datasets including Shapefile, KML, GeoJSON, MID, and more. Designed to support diverse GIS tools, this intuitive portal delivers well-structured, location-specific data on orchards, ideal for land use studies, farming analysis, agri-tech solutions, and sustainable development planning.

How to Download Orchard Data with MAPOG

MAPOG simplifies access to orchard-related geographic data with a straightforward, guided workflow. With support for formats like SHP, KML, CSV, MID, DXF, MIF, GPX, and TOPOJSON, it serves the needs of both professionals and enthusiasts in the GIS and agriculture sectors.

Download Orchard Data of any countries

Note:
  • All data is provided in GCS datum EPSG:4326 WGS84 CRS (Coordinate Reference System).
  • Users need to log in to access and download their preferred data formats.

Step-by-Step Guide to Download Orchard Data

Step 1: Search for Orchard Data

Navigate to the MAPOG platform and use the search layer tool to locate “Orchard Data.” Once found, review its attributes to confirm whether the data is represented in points or polygons. This helps determine its suitability for your intended GIS application.

Download Orchard Data
Step 2: Try the AI Search Assistant

Save time by using MAPOG’s “Try AI” feature. Input simple prompts like “Orchards in this area” and let the AI fetch the most relevant layers in seconds. This smart search assistant improves accuracy and reduces the hassle of manual filtering.

Download Orchard Data
Step 3: Apply Smart Filters for Precision

Make your search more specific with the Filter Data option. Users can narrow down orchard datasets by selecting specific states or districts—helping target the exact region of interest. For country-wide datasets, these filters allow deeper granularity and improved data relevance.

Download Orchard Data
Step 4: Visualize the Data on the Map

The “Add on Map” feature allows you to overlay the selected orchard data on the interactive map interface. This visual layer helps with spatial analysis, planning, and pattern recognition—especially useful for comparing orchard distribution or coverage across regions.

Download Orchard Data
Step 5: Download Orchard Data in Desired Format

Once you’re satisfied with the dataset, proceed to download it. Choose between sample or full versions, select your preferred format—whether Shapefile, KML, MID, or another GIS-supported type—and agree to the download terms. With just a click, your orchard data is ready to use.

Download Orchard Data

Final Thoughts

Thanks to MAPOG’s intuitive tools and extensive format support, the process to download Orchard Data is seamless and efficient. Whether you’re mapping for agriculture, conducting environmental assessments, or managing land resources, the platform ensures you get accurate and useful orchard data tailored to your needs. So if you’re ready to take your GIS analysis to the next level, start by downloading the orchard data that fits your project perfectly.

With MAPOG’s versatile toolkit, you can effortlessly upload vector and upload Excel or CSV data, incorporate existing layers, perform polyline splitting, use the converter for various formats, calculate isochrones, and utilize the Export Tool.

For any questions or further assistance, feel free to reach out to us at support@mapog.com. We’re here to help you make the most of your GIS data.

Download Shapefile for the following:

  1. World Countries Shapefile
  2. Australia
  3. Argentina
  4. Austria
  5. Belgium
  6. Brazil
  7. Canada
  8. Denmark
  9. Fiji
  10. Finland
  11. Germany
  12. Greece
  13. India
  14. Indonesia
  15. Ireland
  16. Italy
  17. Japan
  18. Kenya
  19. Lebanon
  20. Madagascar
  21. Malaysia
  22. Mexico
  23. Mongolia
  24. Netherlands
  25. New Zealand
  26. Nigeria
  27. Papua New Guinea
  28. Philippines
  29. Poland
  30. Russia
  31. Singapore
  32. South Africa
  33. South Korea
  34. Spain
  35. Switzerland
  36. Tunisia
  37. United Kingdom Shapefile
  38. United States of America
  39. Vietnam
  40. Croatia
  41. Chile
  42. Norway
  43. Maldives
  44. Bhutan
  45. Colombia
  46. Libya
  47. Comoros
  48. Hungary
  49. Laos
  50. Estonia
  51. Iraq
  52. Portugal
  53. Azerbaijan
  54. Macedonia
  55. Romania
  56. Peru
  57. Marshall Islands
  58. Slovenia
  59. Nauru
  60. Guatemala
  61. El Salvador
  62. Afghanistan
  63. Cyprus
  64. Syria
  65. Slovakia
  66. Luxembourg
  67. Jordan
  68. Armenia
  69. Haiti And Dominican Republic
  70. Malta
  71. Djibouti
  72. East Timor
  73. Micronesia
  74. Morocco
  75. Liberia
  76. Kosovo
  77. Isle Of Man
  78. Paraguay
  79. Tokelau
  80. Palau
  81. Ile De Clipperton
  82. Mauritius
  83. Equatorial Guinea
  84. Tonga
  85. Myanmar
  86. Thailand
  87. New Caledonia
  88. Niger
  89. Nicaragua
  90. Pakistan
  91. Nepal
  92. Seychelles
  93. Democratic Republic of the Congo
  94. China
  95. Kenya
  96. Kyrgyzstan
  97. Bosnia Herzegovina
  98. Burkina Faso
  99. Canary Island
  100. Togo
  101. Israel And Palestine
  102. Algeria
  103. Suriname
  104. Angola
  105. Cape Verde
  106. Liechtenstein
  107. Taiwan
  108. Turkmenistan
  109. Tuvalu
  110. Ivory Coast
  111. Moldova
  112. Somalia
  113. Belize
  114. Swaziland
  115. Solomon Islands
  116. North Korea
  117. Sao Tome And Principe
  118. Guyana
  119. Serbia
  120. Senegal And Gambia
  121. Faroe Islands
  122. Guernsey Jersey
  123. Monaco
  124. Tajikistan
  125. Pitcairn

Disclaimer : The GIS data provided for download in this article was initially sourced from OpenStreetMap (OSM) and further modified to enhance its usability. Please note that the original data is licensed under the Open Database License (ODbL) by the OpenStreetMap contributors. While modifications have been made to improve the data, any use, redistribution, or modification of this data must comply with the ODbL license terms. For more information on the ODbL, please visit OpenStreetMap’s License Page.

Here are some blogs you might be interested in:

Download Fitness Studios Location Data in Shapefile, KML, and GIS Formats

Looking for accurate location data on fitness studios? Download Fitness Studios Data easily and efficiently using GIS Data by MAPOG. This intuitive platform supports over 15 GIS-compatible formats, including Shapefile, KML, GeoJSON, MID, and more. Whether you’re working on urban planning, health and wellness research, or commercial site analysis, MAPOG offers well-structured and frequently updated spatial datasets that are ready to power your GIS workflows.

How to Download Fitness Studios Data?

From analyzing health infrastructure to exploring fitness access in urban spaces, MAPOG makes the process of accessing location-based data incredibly simple. With coverage spanning hundreds of layers, this platform caters to both beginners and advanced GIS users. You can export data in formats like SHP, CSV, DXF, SQL, GPX, TOPOJSON, MIF, and others—ensuring wide compatibility with popular GIS tools like QGIS, ArcGIS, or AutoCAD Map.

Download Fitness Studios Data of any countries

Note:
  • All data is provided in GCS datum EPSG:4326 WGS84 CRS (Coordinate Reference System).
  • Users need to log in to access and download their preferred data formats.

Step-by-Step Guide to Download Fitness Studios Data

Step 1: Search for Fitness Studios Data

Begin by selecting your region of interest on the GIS Data by MAPOG platform. Use the search function to find “Fitness Studios Data.” Review the layer’s attributes to see whether the data is represented in point or polygon geometry.

Download Fitness Studios Data
Step 2: Use the AI Search Assistant

MAPOG’s smart “Try AI” search tool enhances your experience. Simply type phrases like “Fitness centers near city” or “Workout facilities in region,” and the AI will fetch the most relevant datasets in seconds. It’s an efficient way to discover data without manual filtering.

Download Fitness Studios Data
Step 3: Filter Your Dataset

Narrow down results with the powerful Filter Data tool. You can refine data by selecting specific states and districts. This targeted approach ensures you get only the most relevant information for your project—perfect for localized mapping or in-depth spatial analysis.

Download Fitness Studios Data
Step 4: Visualize with “Add on Map”

Once a dataset is selected, click the “Add on Map” option. This adds the data layer directly to the platform’s map viewer, allowing you to interact, analyze spatial distribution, and assess patterns such as concentration clusters or underserved areas.

Download Fitness Studios Data
Step 5: Download Fitness Studios Data

After reviewing the data, proceed to download it. Choose either the sample version or the complete dataset. Select from a variety of GIS formats including Shapefile, KML, MID, and others. Accept the terms, and your download will begin instantly.

Download Fitness Studios Data

Final Thoughts

With GIS Data by MAPOG, it’s never been more convenient to Download Fitness Studios Data for analysis, planning, or research purposes. The platform offers flexibility, precision, and a wide selection of formats to match your GIS toolkit. So, whether you’re mapping health trends or scouting locations for a new gym, Download Fitness Studios Data from MAPOG and elevate your spatial insights.

With MAPOG’s versatile toolkit, you can effortlessly upload vector and upload Excel or CSV data, incorporate existing layers, perform polyline splitting, use the converter for various formats, calculate isochrones, and utilize the Export Tool.

For any questions or further assistance, feel free to reach out to us at support@mapog.com. We’re here to help you make the most of your GIS data.

Download Shapefile for the following:

  1. World Countries Shapefile
  2. Australia
  3. Argentina
  4. Austria
  5. Belgium
  6. Brazil
  7. Canada
  8. Denmark
  9. Fiji
  10. Finland
  11. Germany
  12. Greece
  13. India
  14. Indonesia
  15. Ireland
  16. Italy
  17. Japan
  18. Kenya
  19. Lebanon
  20. Madagascar
  21. Malaysia
  22. Mexico
  23. Mongolia
  24. Netherlands
  25. New Zealand
  26. Nigeria
  27. Papua New Guinea
  28. Philippines
  29. Poland
  30. Russia
  31. Singapore
  32. South Africa
  33. South Korea
  34. Spain
  35. Switzerland
  36. Tunisia
  37. United Kingdom Shapefile
  38. United States of America
  39. Vietnam
  40. Croatia
  41. Chile
  42. Norway
  43. Maldives
  44. Bhutan
  45. Colombia
  46. Libya
  47. Comoros
  48. Hungary
  49. Laos
  50. Estonia
  51. Iraq
  52. Portugal
  53. Azerbaijan
  54. Macedonia
  55. Romania
  56. Peru
  57. Marshall Islands
  58. Slovenia
  59. Nauru
  60. Guatemala
  61. El Salvador
  62. Afghanistan
  63. Cyprus
  64. Syria
  65. Slovakia
  66. Luxembourg
  67. Jordan
  68. Armenia
  69. Haiti And Dominican Republic
  70. Malta
  71. Djibouti
  72. East Timor
  73. Micronesia
  74. Morocco
  75. Liberia
  76. Kosovo
  77. Isle Of Man
  78. Paraguay
  79. Tokelau
  80. Palau
  81. Ile De Clipperton
  82. Mauritius
  83. Equatorial Guinea
  84. Tonga
  85. Myanmar
  86. Thailand
  87. New Caledonia
  88. Niger
  89. Nicaragua
  90. Pakistan
  91. Nepal
  92. Seychelles
  93. Democratic Republic of the Congo
  94. China
  95. Kenya
  96. Kyrgyzstan
  97. Bosnia Herzegovina
  98. Burkina Faso
  99. Canary Island
  100. Togo
  101. Israel And Palestine
  102. Algeria
  103. Suriname
  104. Angola
  105. Cape Verde
  106. Liechtenstein
  107. Taiwan
  108. Turkmenistan
  109. Tuvalu
  110. Ivory Coast
  111. Moldova
  112. Somalia
  113. Belize
  114. Swaziland
  115. Solomon Islands
  116. North Korea
  117. Sao Tome And Principe
  118. Guyana
  119. Serbia
  120. Senegal And Gambia
  121. Faroe Islands
  122. Guernsey Jersey
  123. Monaco
  124. Tajikistan
  125. Pitcairn

Disclaimer : The GIS data provided for download in this article was initially sourced from OpenStreetMap (OSM) and further modified to enhance its usability. Please note that the original data is licensed under the Open Database License (ODbL) by the OpenStreetMap contributors. While modifications have been made to improve the data, any use, redistribution, or modification of this data must comply with the ODbL license terms. For more information on the ODbL, please visit OpenStreetMap’s License Page.

Here are some blogs you might be interested in:

Download Animal Boarding Facility Data in Shapefile, KML, and GeoJSON Formats

Download Animal Boarding Facility Data seamlessly with GIS Data by MAPOG. These facilities serve as safe spaces where animals are temporarily housed, cared for, and monitored, often during travel, emergencies, or when owners are unable to provide immediate care. MAPOG makes it simple to access accurate datasets of such facilities in multiple GIS formats, including Shapefile, KML, MID, GeoJSON, and more—ensuring compatibility with a wide range of mapping and analysis tools.

Why It Matters

Animal Boarding Facility data is crucial for urban planners, veterinary authorities, animal welfare organizations, and researchers who need insights into the distribution and accessibility of these facilities. With MAPOG, the process of locating, analyzing, and exporting this information is streamlined, making planning and analysis far more efficient.

Download Animal Boarding Facility Data of any countries

Note:
  • All data is provided in GCS datum EPSG:4326 WGS84 CRS (Coordinate Reference System).
  • Users need to log in to access and download their preferred data formats.

Step-by-Step Guide to Download Animal Boarding Facility Data

Step 1: Search for the Data

Within the MAPOG interface, use the search layer option and type “Animal Boarding.” The dataset details will display attributes such as location points or polygons, providing clarity on the type of geographic data available.

Download Animal Boarding Facility Data
Download Animal Boarding Data
Step 2: Use the AI Search Tool

MAPOG’s “Try AI” feature makes searching much faster. By entering simple keywords like “Animal Boarding Facility near area”, the AI automatically fetches relevant datasets, saving users time and minimizing manual effort.

Download Animal Boarding Facility Data
Step 3: Apply Data Filters

To get more refined results, apply the Filter Data option. This allows you to narrow down information to a particular state or district. For larger datasets, this feature provides deeper precision, ensuring users retrieve only the most relevant data.

Download Animal Boarding Facility Data
Step 4: Visualize with “Add on Map”

Once a dataset is located, the Add on Map option lets you overlay it directly on the interactive GIS interface. This visualization step makes it easier to understand facility distribution, coverage gaps, and accessibility before proceeding to download.

Download Animal Boarding Facility Data
Step 5: Download Animal Boarding Facility Data

After finalizing the dataset, click Download Data. MAPOG provides flexibility to either download a sample or the complete dataset. Select your desired format—Shapefile, KML, MID, GeoJSON, or among 15+ supported GIS formats.

Download Animal Boarding Facility Data

Conclusion

With GIS Data by MAPOG, the ability to Download Animal Boarding Facility Data becomes straightforward, accurate, and highly flexible. Professionals, researchers, and planners can now access structured datasets in multiple formats to support mapping, decision-making, and analysis. Whether for welfare initiatives, emergency planning, or urban development, this platform ensures data is both reliable and ready for actionable insights.

With MAPOG’s versatile toolkit, you can effortlessly upload vector and upload Excel or CSV data, incorporate existing layers, perform Split polygon by line, use the converter for various formats, calculate isochrones, and utilize the Export Tool.

For any questions or further assistance, feel free to reach out to us at support@mapog.com. We’re here to help you make the most of your GIS data.

Download Shapefile for the following:

  1. World Countries Shapefile
  2. Australia
  3. Argentina
  4. Austria
  5. Belgium
  6. Brazil
  7. Canada
  8. Denmark
  9. Fiji
  10. Finland
  11. Germany
  12. Greece
  13. India
  14. Indonesia
  15. Ireland
  16. Italy
  17. Japan
  18. Kenya
  19. Lebanon
  20. Madagascar
  21. Malaysia
  22. Mexico
  23. Mongolia
  24. Netherlands
  25. New Zealand
  26. Nigeria
  27. Papua New Guinea
  28. Philippines
  29. Poland
  30. Russia
  31. Singapore
  32. South Africa
  33. South Korea
  34. Spain
  35. Switzerland
  36. Tunisia
  37. United Kingdom Shapefile
  38. United States of America
  39. Vietnam
  40. Croatia
  41. Chile
  42. Norway
  43. Maldives
  44. Bhutan
  45. Colombia
  46. Libya
  47. Comoros
  48. Hungary
  49. Laos
  50. Estonia
  51. Iraq
  52. Portugal
  53. Azerbaijan
  54. Macedonia
  55. Romania
  56. Peru
  57. Marshall Islands
  58. Slovenia
  59. Nauru
  60. Guatemala
  61. El Salvador
  62. Afghanistan
  63. Cyprus
  64. Syria
  65. Slovakia
  66. Luxembourg
  67. Jordan
  68. Armenia
  69. Haiti And Dominican Republic
  70. Malta
  71. Djibouti
  72. East Timor
  73. Micronesia
  74. Morocco
  75. Liberia
  76. Kosovo
  77. Isle Of Man
  78. Paraguay
  79. Tokelau
  80. Palau
  81. Ile De Clipperton
  82. Mauritius
  83. Equatorial Guinea
  84. Tonga
  85. Myanmar
  86. Thailand
  87. New Caledonia
  88. Niger
  89. Nicaragua
  90. Pakistan
  91. Nepal
  92. Seychelles
  93. Democratic Republic of the Congo
  94. China
  95. Kenya
  96. Kyrgyzstan
  97. Bosnia Herzegovina
  98. Burkina Faso
  99. Canary Island
  100. Togo
  101. Israel And Palestine
  102. Algeria
  103. Suriname
  104. Angola
  105. Cape Verde
  106. Liechtenstein
  107. Taiwan
  108. Turkmenistan
  109. Tuvalu
  110. Ivory Coast
  111. Moldova
  112. Somalia
  113. Belize
  114. Swaziland
  115. Solomon Islands
  116. North Korea
  117. Sao Tome And Principe
  118. Guyana
  119. Serbia
  120. Senegal And Gambia
  121. Faroe Islands
  122. Guernsey Jersey
  123. Monaco
  124. Tajikistan
  125. Pitcairn

Disclaimer : The GIS data provided for download in this article was initially sourced from OpenStreetMap (OSM) and further modified to enhance its usability. Please note that the original data is licensed under the Open Database License (ODbL) by the OpenStreetMap contributors. While modifications have been made to improve the data, any use, redistribution, or modification of this data must comply with the ODbL license terms. For more information on the ODbL, please visit OpenStreetMap’s License Page.

Here are some blogs you might be interested in:

Download Coffeehouses Data in Shapefile, KML, MID and other GIS Formats

Looking to analyze the spread and accessibility of coffeehouses for commercial, urban planning, or tourism purposes? Download Coffeehouses Data effortlessly using the GIS Data by MAPOG platform. This intuitive tool provides access to well-organized geographic datasets across more than 15 GIS formats—including Shapefile, KML, MID, and GeoJSON—ensuring compatibility with all major GIS software. Coffeehouses, being vital social and economic landmarks in cities and towns, offer key insights for business analysts, location strategists, and researchers exploring consumer trends and urban dynamics.

How to Download Coffeehouses Data

GIS Data by MAPOG makes it easy to access accurate and up-to-date information with just a few clicks. Whether you’re mapping independent cafés or analyzing the footprint of global chains, MAPOG supports a variety of formats like KML, SHP, CSV, MIF, DXF, GeoJSON, SQL, GPX, and TOPOJSON—making it an ideal tool for professionals across disciplines.

Download Coffeehouses Data of any countries

Note:
  • All data is provided in GCS datum EPSG:4326 WGS84 CRS (Coordinate Reference System).
  • Users need to log in to access and download their preferred data formats.

Step-by-Step Guide to Download Coffeehouses Data

Step 1: Search for Coffeehouses Data

Begin by navigating through the MAPOG interface. Use the “Search Layer” feature and type in “Coffeehouses Data.” Check available attributes to see whether the dataset is offered as points, polygons, or both—depending on location density and coverage.

Download Coffeehouses Data
Step 2: Use AI Search Tool

Accelerate your search using the “Try AI” option. By entering simple prompts like “Coffeehouses in any areas” or “Cafés in any state,” the AI assistant instantly pulls up the most relevant layers—saving you time and ensuring precision in results.

Download Coffeehouses Data
Step 3: Apply Data Filters

Narrow down results using the Filter Data tool. This feature lets you filter by state and district, allowing for highly localized data extraction. When dealing with broader datasets, this option helps dive deeper into specific regions for targeted analysis.

Download Coffeehouses Data
Step 4: Visualize with “Add on Map”

With the Add on Map feature, users can overlay selected coffeehouse layers directly onto an interactive analysis map. This allows real-time visualization of café distribution, customer reach, and urban coffee culture patterns—critical for business strategy or research.

Download Coffeehouses Data
Step 5: Download Coffeehouses Data

Once satisfied with the dataset, proceed to download. Choose between a sample or complete dataset, then select the format you need—Shapefile, KML, MID, or any other supported type. Agree to the usage terms and click download.

Download Coffeehouses Data

Final Thoughts

With GIS Data by MAPOG, the process to Download Coffeehouses Data becomes streamlined, insightful, and customizable. Whether you’re working on business expansion, city planning, or academic research, this platform ensures that you get reliable and flexible GIS data in the format you need. From visual exploration to in-depth spatial analysis, Download Coffeehouses Data today and turn location insights into actionable outcomes.

With MAPOG’s versatile toolkit, you can effortlessly upload vector and upload Excel or CSV data, incorporate existing layers, perform polyline splitting, use the converter for various formats, calculate isochrones, and utilize the Export Tool.

For any questions or further assistance, feel free to reach out to us at support@mapog.com. We’re here to help you make the most of your GIS data.

Download Shapefile for the following:

  1. World Countries Shapefile
  2. Australia
  3. Argentina
  4. Austria
  5. Belgium
  6. Brazil
  7. Canada
  8. Denmark
  9. Fiji
  10. Finland
  11. Germany
  12. Greece
  13. India
  14. Indonesia
  15. Ireland
  16. Italy
  17. Japan
  18. Kenya
  19. Lebanon
  20. Madagascar
  21. Malaysia
  22. Mexico
  23. Mongolia
  24. Netherlands
  25. New Zealand
  26. Nigeria
  27. Papua New Guinea
  28. Philippines
  29. Poland
  30. Russia
  31. Singapore
  32. South Africa
  33. South Korea
  34. Spain
  35. Switzerland
  36. Tunisia
  37. United Kingdom Shapefile
  38. United States of America
  39. Vietnam
  40. Croatia
  41. Chile
  42. Norway
  43. Maldives
  44. Bhutan
  45. Colombia
  46. Libya
  47. Comoros
  48. Hungary
  49. Laos
  50. Estonia
  51. Iraq
  52. Portugal
  53. Azerbaijan
  54. Macedonia
  55. Romania
  56. Peru
  57. Marshall Islands
  58. Slovenia
  59. Nauru
  60. Guatemala
  61. El Salvador
  62. Afghanistan
  63. Cyprus
  64. Syria
  65. Slovakia
  66. Luxembourg
  67. Jordan
  68. Armenia
  69. Haiti And Dominican Republic
  70. Malta
  71. Djibouti
  72. East Timor
  73. Micronesia
  74. Morocco
  75. Liberia
  76. Kosovo
  77. Isle Of Man
  78. Paraguay
  79. Tokelau
  80. Palau
  81. Ile De Clipperton
  82. Mauritius
  83. Equatorial Guinea
  84. Tonga
  85. Myanmar
  86. Thailand
  87. New Caledonia
  88. Niger
  89. Nicaragua
  90. Pakistan
  91. Nepal
  92. Seychelles
  93. Democratic Republic of the Congo
  94. China
  95. Kenya
  96. Kyrgyzstan
  97. Bosnia Herzegovina
  98. Burkina Faso
  99. Canary Island
  100. Togo
  101. Israel And Palestine
  102. Algeria
  103. Suriname
  104. Angola
  105. Cape Verde
  106. Liechtenstein
  107. Taiwan
  108. Turkmenistan
  109. Tuvalu
  110. Ivory Coast
  111. Moldova
  112. Somalia
  113. Belize
  114. Swaziland
  115. Solomon Islands
  116. North Korea
  117. Sao Tome And Principe
  118. Guyana
  119. Serbia
  120. Senegal And Gambia
  121. Faroe Islands
  122. Guernsey Jersey
  123. Monaco
  124. Tajikistan
  125. Pitcairn

Disclaimer : The GIS data provided for download in this article was initially sourced from OpenStreetMap (OSM) and further modified to enhance its usability. Please note that the original data is licensed under the Open Database License (ODbL) by the OpenStreetMap contributors. While modifications have been made to improve the data, any use, redistribution, or modification of this data must comply with the ODbL license terms. For more information on the ODbL, please visit OpenStreetMap’s License Page.

Here are some blogs you might be interested in:
💬 Book a Meeting