In this tutorial, we’ll guide you through Convert DXF to SQLITE using the Converter Tool in MAPOG. Whether you’re a beginner or have some familiarity with MAPOG, this straightforward guide will assist you in seamlessly transforming your DXF files into SQLITE.
What is DXF Data Format:
DXF is short for Drawing Exchange Format or Drawing Interchange Format and is a type of vector file. Engineers, designers and architects often use the DXF format for 2D and 3D drawings during product design. This data format can be used in case of analyzing the maps. It can be of many types like point, line and polygon or any boundaries.
Online GIS Data Conversion
Converting DXF Data into SQLITE Format:
MAPOG offers a powerful Converter Tool designed to help users easily convert data between different formats based on their requirements. This tool simplifies data transformation for various GIS applications, providing both flexibility and efficiency in handling diverse formats. For example, MAPOG’s Converter Tool can transform DXF data into SQLITE format, optimizing file size while retaining critical geographic details. This conversion makes the data more suitable for online mapping and interactive platforms, improving workflows and greatly enhancing the overall usability of GIS data.
Steps to Convert DXF to SQLITE:
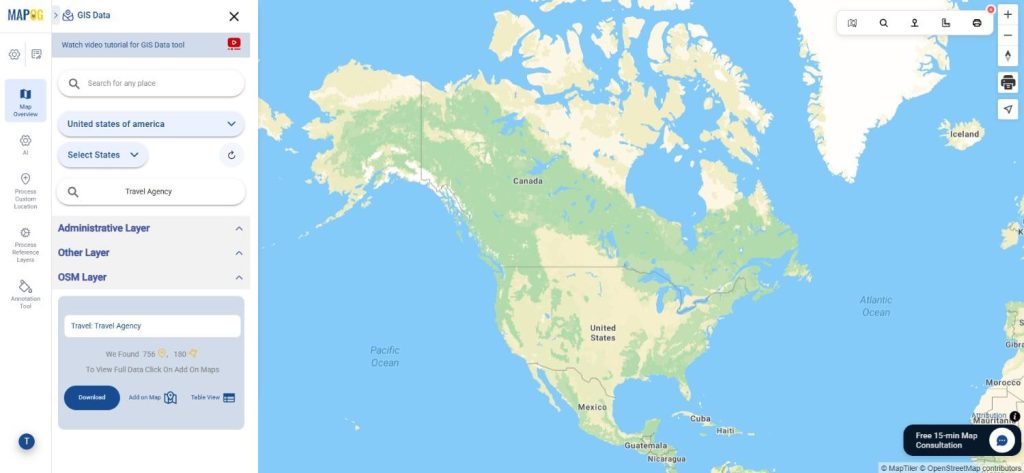
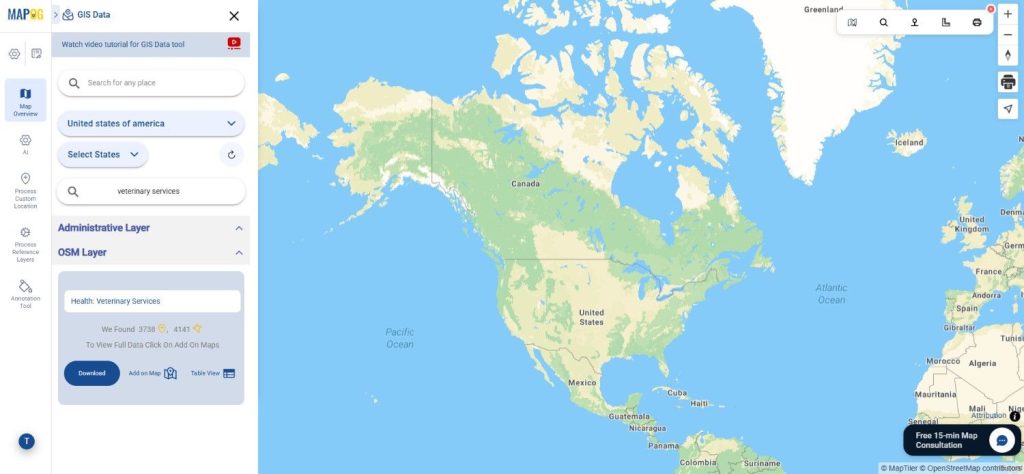
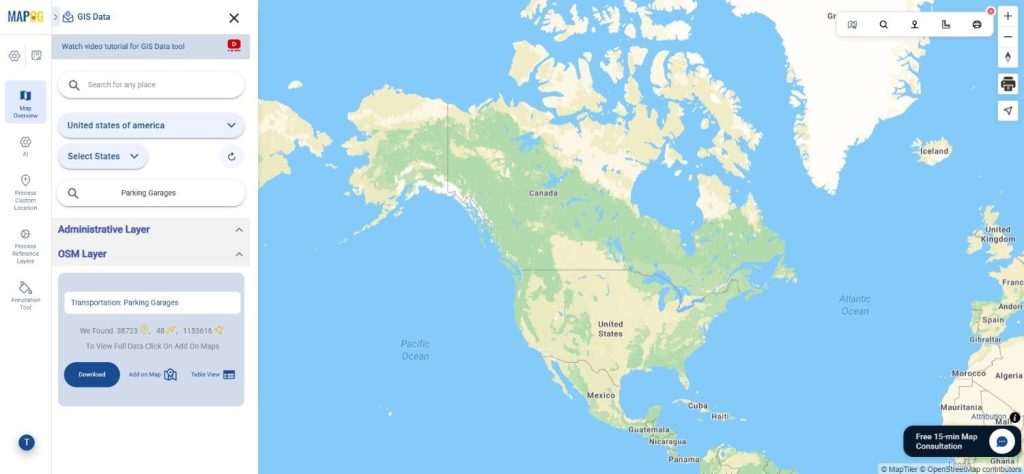
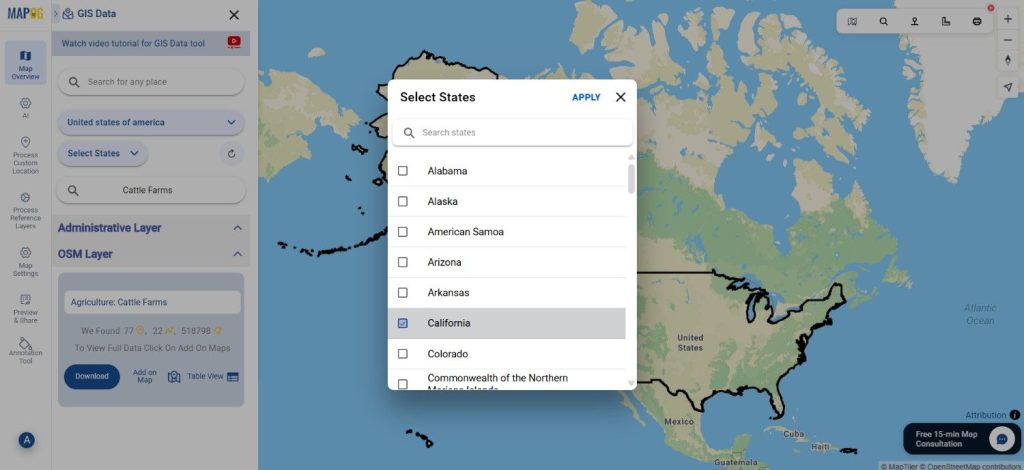
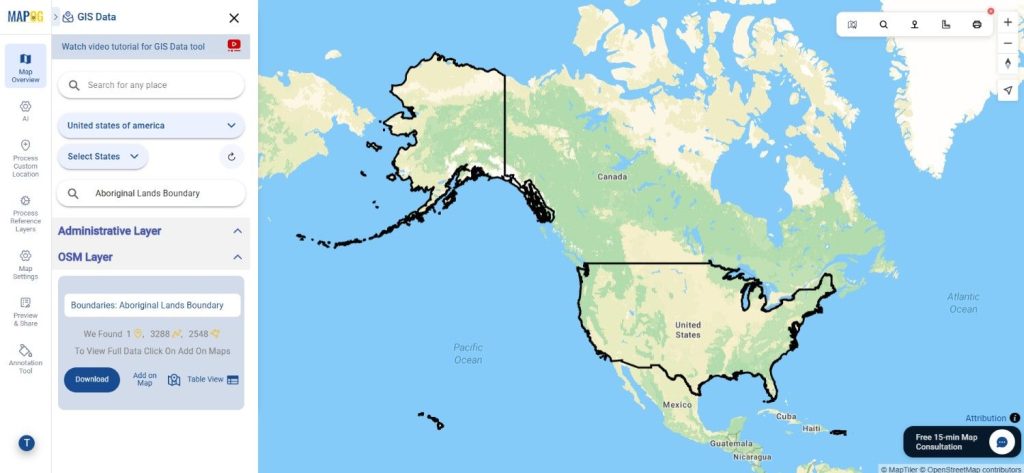
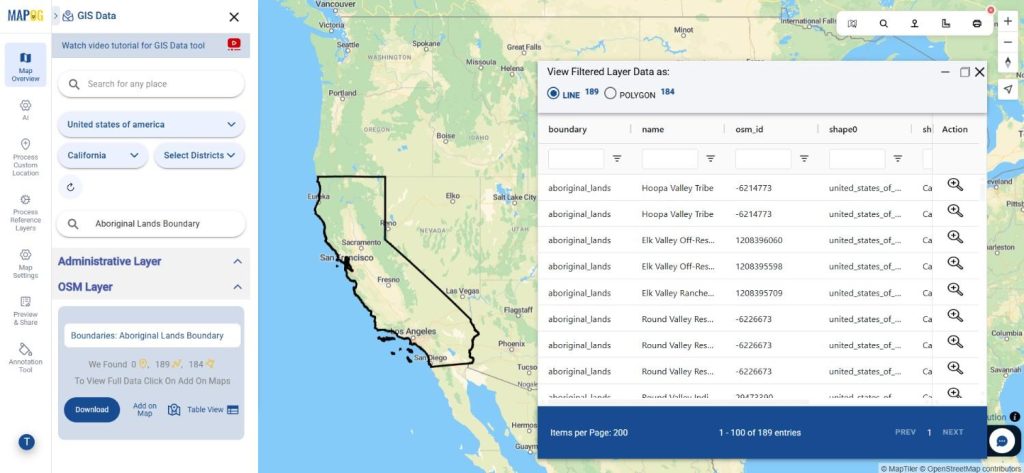
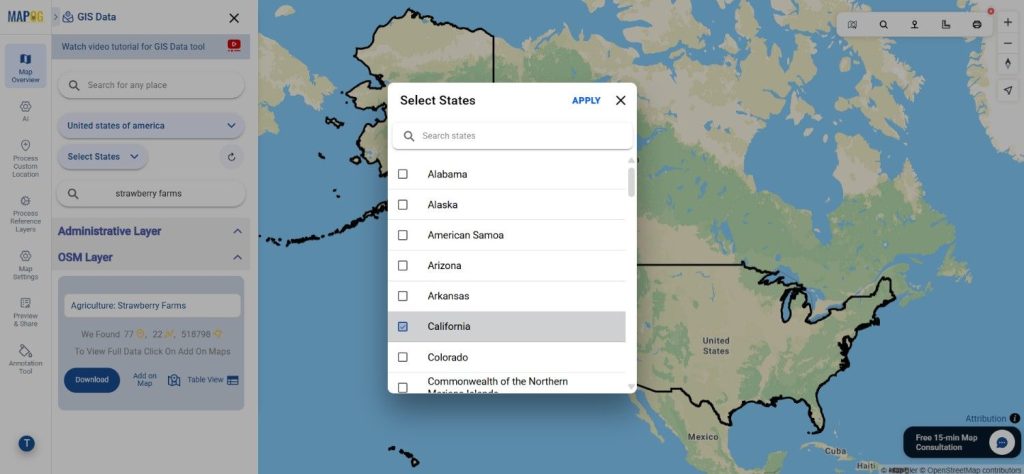
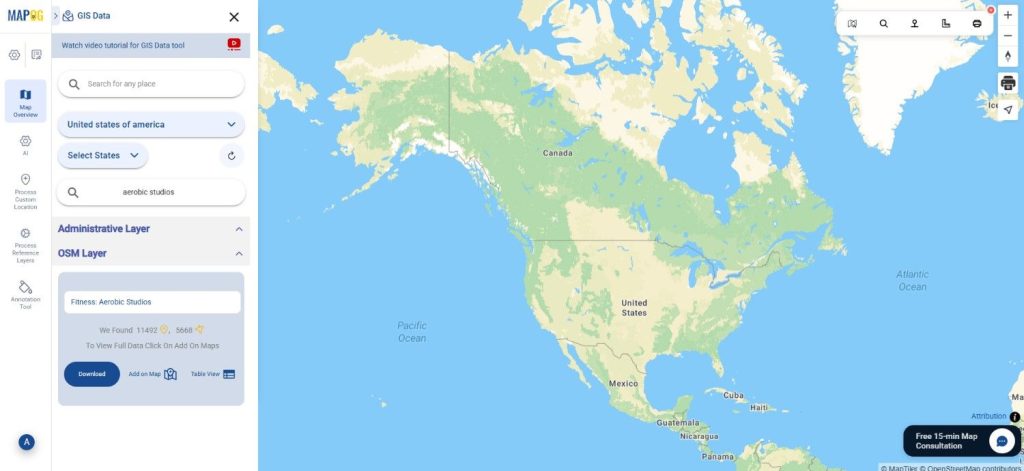
Step 1: Upload the Data :
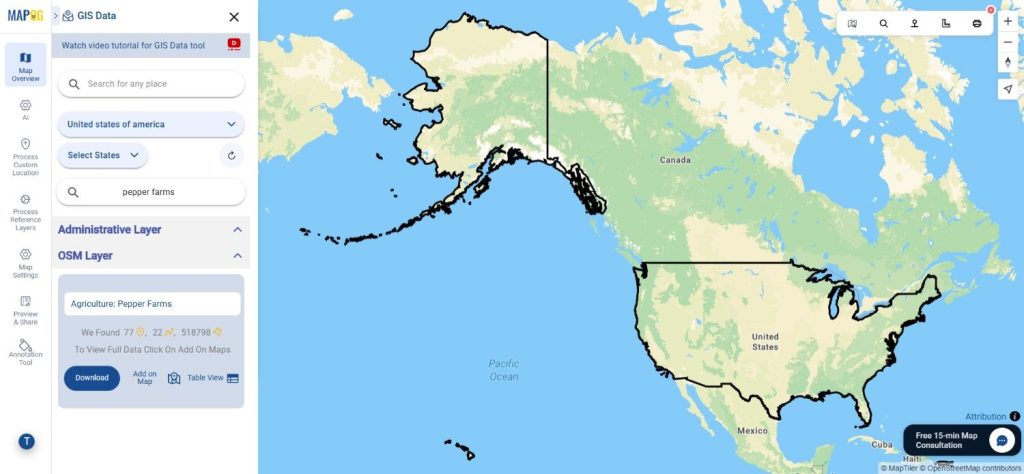
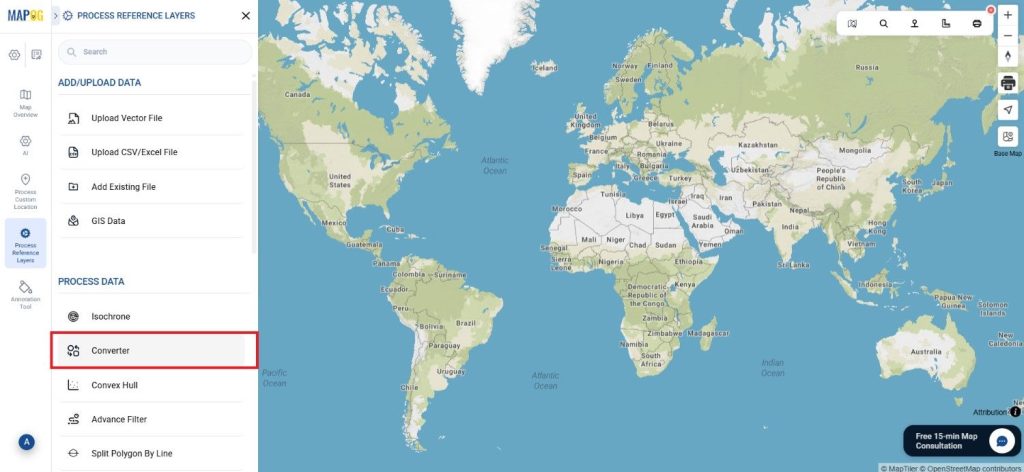
- Go to “Process Reference layers” from the header and choose the “Converter Tool” option.
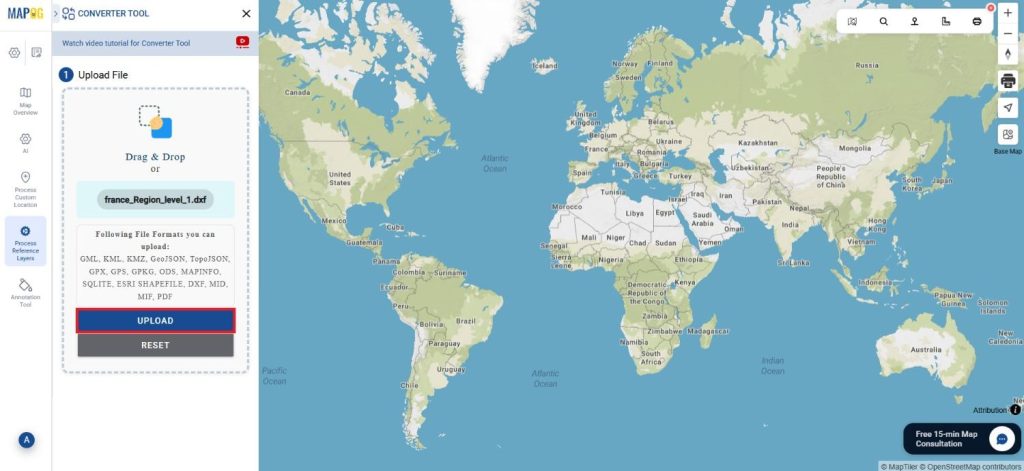
2. Upload your DXF file to start the conversion process by providing the data you wish to transform.
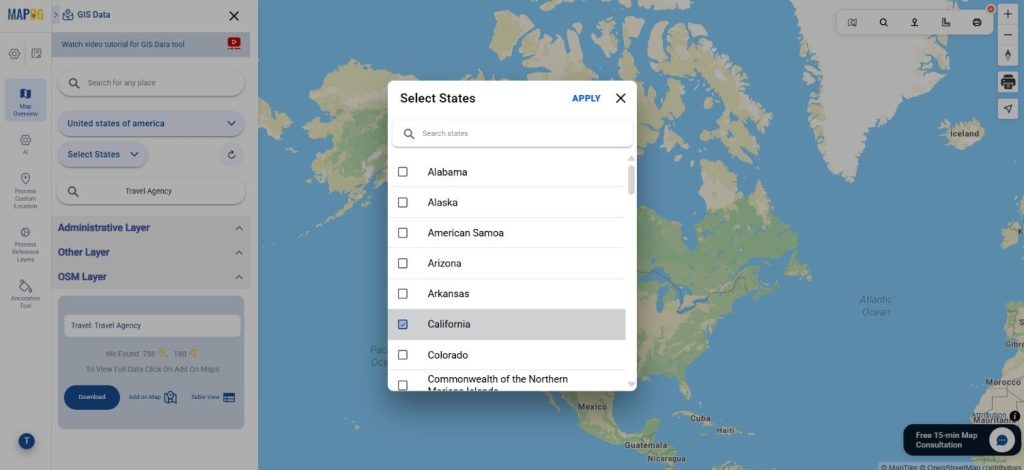
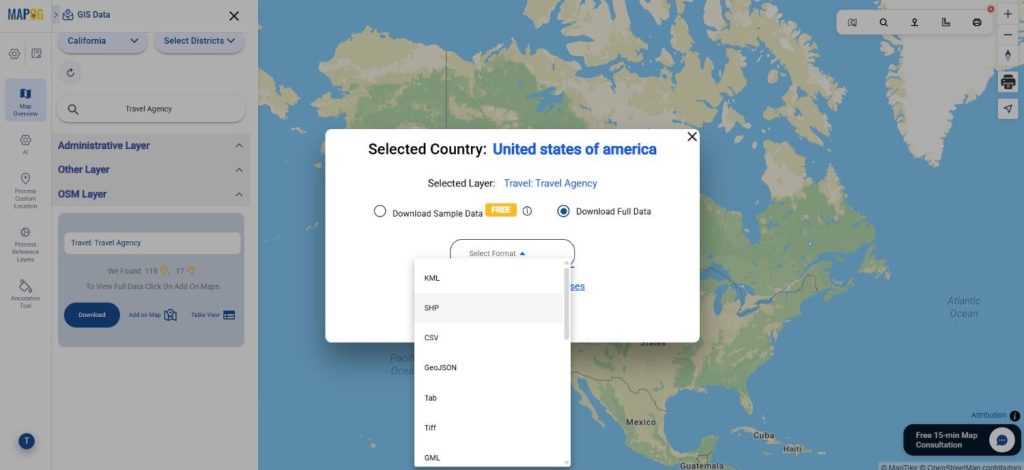
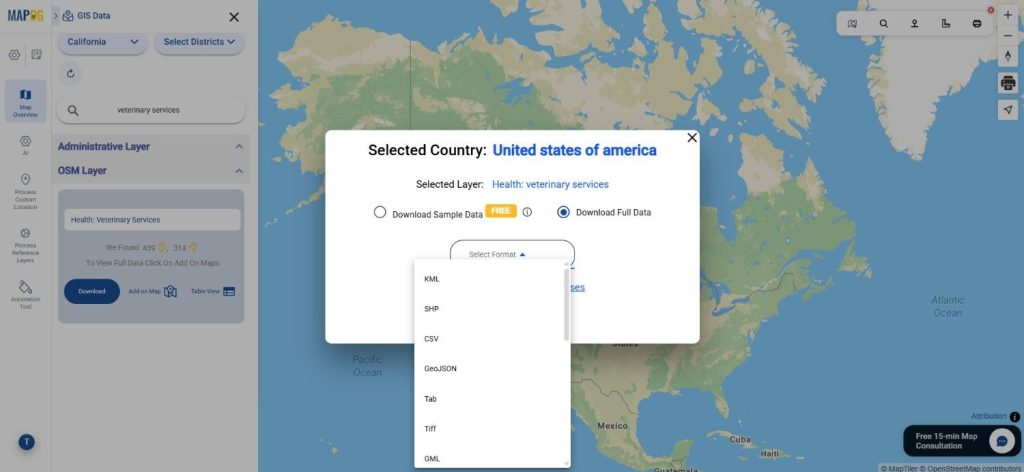
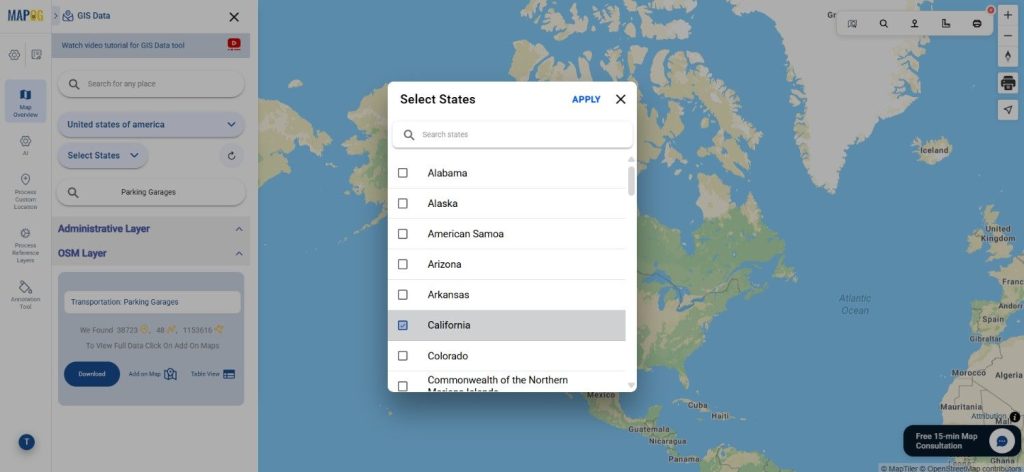
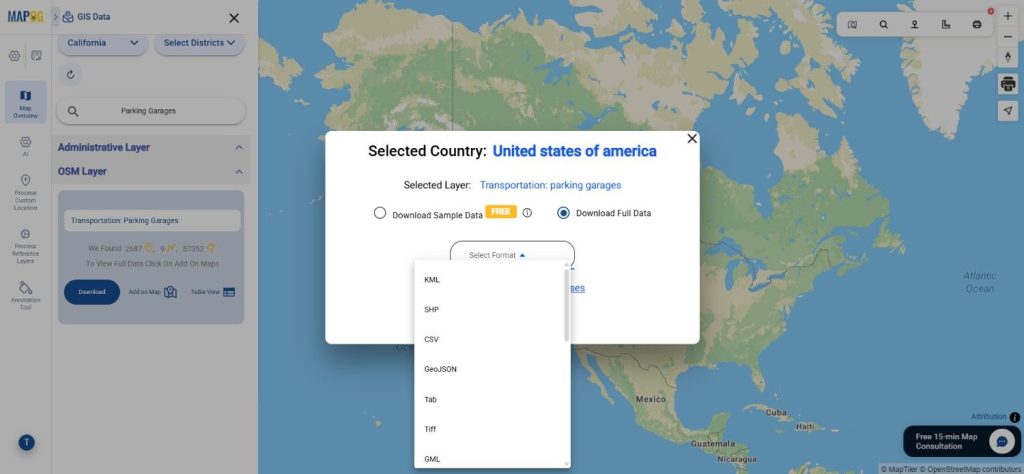
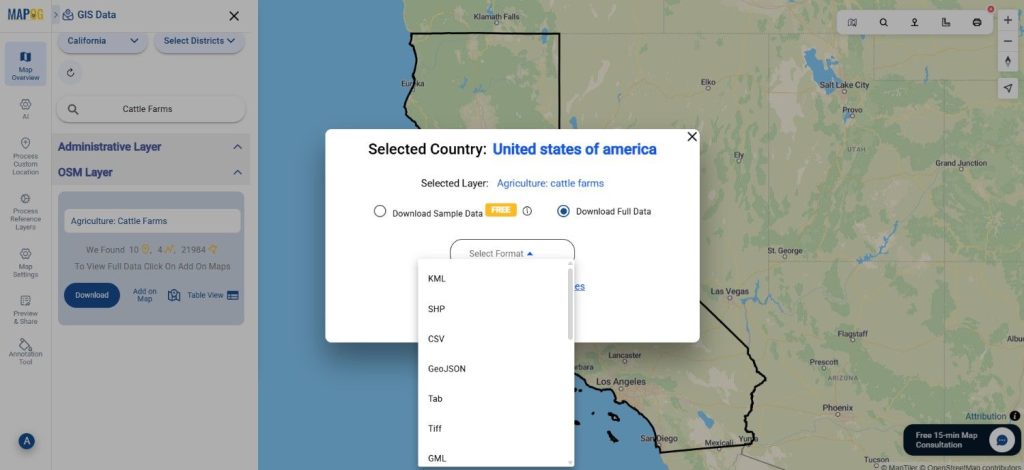
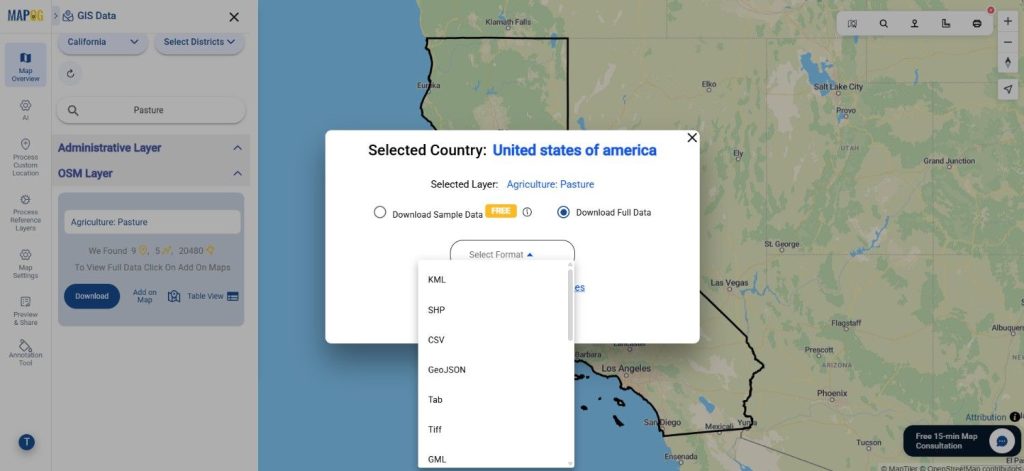
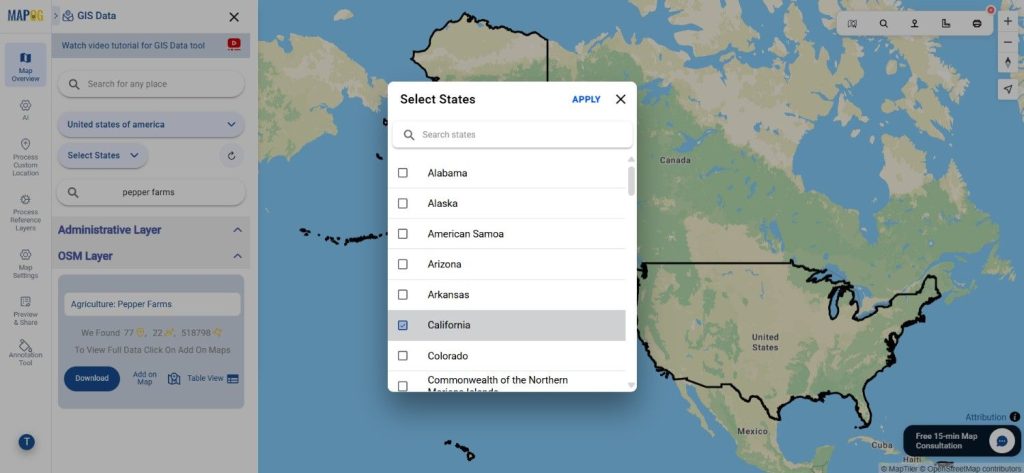
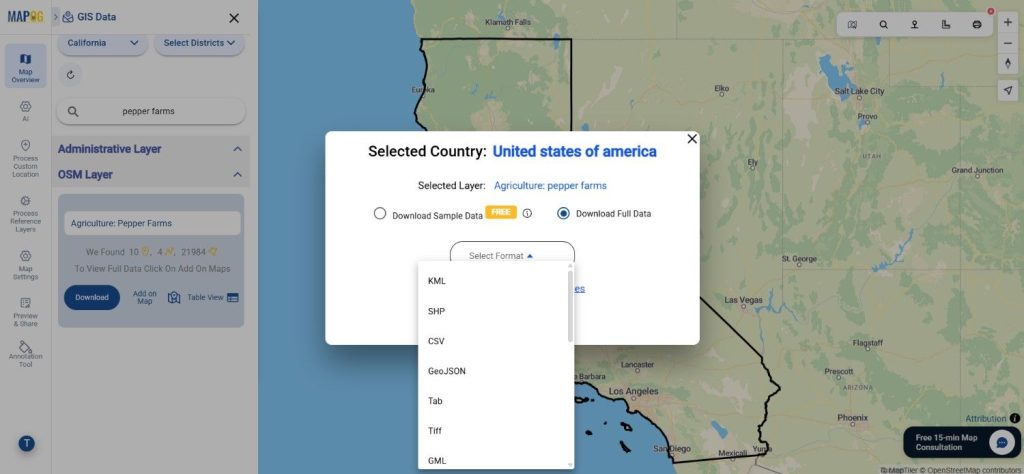
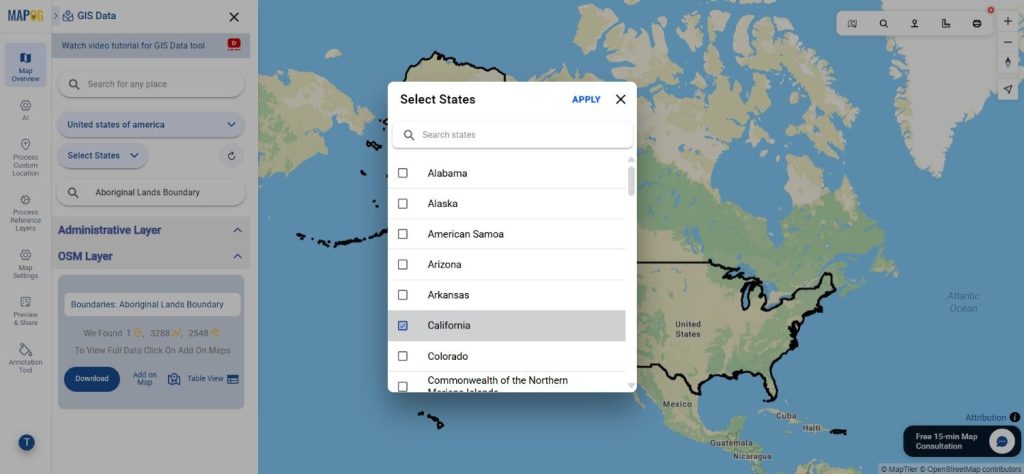
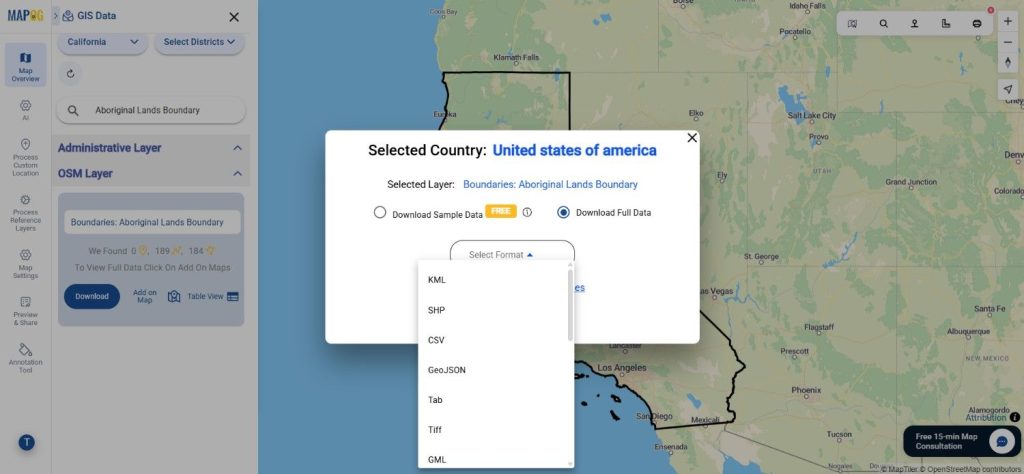
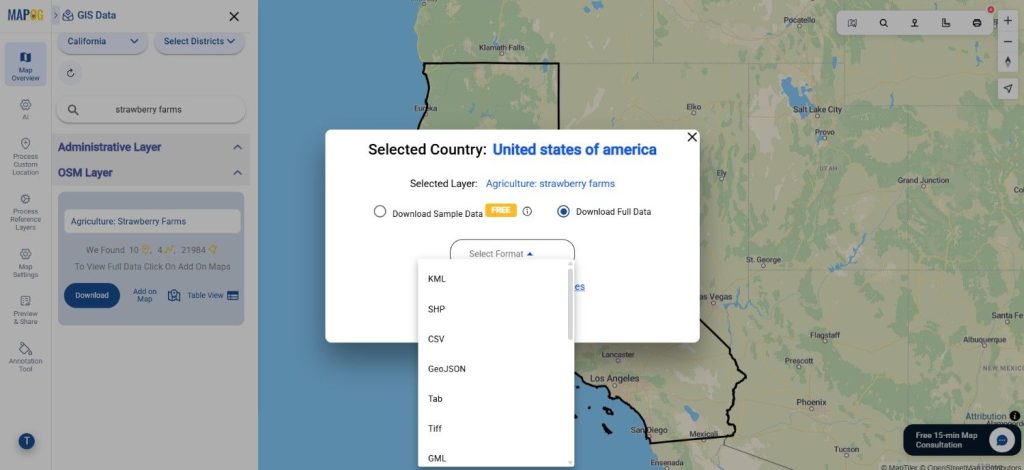
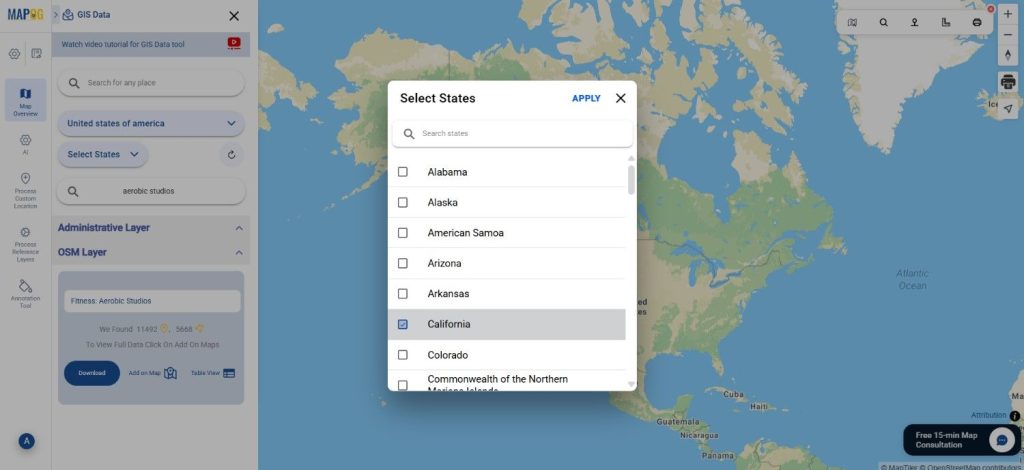
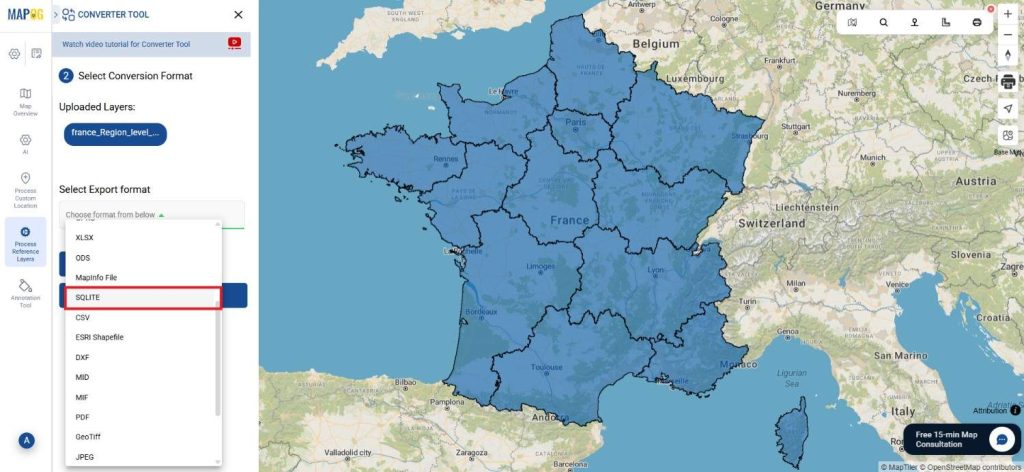
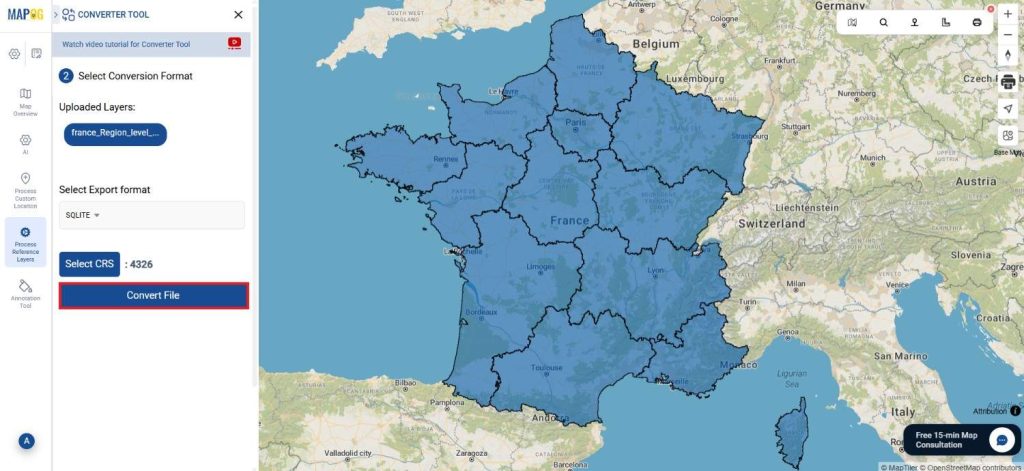
Step 2: Select the Output Format:
Choose SQLITE as your desired output format for exporting the data. While the tool provides multiple format options, this tutorial is specifically centered on converting your file into the SQLITE format.
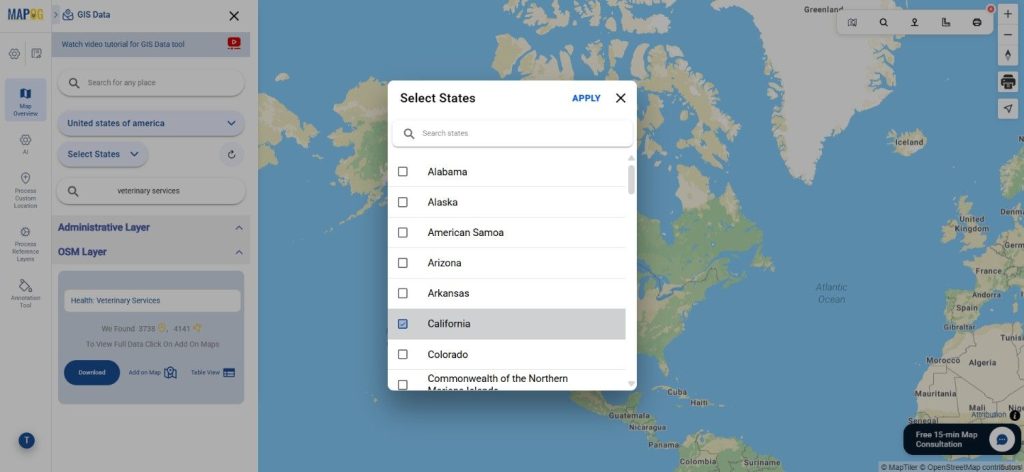
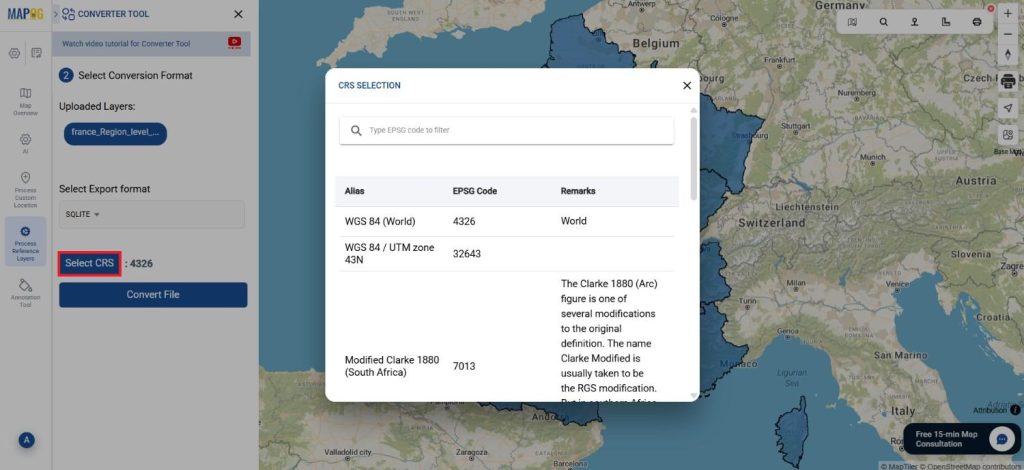
2. You can also set the Output Coordinate Reference System (CRS) according to your spatial analysis requirements.
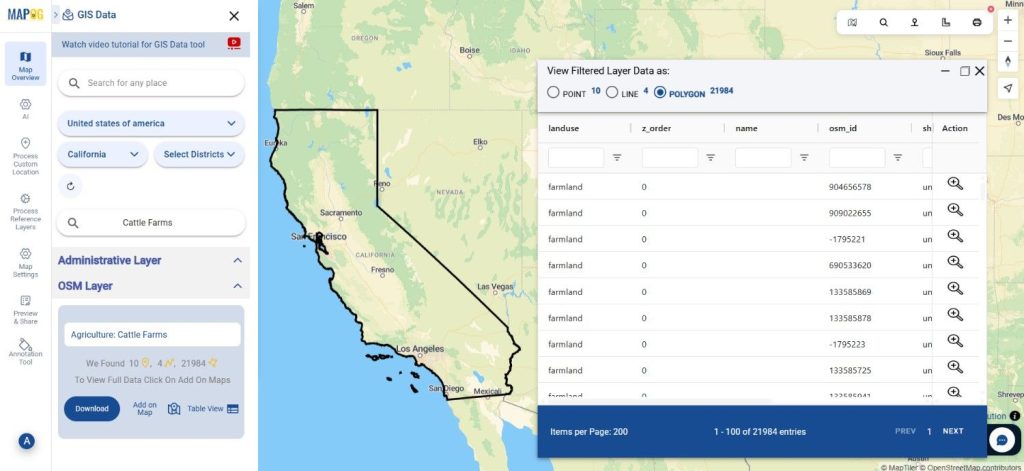
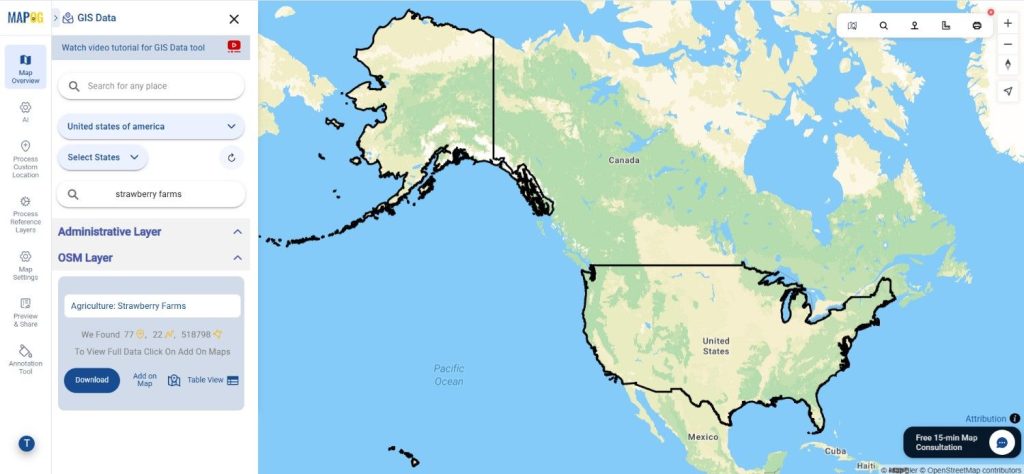
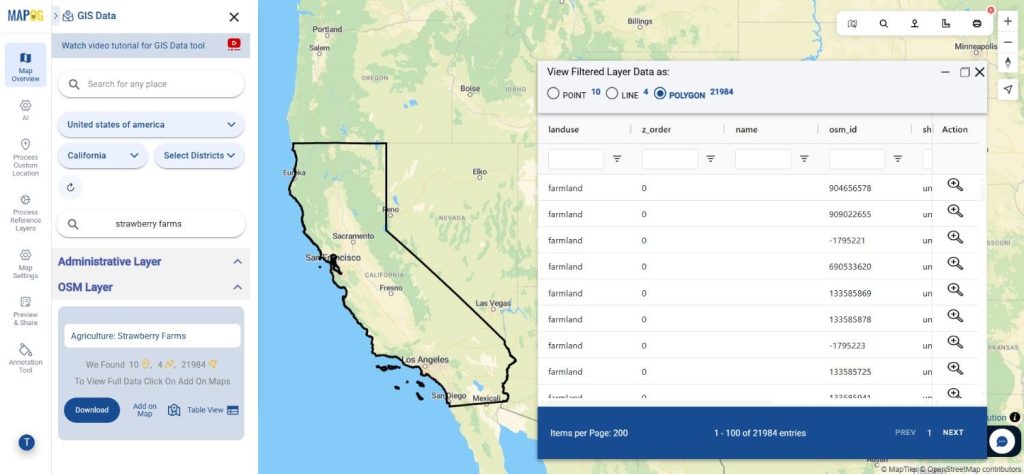
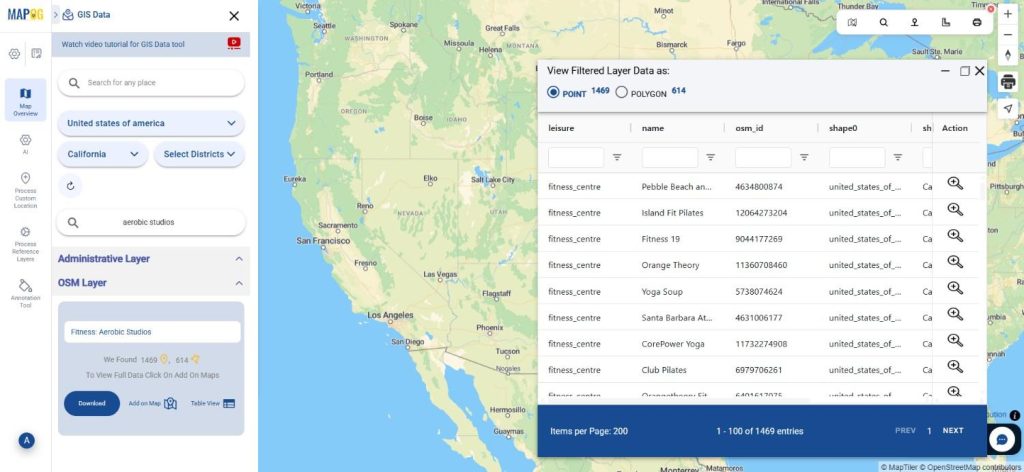
Step 3: Execute the conversion:
Head over to ‘Convert Files’ and let the tool handle the conversion for you. Just upload your data, and the Converter Tool will automatically take care of converting your DXF file into SQLITE format, making the process seamless and efficient.
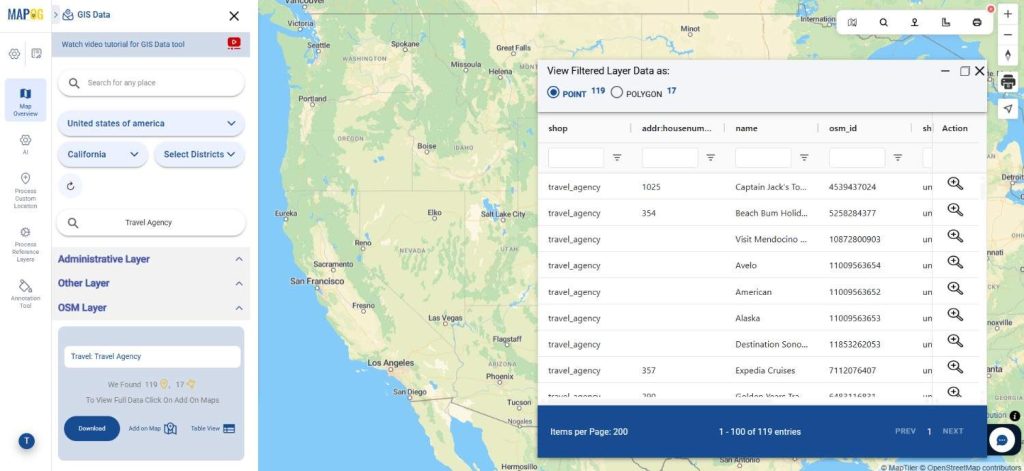
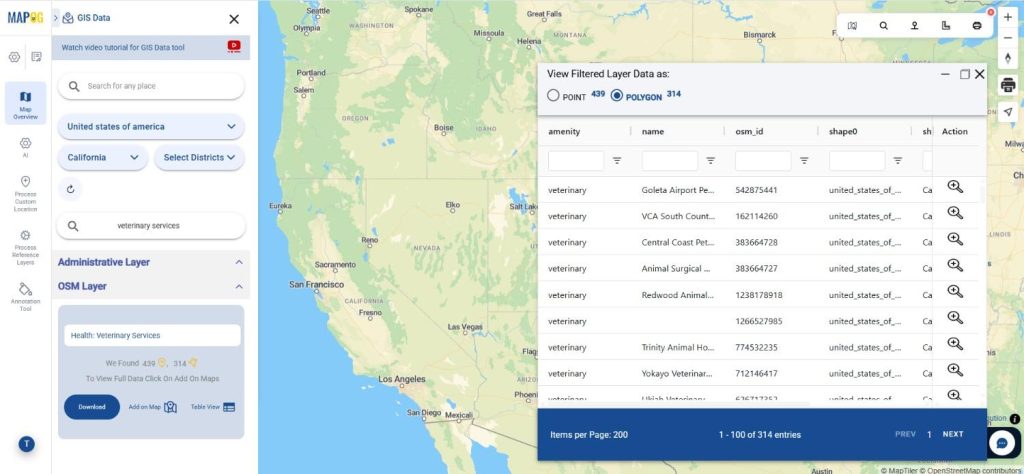
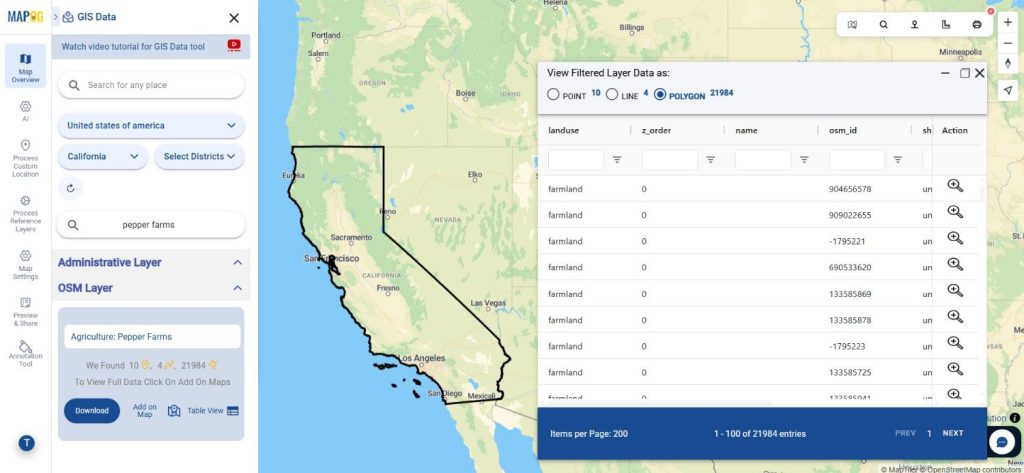
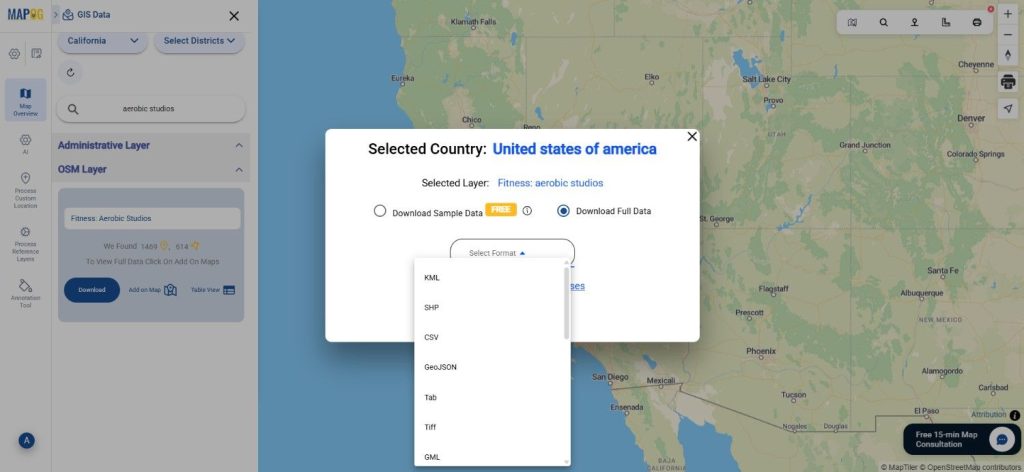
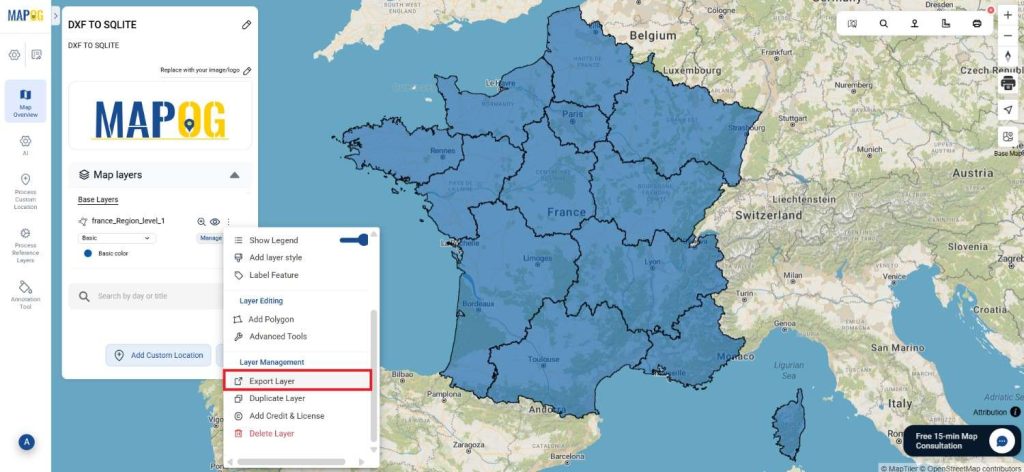
Step 4: Verify and Download:
Inspect your converted SQLITE data to confirm its correctness. After ensuring the results meet your expectations, proceed to download the file. This step is crucial to validate that the conversion was completed successfully and that your data integrity is maintained.
Result:
You’ve successfully converted DXF to SQLITE using MAPOG’s straightforward tools. This process not only simplifies your data management but also enhances the versatility of your data across different GIS platforms. For assistance or inquiries, contact us at support@mapog.com. Happy mapping!
With MAPOG’s versatile toolkit, you can effortlessly upload vectors and upload Excel or CSV data, incorporate existing layers, perform polygon splitting, use the converter for various formats, calculate isochrones, and utilize the Export Tool.
Use MAPOG for mapping and visualizing data across all domains. Its tools make analysis easy and accurate. Convert files to get data in the format you need.
Here are some other blogs you might be interested in:
- Converting KMZ to GeoJSON Online
- Convert KML to MID Online
- Online Conversion KML to MIF
- Convert Online GIS data : KML to PDF file
- Converting KML to GeoTIFF , Online Gis Data Converter
- Converting KMZ to SHP : Online GIS Data Conversion
- Converting TopoJSON to SHP Online : GIS Data Converter
- Converting GeoJSON to TopoJSON with MAPOG
- Converting GeoJSON to CSV with MAPOG
- Converting KMZ to KML with MAPOG
- Converting GML to KML with MAPOG
- Convert KMZ to TopoJSON Online