This guide offers step-by-step instructions on how to convert a MIF file to KMZ format using the Converter Tool in MAPOG. Whether you are new to MAPOG or already have some experience, this tutorial will help you seamlessly transform your MIF files into KMZ format.
What is MIF Data Format:
MIF files are also known as MapInfo Interchange Format files, and often end in a .mif suffix. This format — developed and used by MapInfo for the export of maps and data — contains the data necessary for plotting map features (such as points, lines, or polygons) on a map. MIF files are often accompanied by MID files. MID files contain data attributes, but are not a mandatory addition to the MIF file format.
Online GIS Data Conversion
Converting MIF Data into KMZ Format:
MAPOG offers an advanced Converter Tool that enables users to easily convert data across various formats to meet their specific needs. This tool simplifies the data transformation process for a wide range of GIS applications, ensuring both flexibility and efficiency when handling different file types. For instance, MAPOG’s Converter Tool can transform MIF data into KMZ format, reducing file size while preserving essential geographic details. This conversion enhances the data’s suitability for web-based mapping and interactive platforms, ultimately optimizing workflows and significantly enhancing the overall usability of GIS data.
Steps to Convert MIF to KMZ:
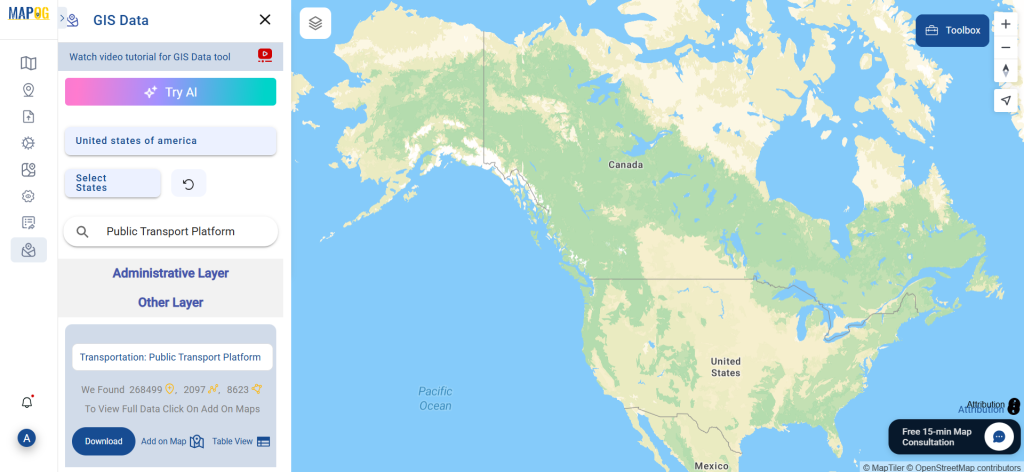
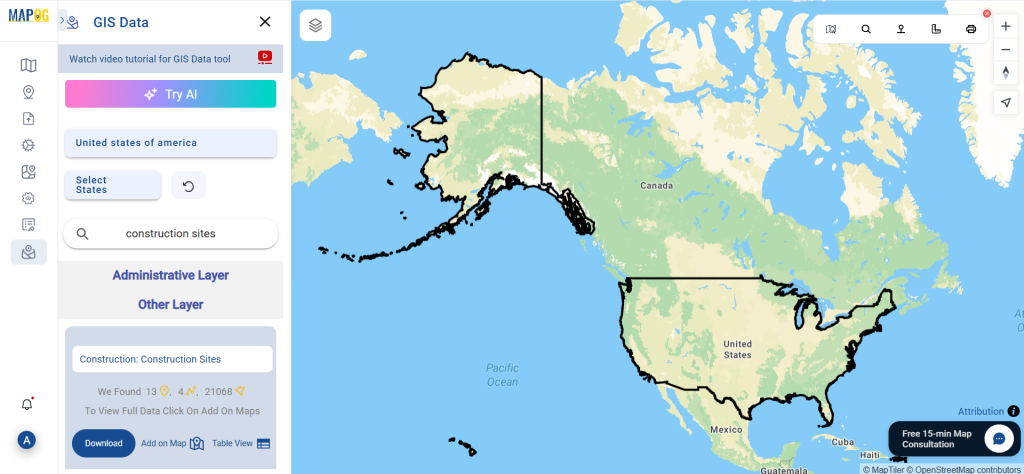
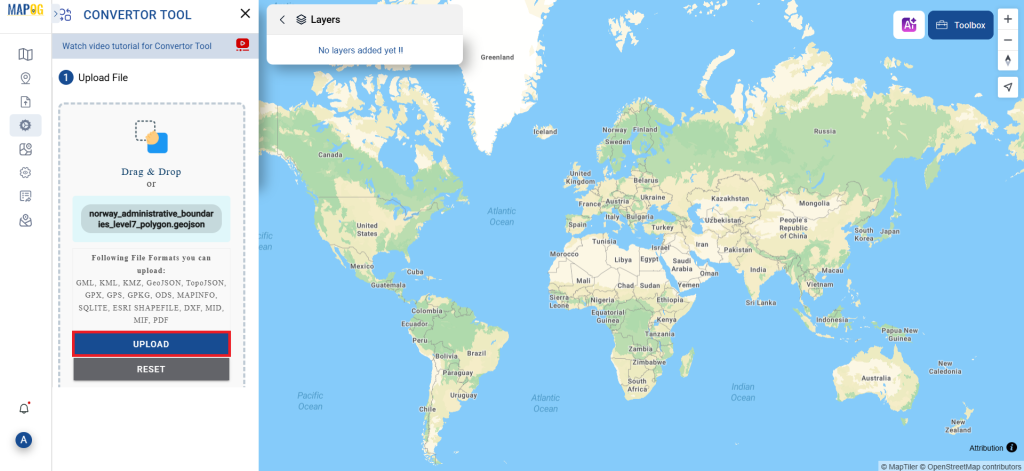
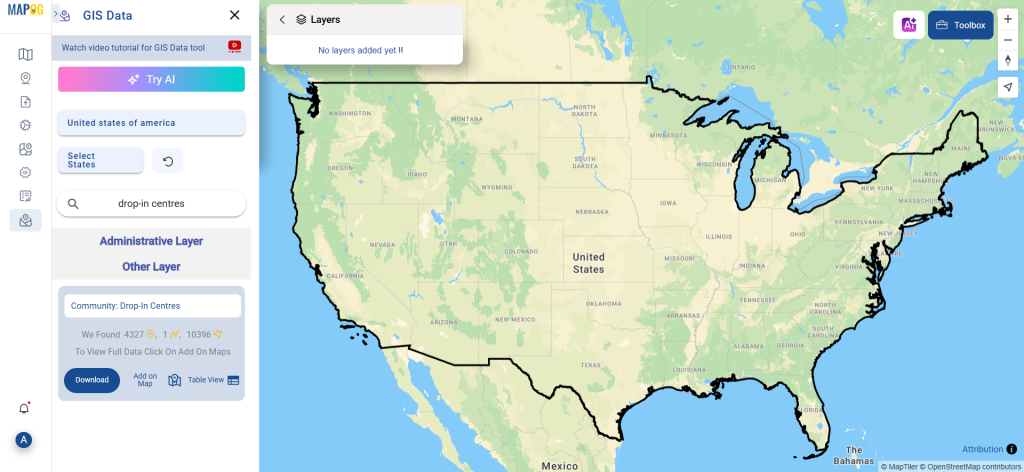
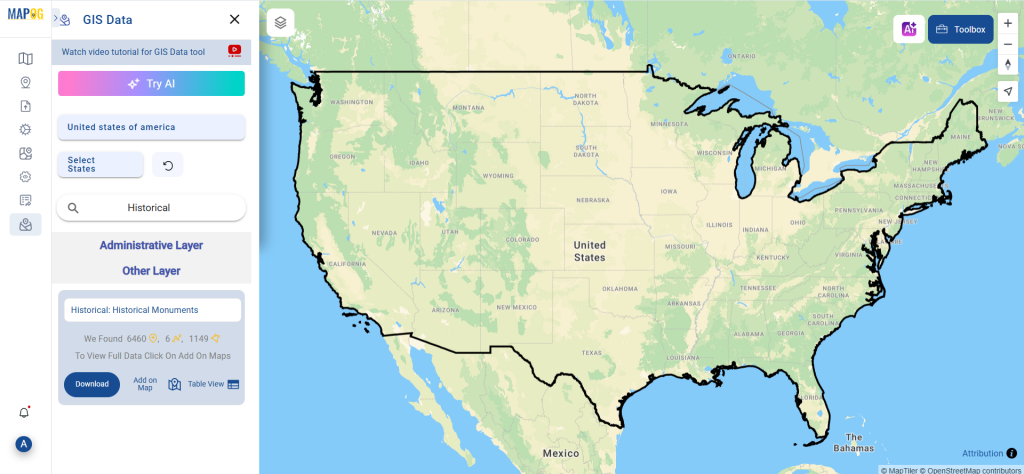
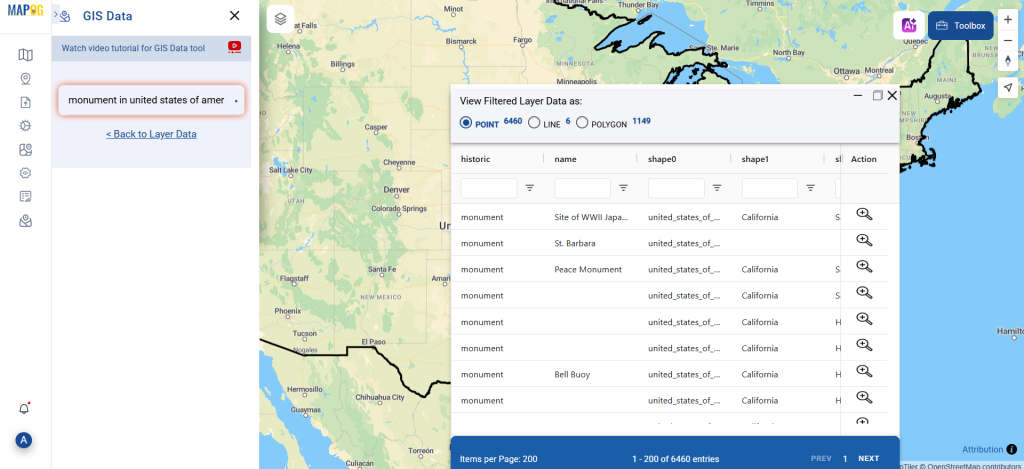
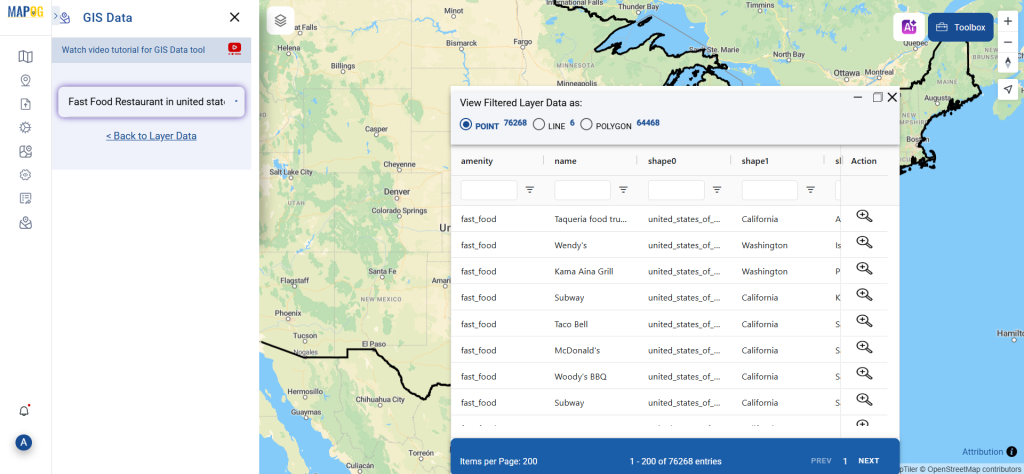
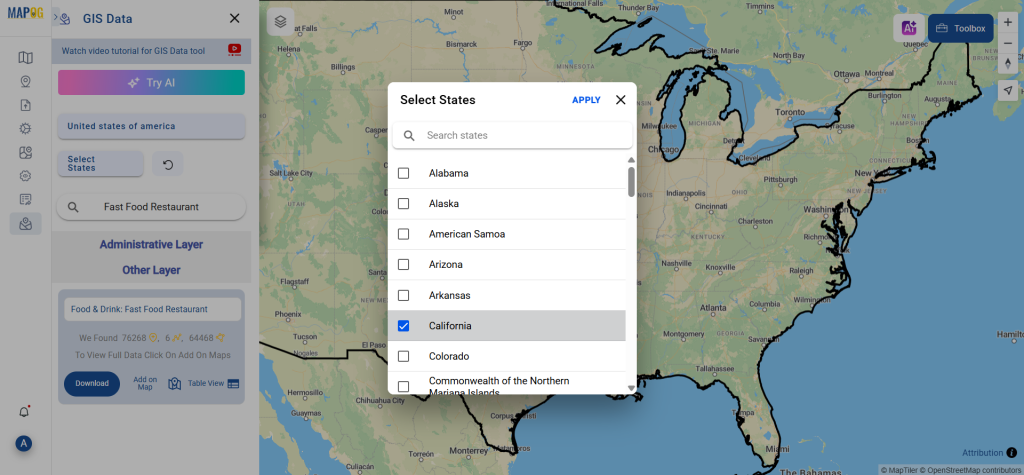
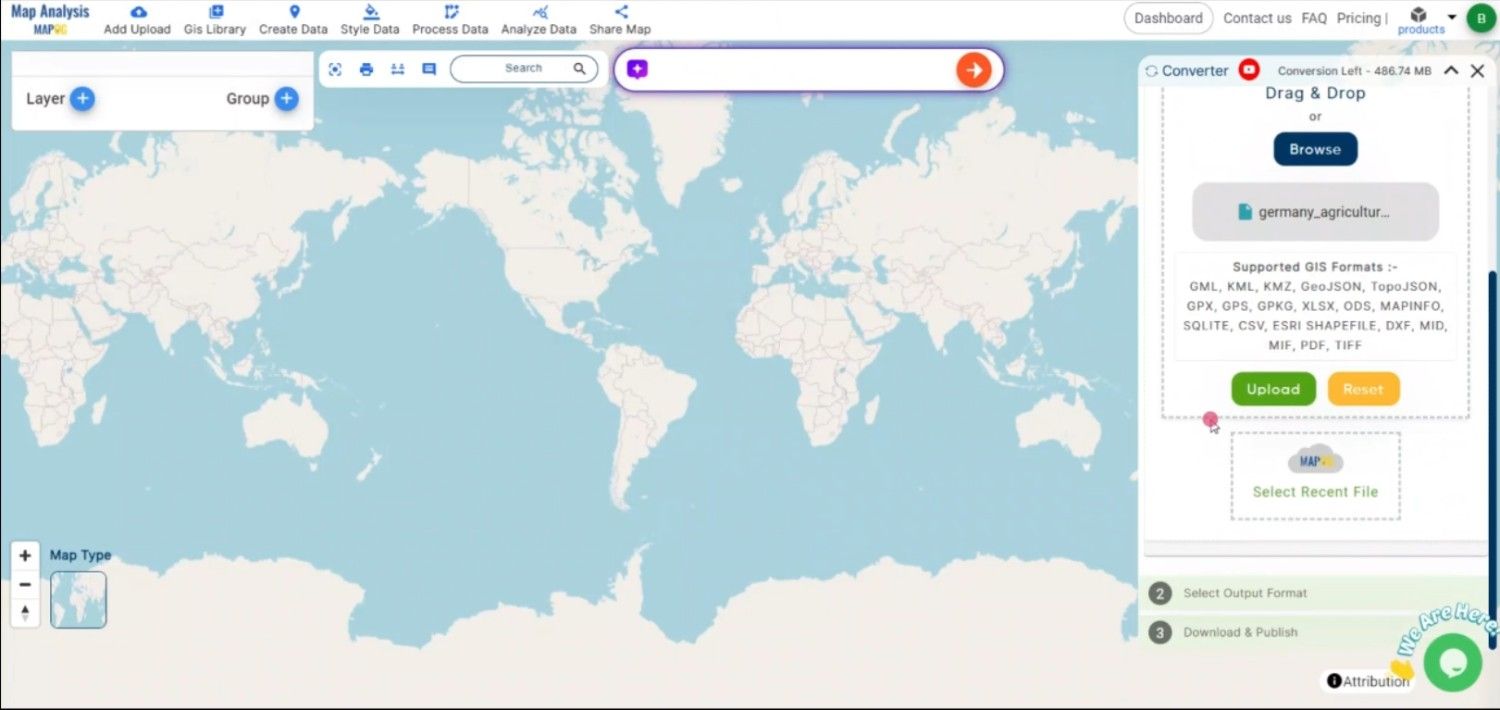
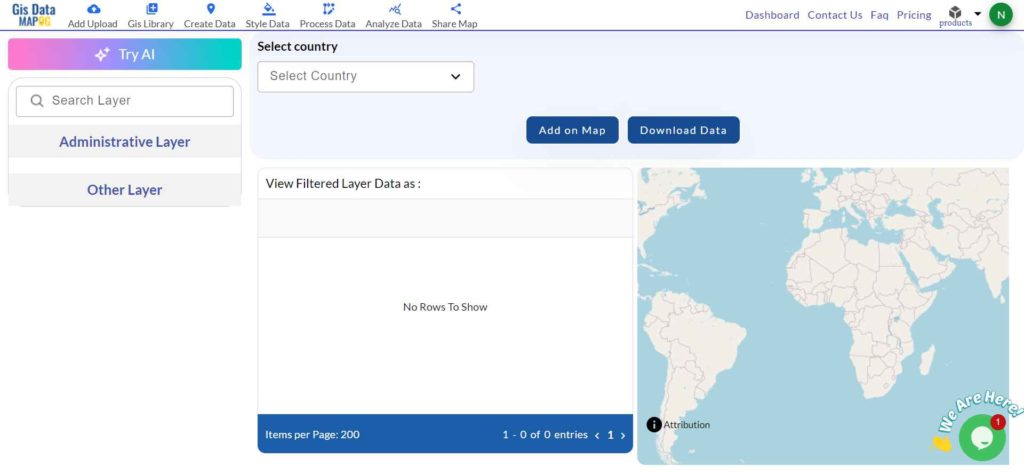
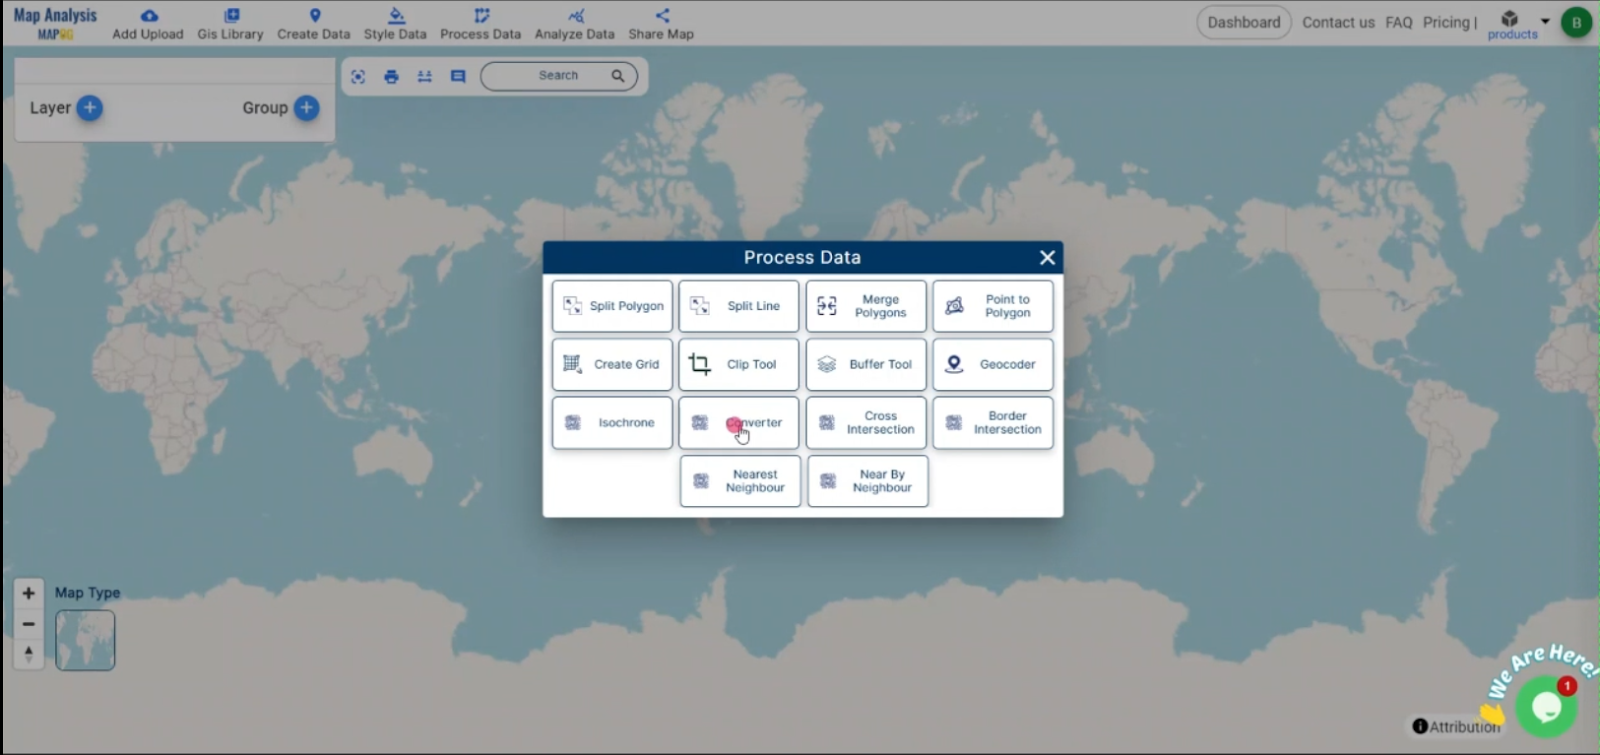
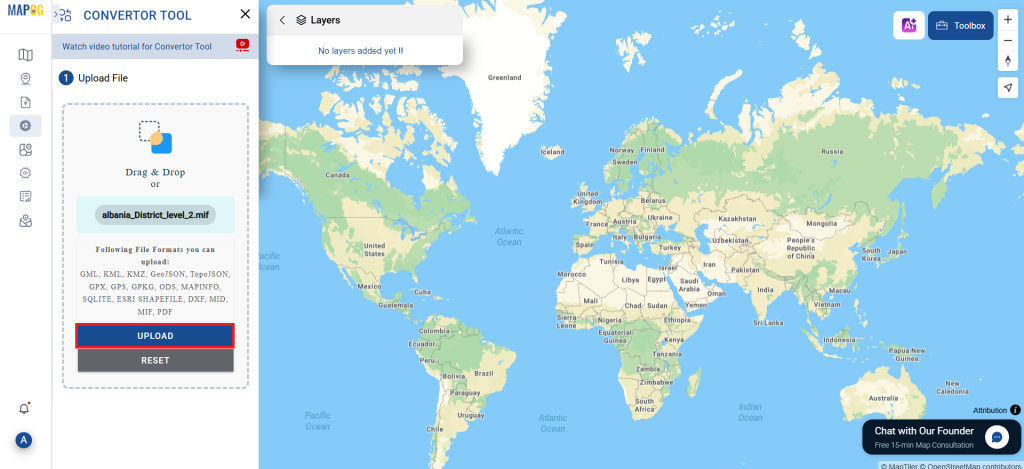
Step 1: Upload the Data:
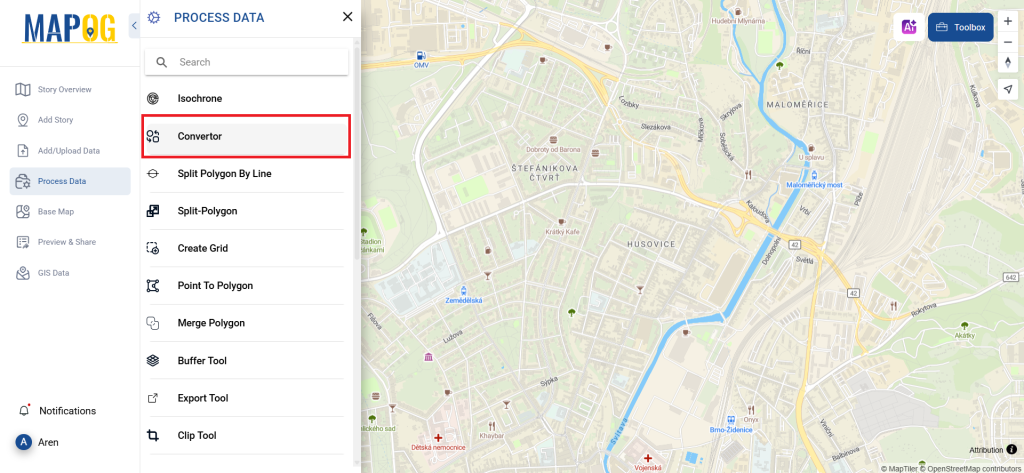
- Navigate to the header and click on “Process Data,” then select the “Converter Tool” option.

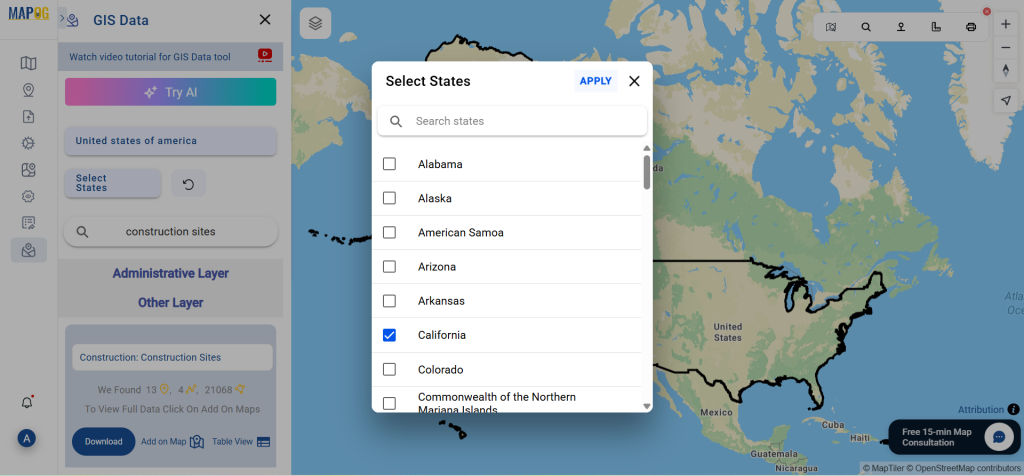
2.To begin the conversion, upload your MIF file by selecting the data you want to convert.

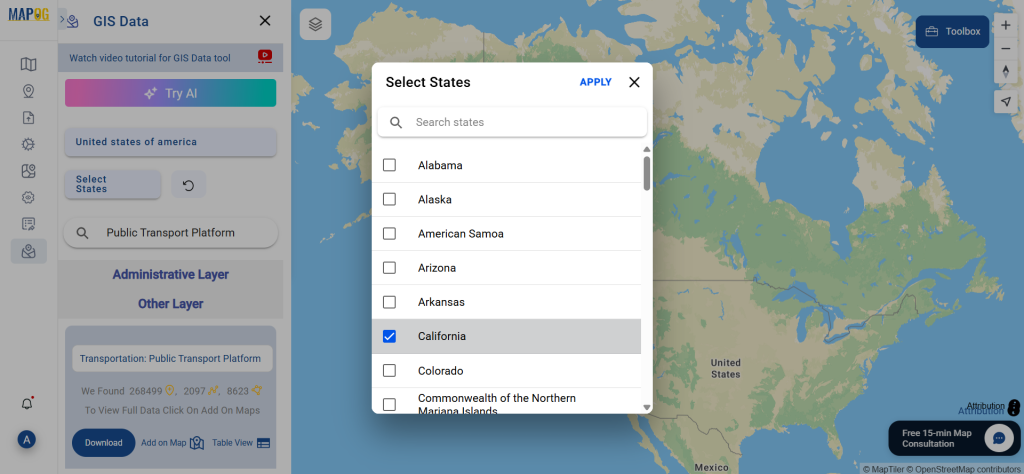
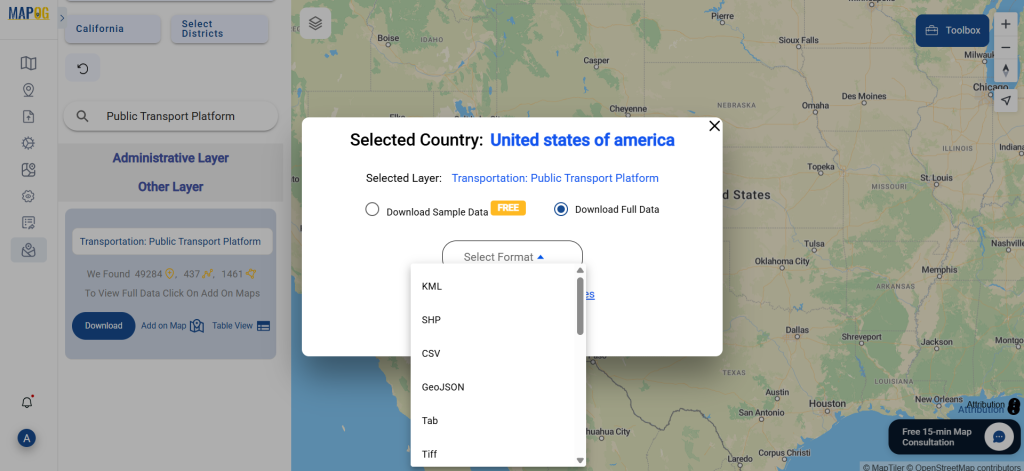
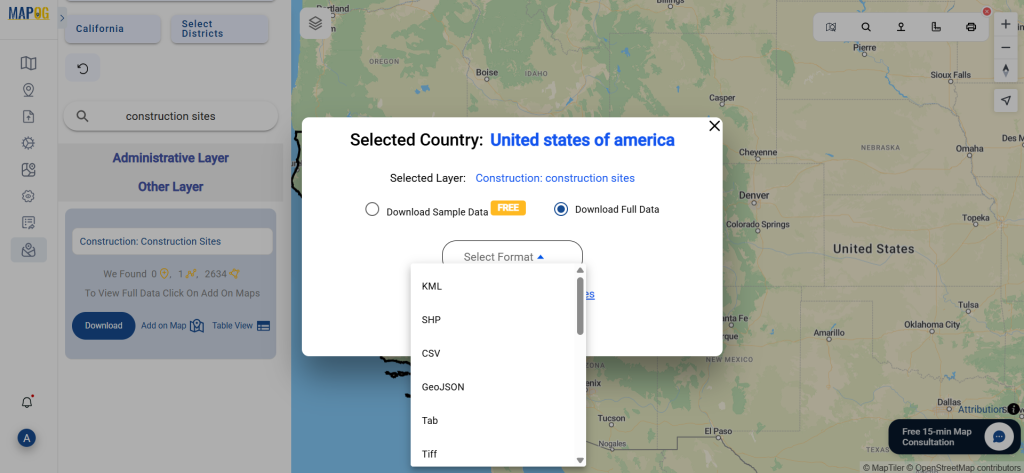
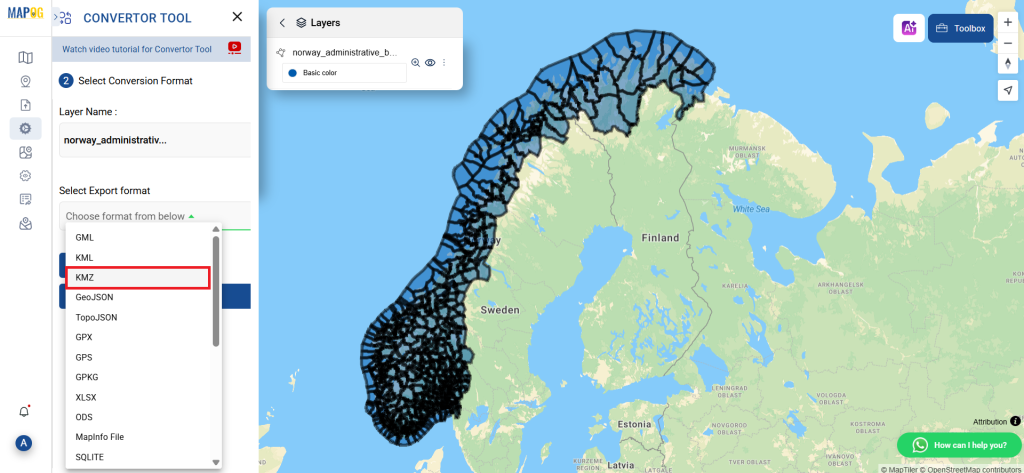
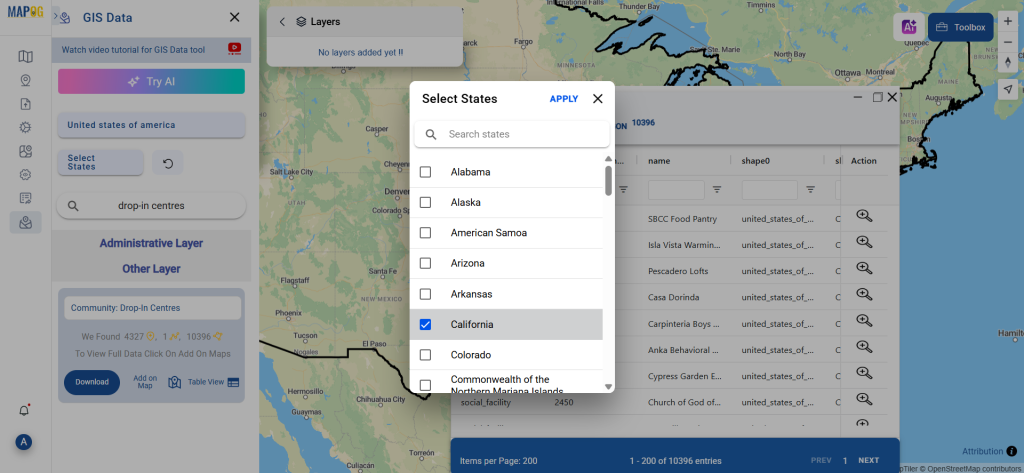
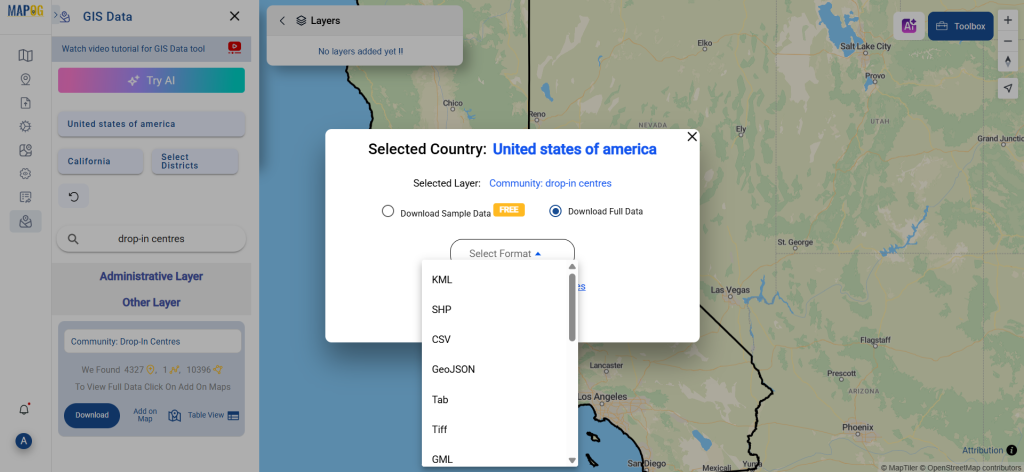
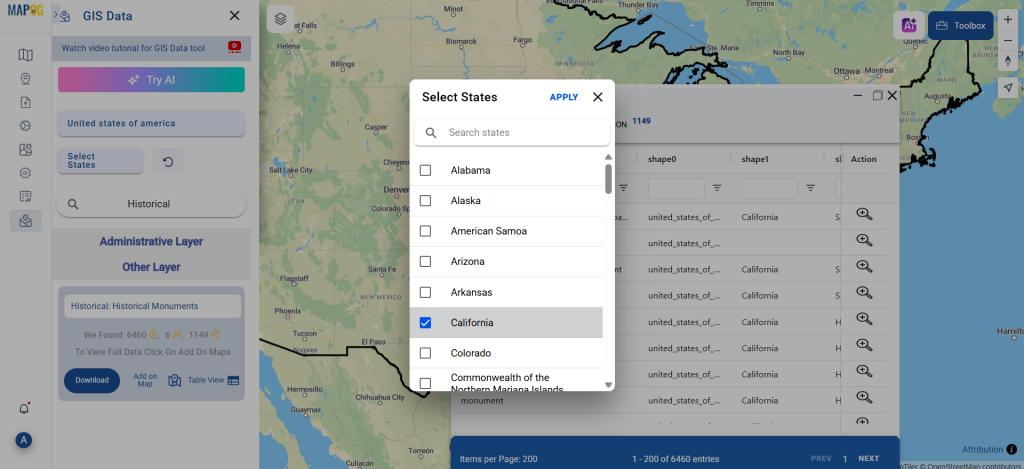
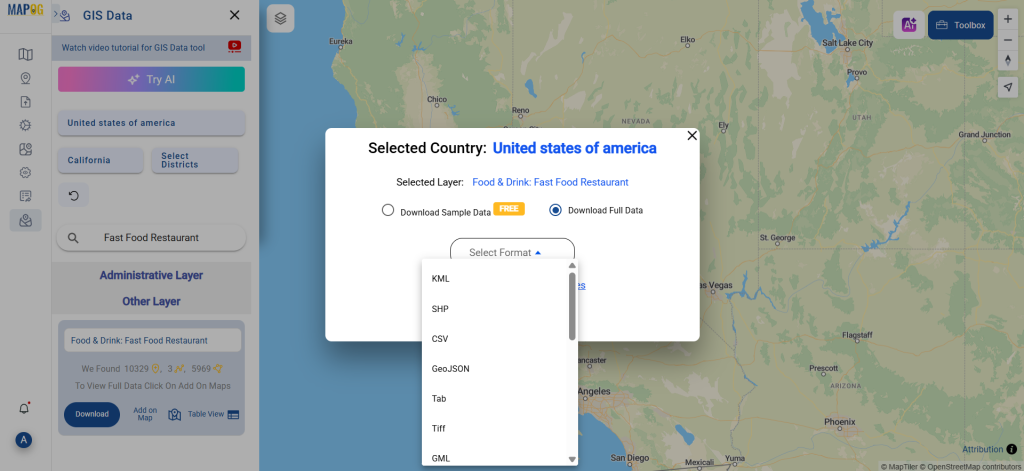
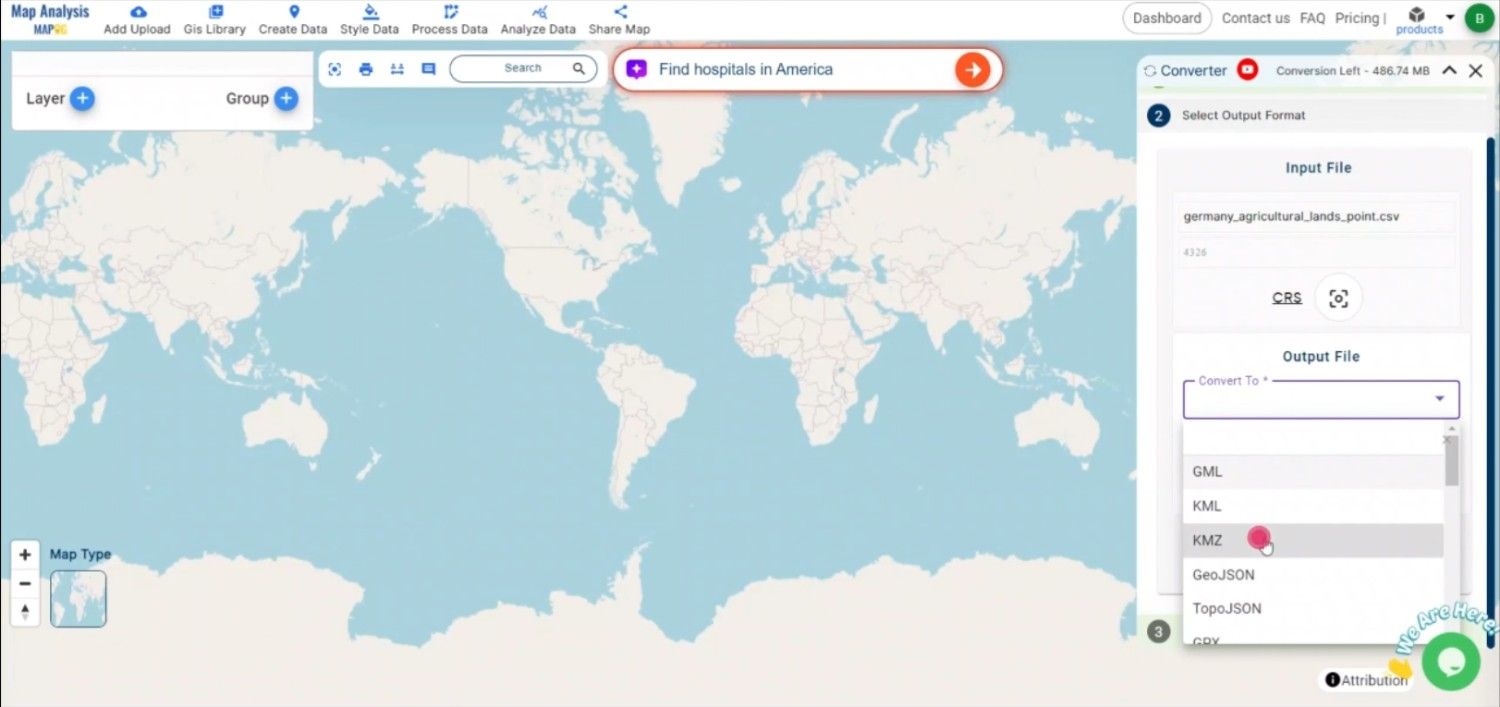
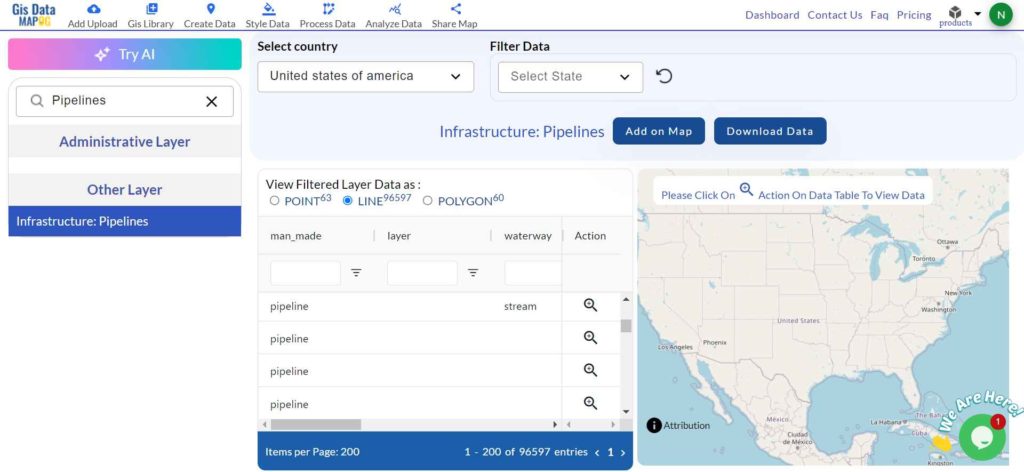
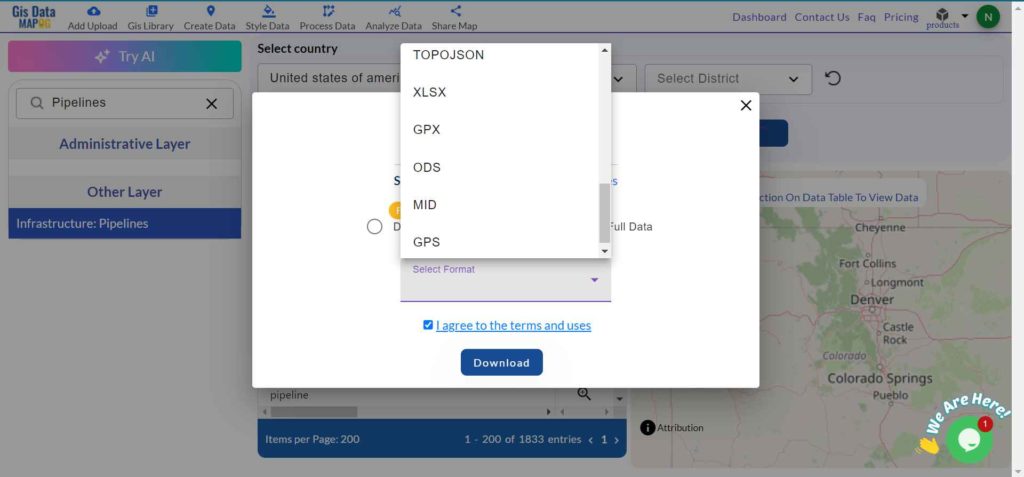
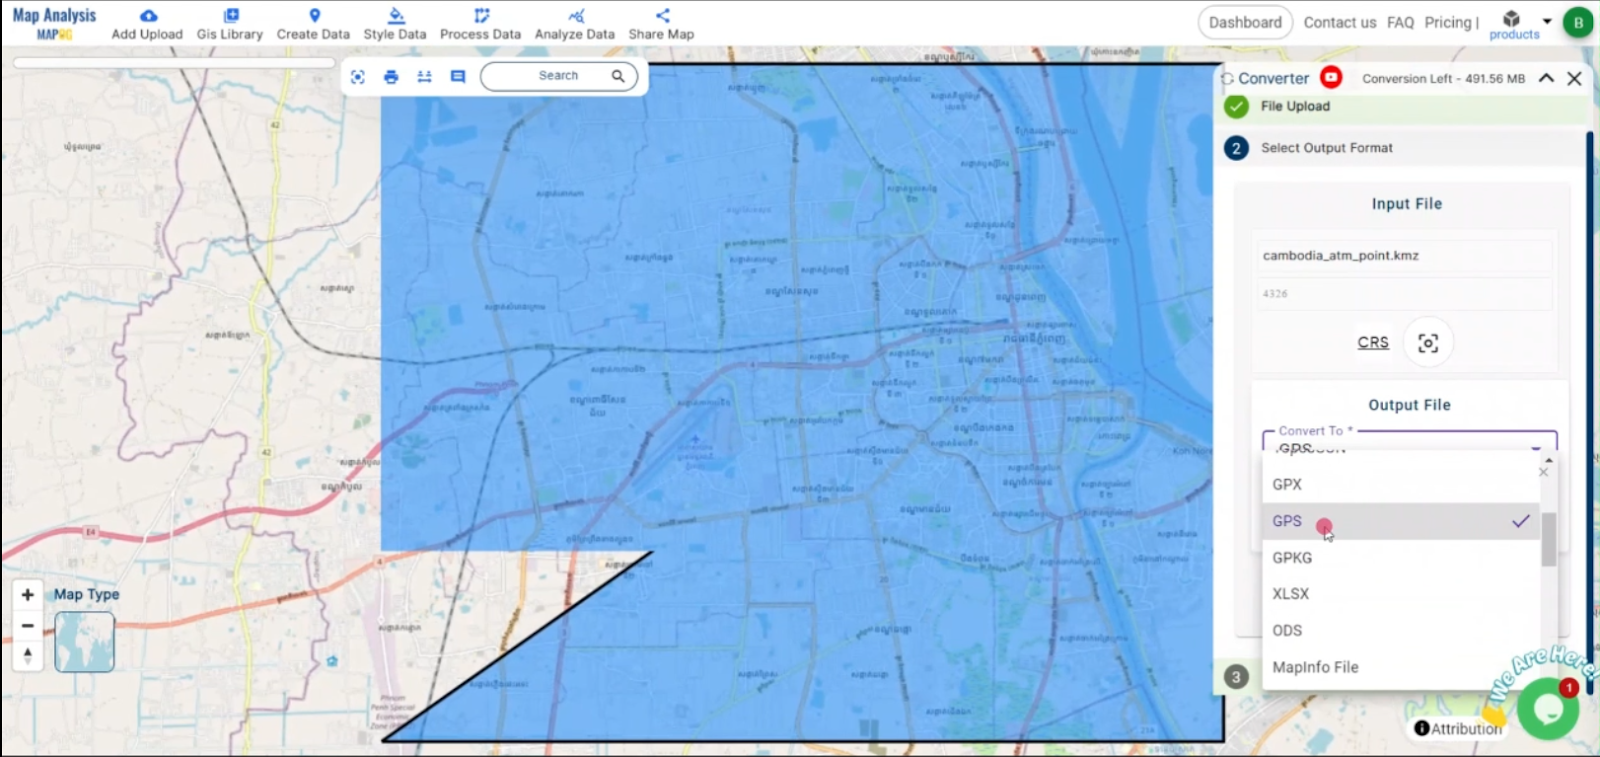
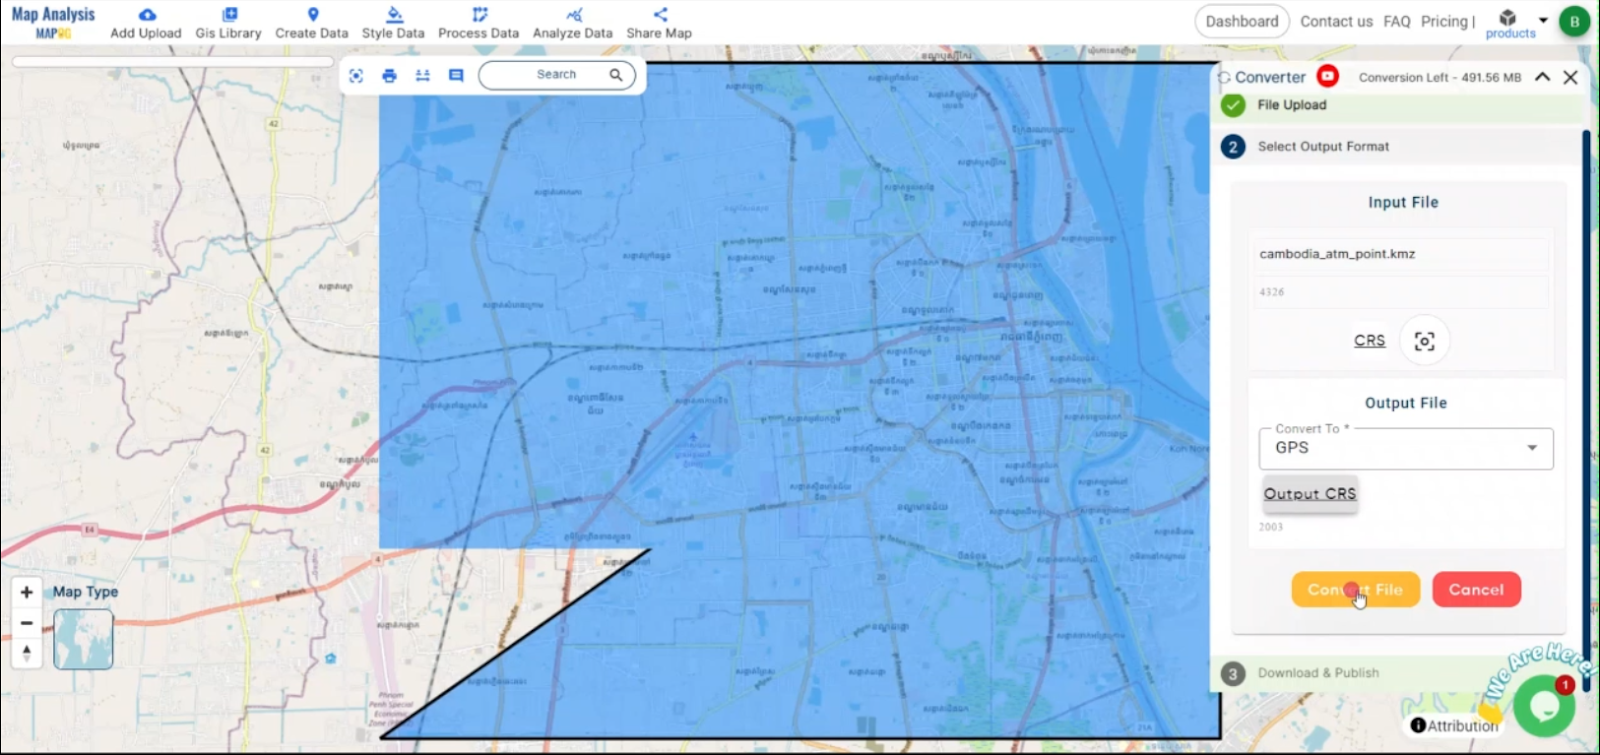
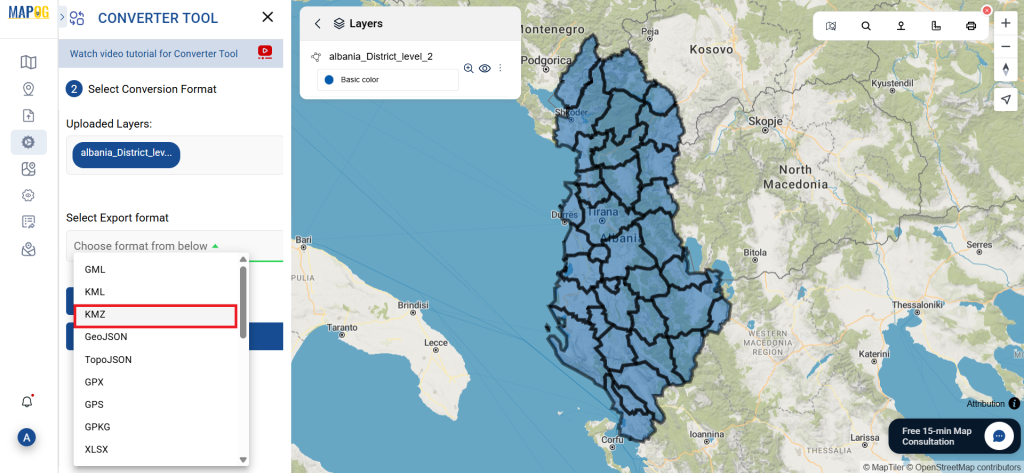
Step 2: Choose the Output Format:
Select KMZ as the output format you wish to use for exporting your data. Although the Converter Tool offers multiple format options, this guide focuses specifically on converting your file into the KMZ format.
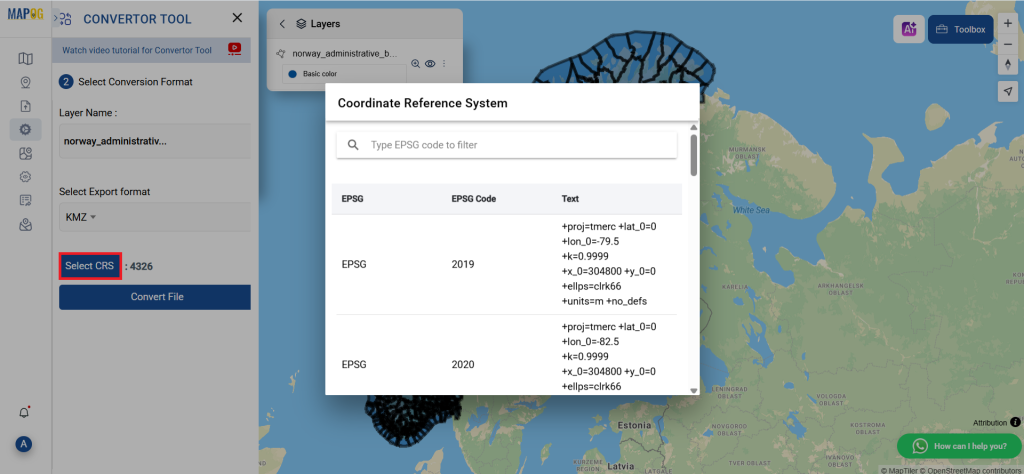
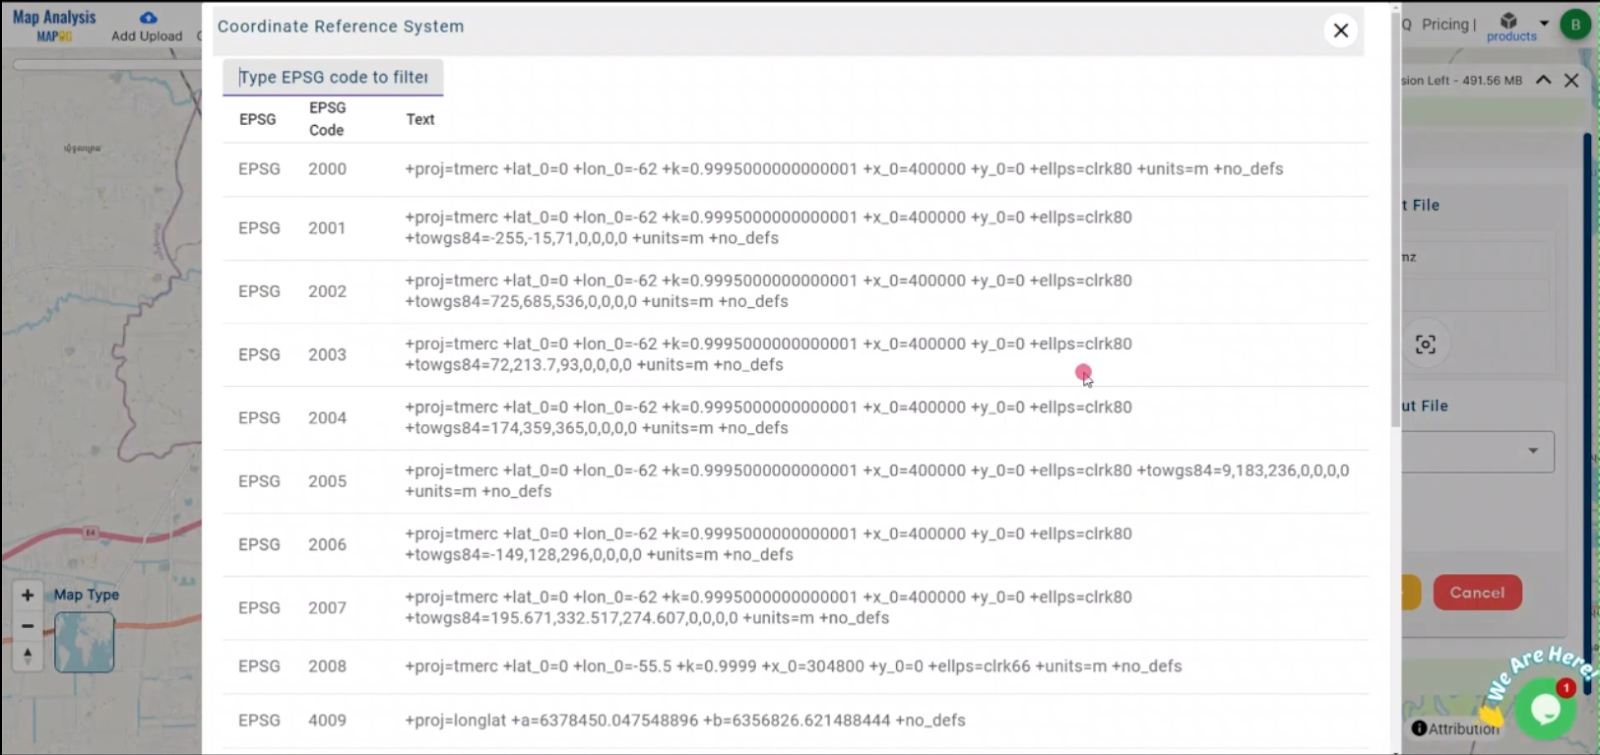
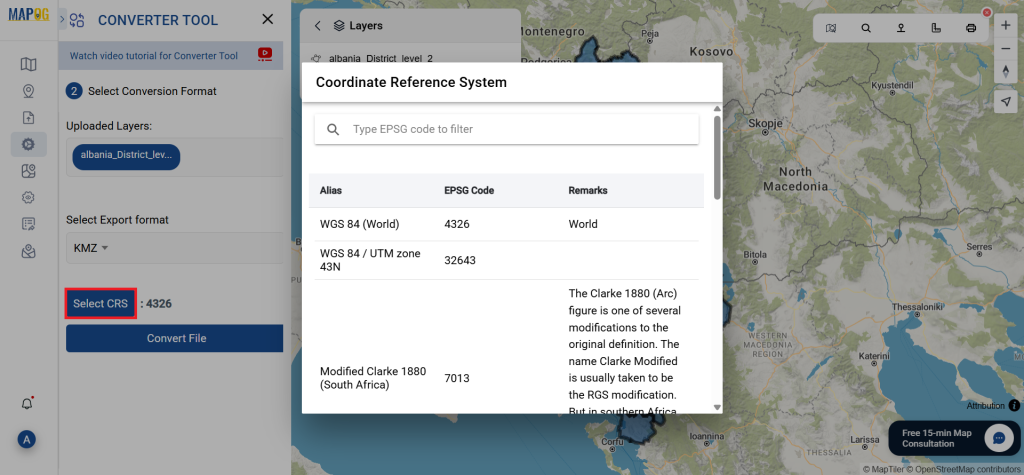
2. You can also set the Output Coordinate Reference System (CRS) according to your spatial analysis requirements.

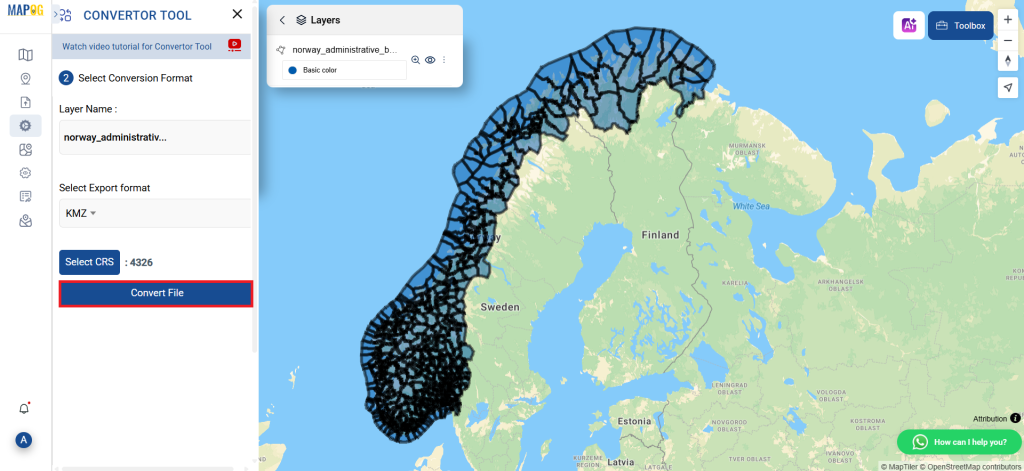
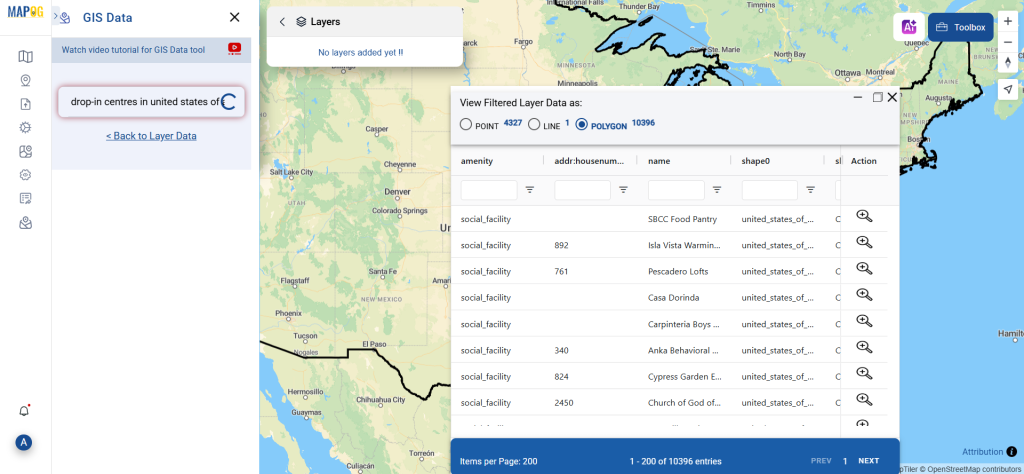
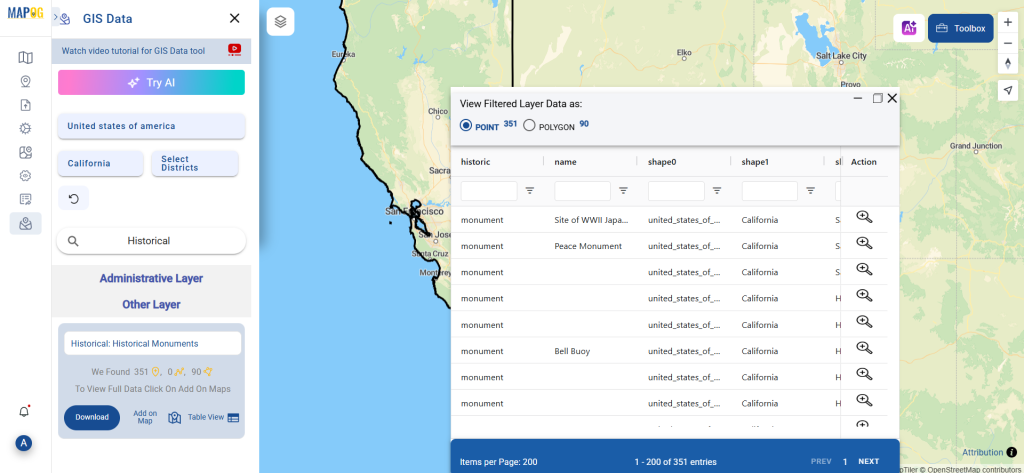
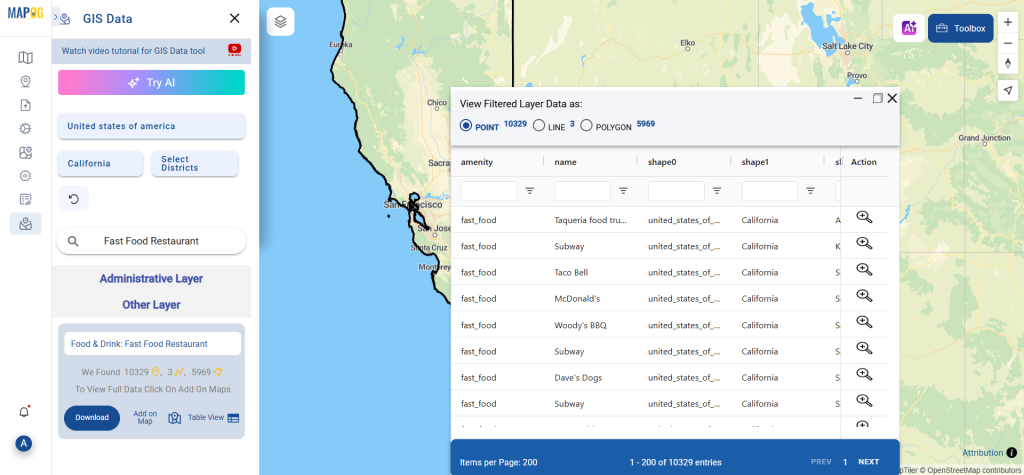
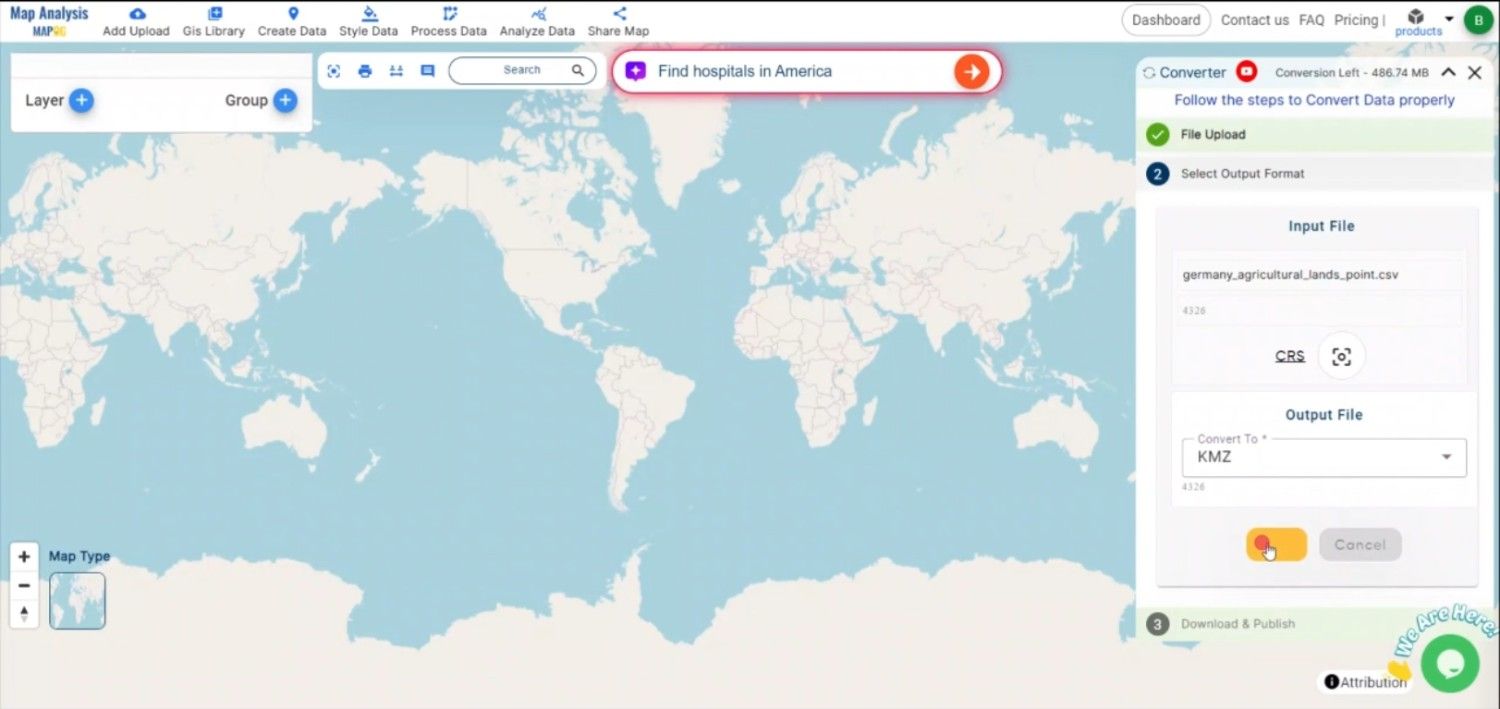
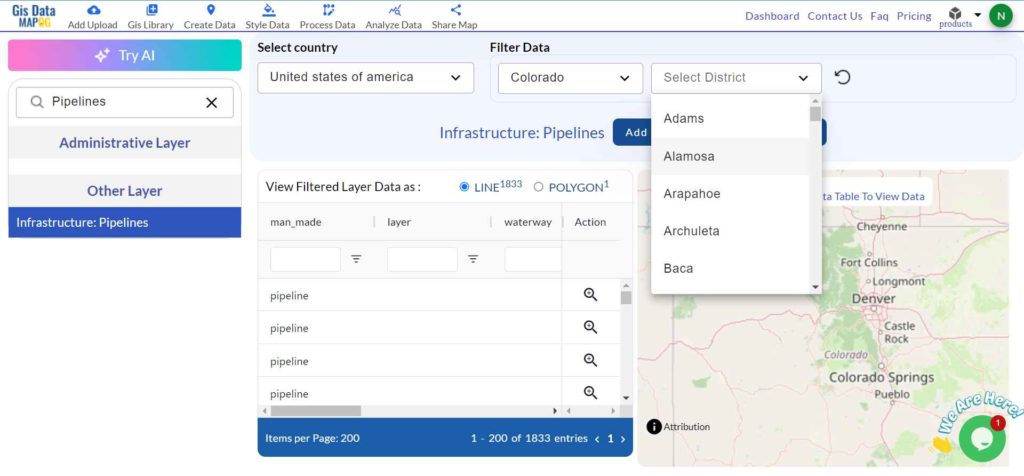
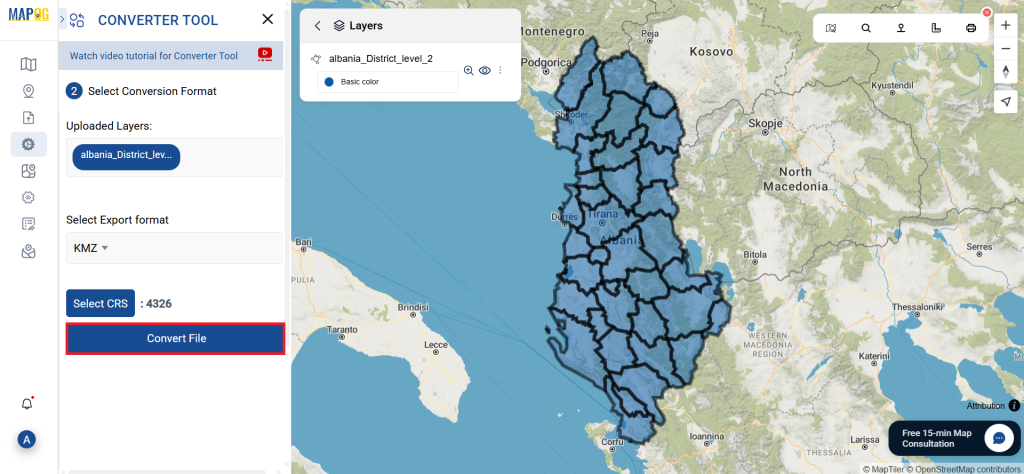
Step 3: Execute the Conversion:
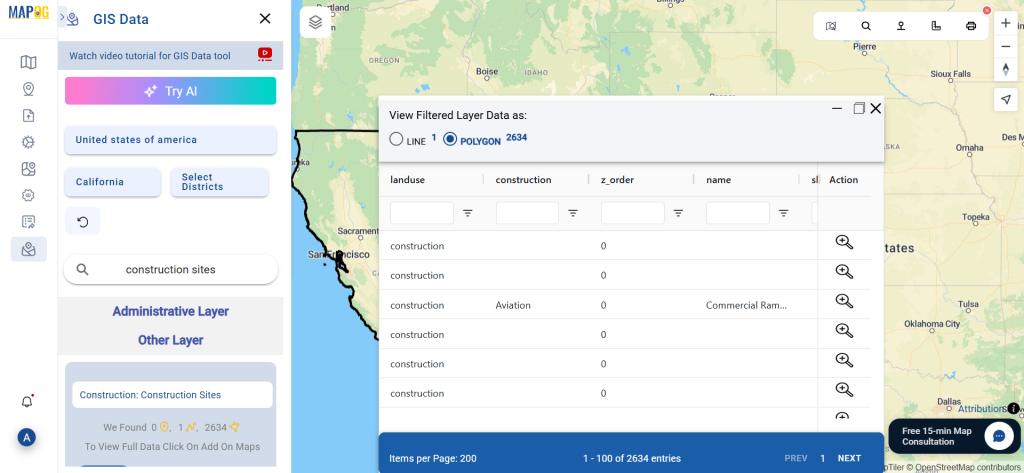
Head over to the ‘Convert Files’ section and let the tool manage the conversion for you. Simply upload your MIF file, and the Converter Tool will effortlessly transform it into KMZ format, ensuring a quick and smooth process.

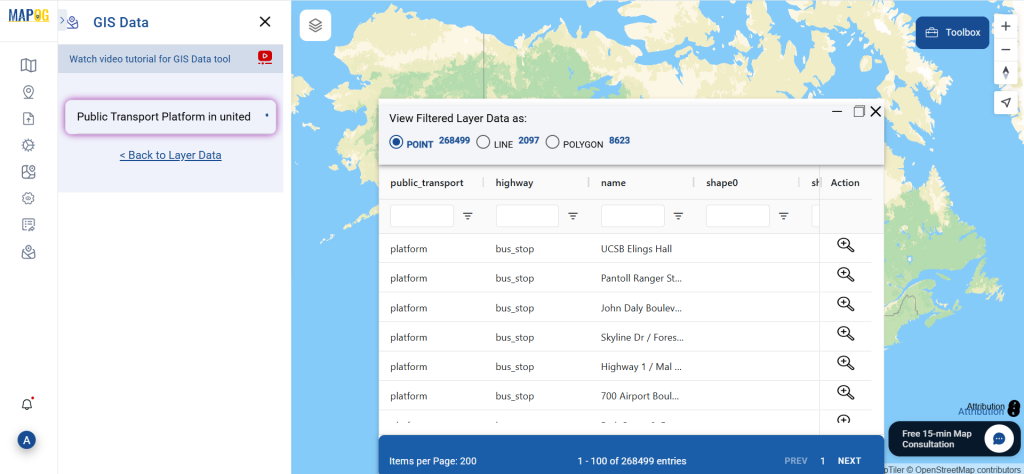
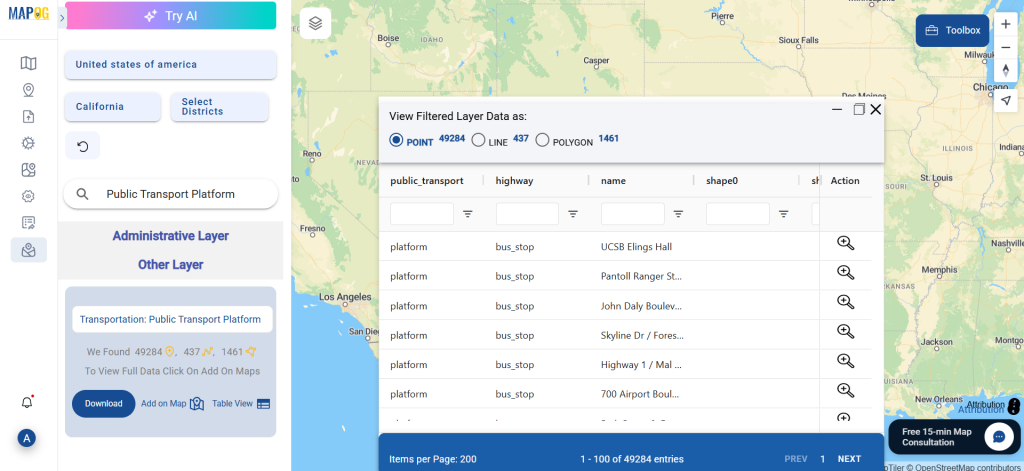
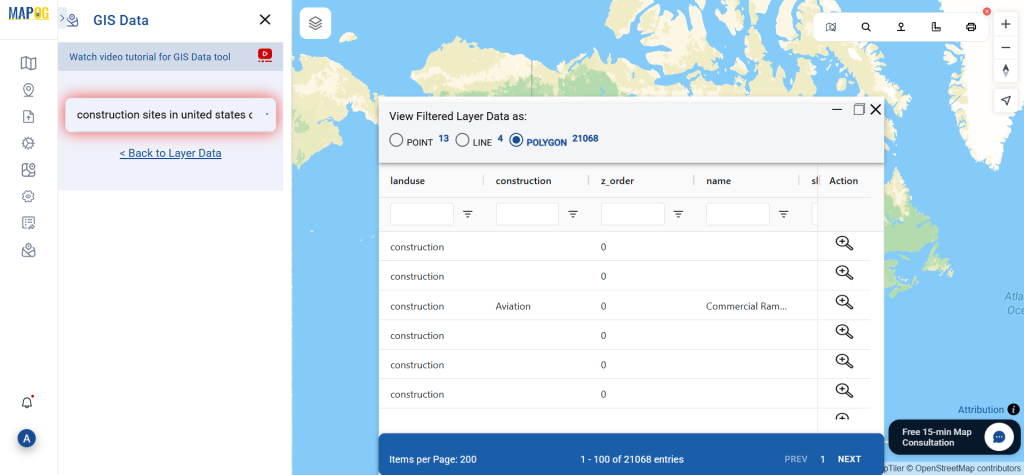
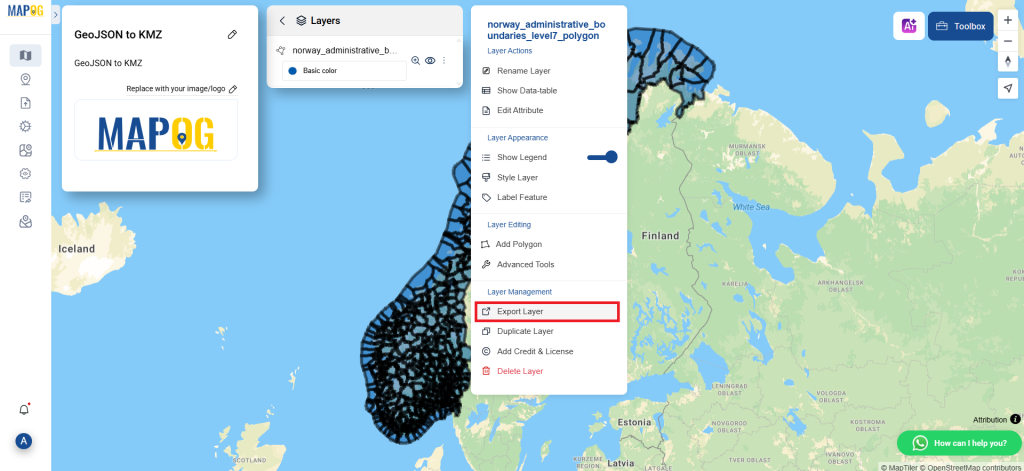
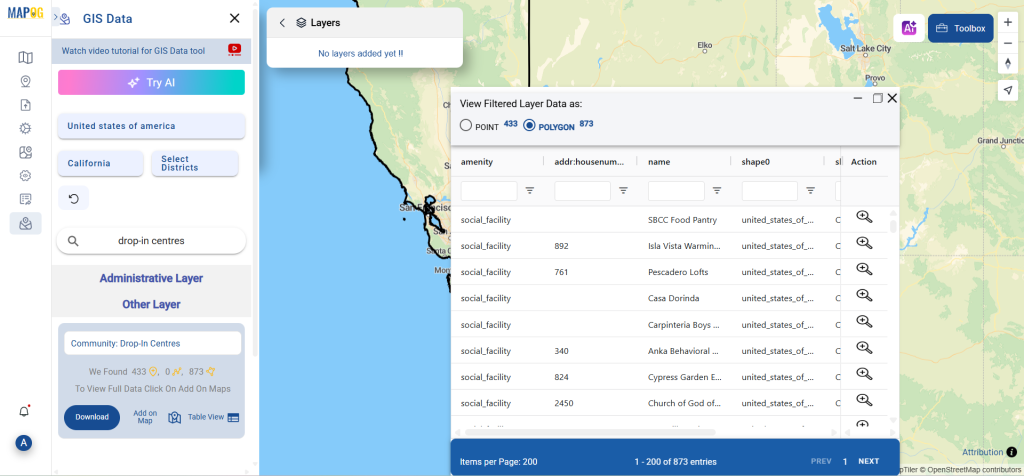
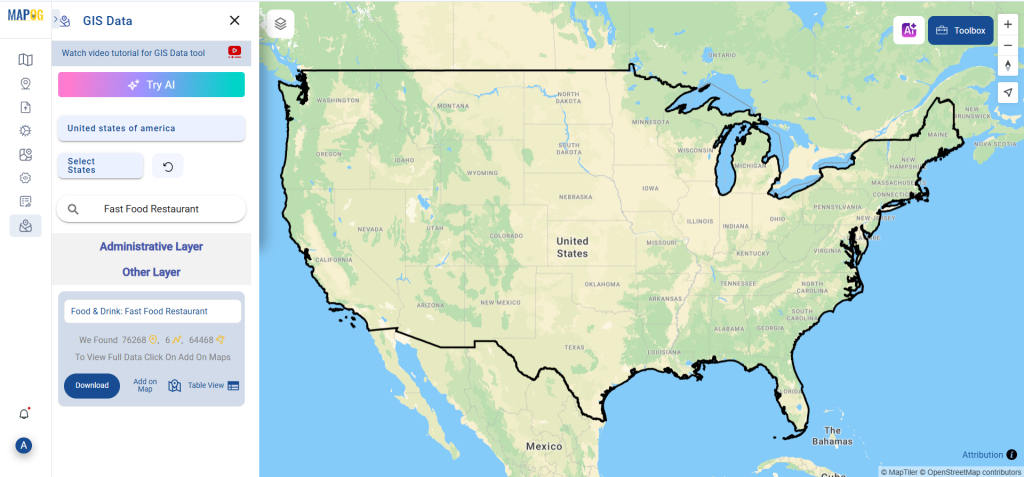
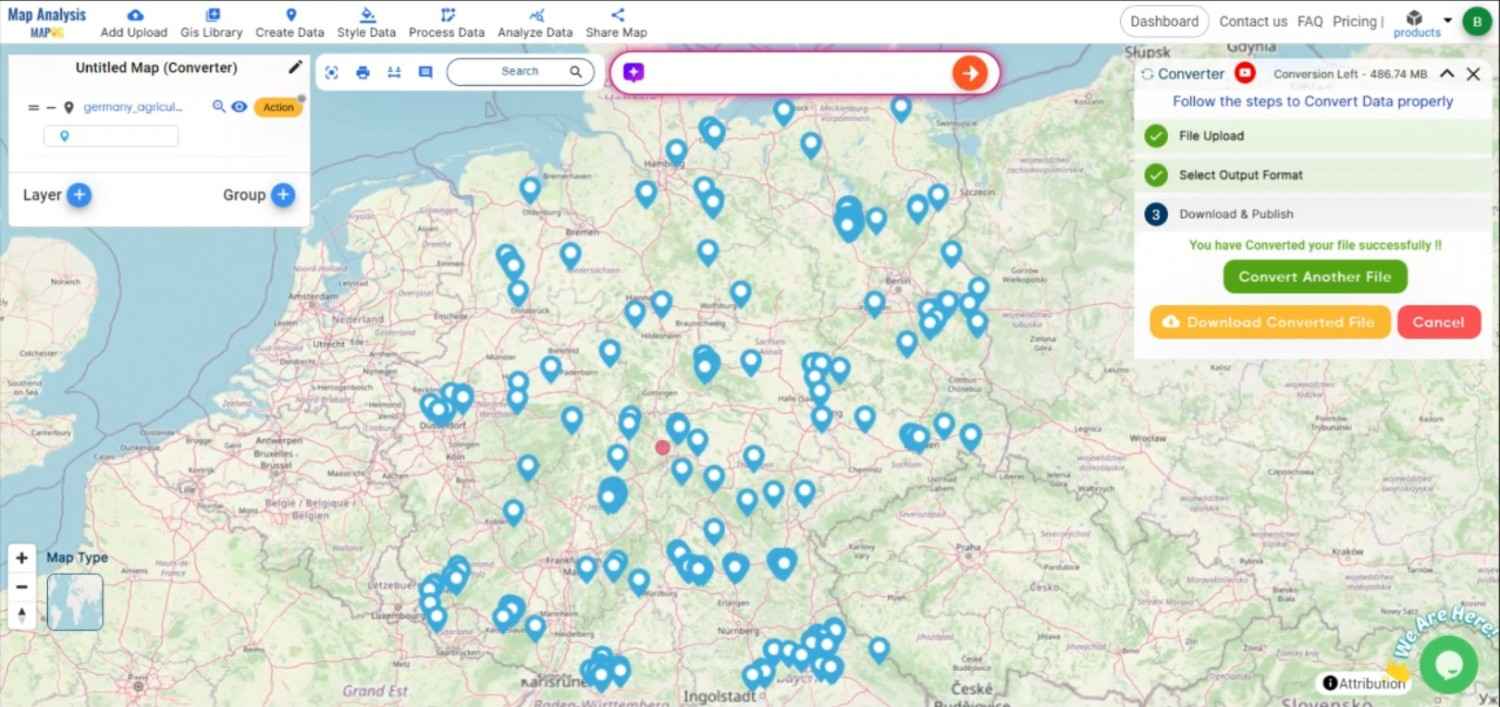
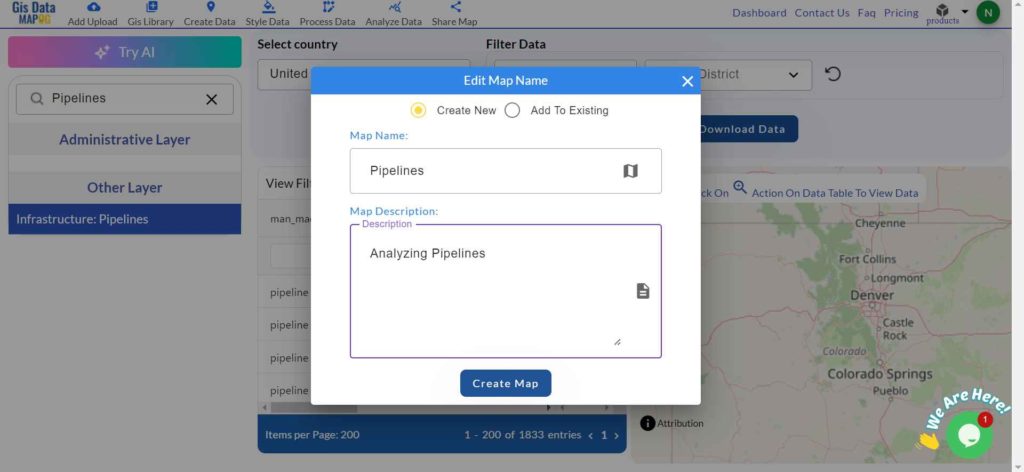
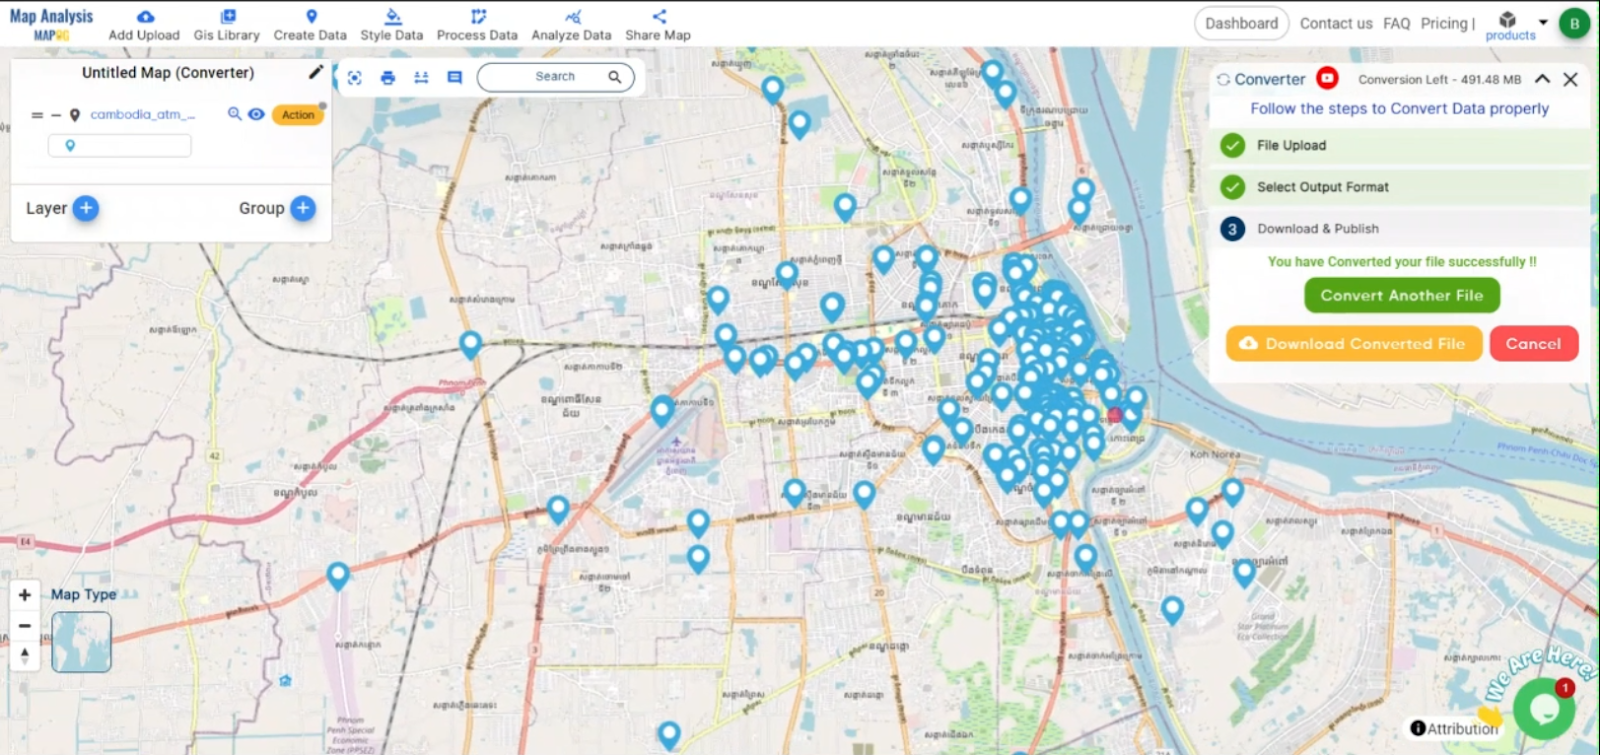
Step 4: Check and Download:
Review your converted KMZ data to verify its accuracy. Once you are satisfied that the results are correct, go ahead and download the file. This step is essential to ensure that the conversion was successful and that your data’s integrity is preserved.

Conclusion:
With MAPOG’s versatile toolkit, you can effortlessly upload vector and upload Excel or CSV data, incorporate existing layers, perform polyline splitting, use the converter for various formats, calculate isochrones, and utilize the Export Tool.
Learn More About MAPOG:
MAPOG is an ideal solution for users looking to make their data come alive with interactive and visually appealing maps. This tool enables you to craft compelling narratives that combine maps with multimedia components such as images and text. Whether you’re highlighting a project, sharing research findings, or leading a virtual tour, MAPOG simplifies the process of creating content that can be easily shared and enjoyed by others.
You might also find these blogs helpful:
- Convert Online GIS data : KML to PDF file
- Converting KML to GeoTIFF , Online Gis Data Converter
- Converting KMZ to SHP : Online GIS Data Conversion
- Converting TopoJSON to SHP Online : GIS Data Converter
- Converting GeoJSON to TopoJSON with MAPOG
- Converting GeoJSON to CSV with MAPOG
- Converting KMZ to KML with MAPOG
- Converting GML to KML with MAPOG
- Convert KMZ to TopoJSON Online
- Converting KMZ to GeoJSON Online
- Convert KML to MID Online