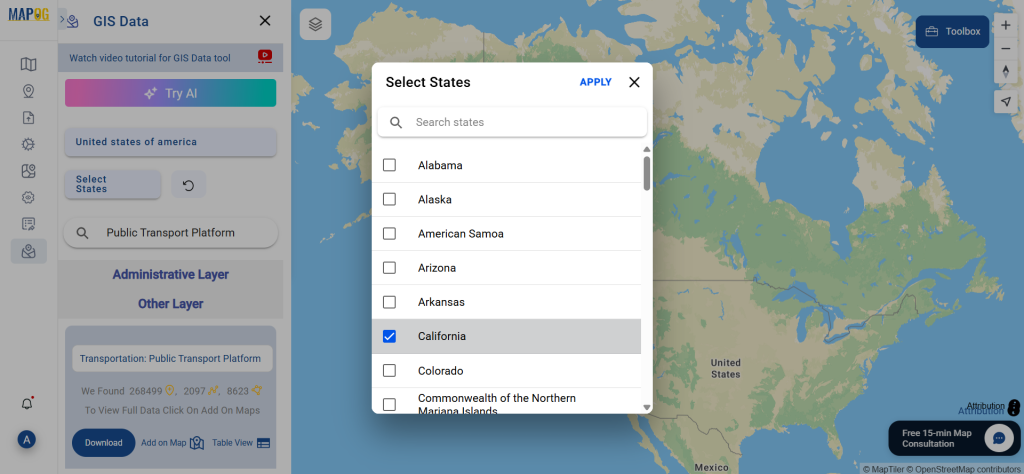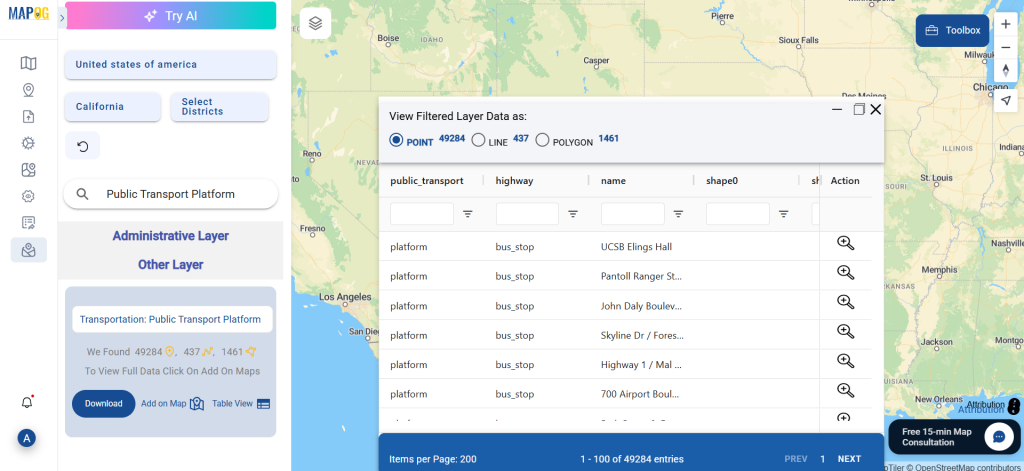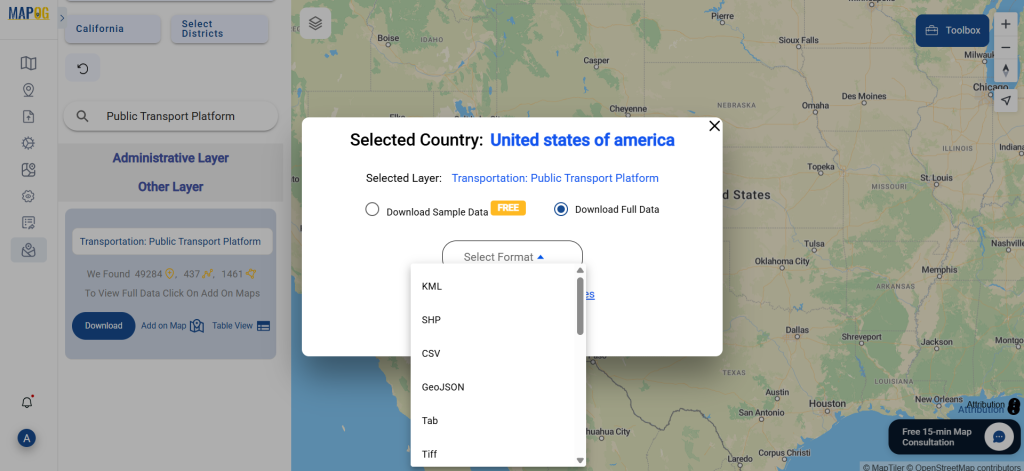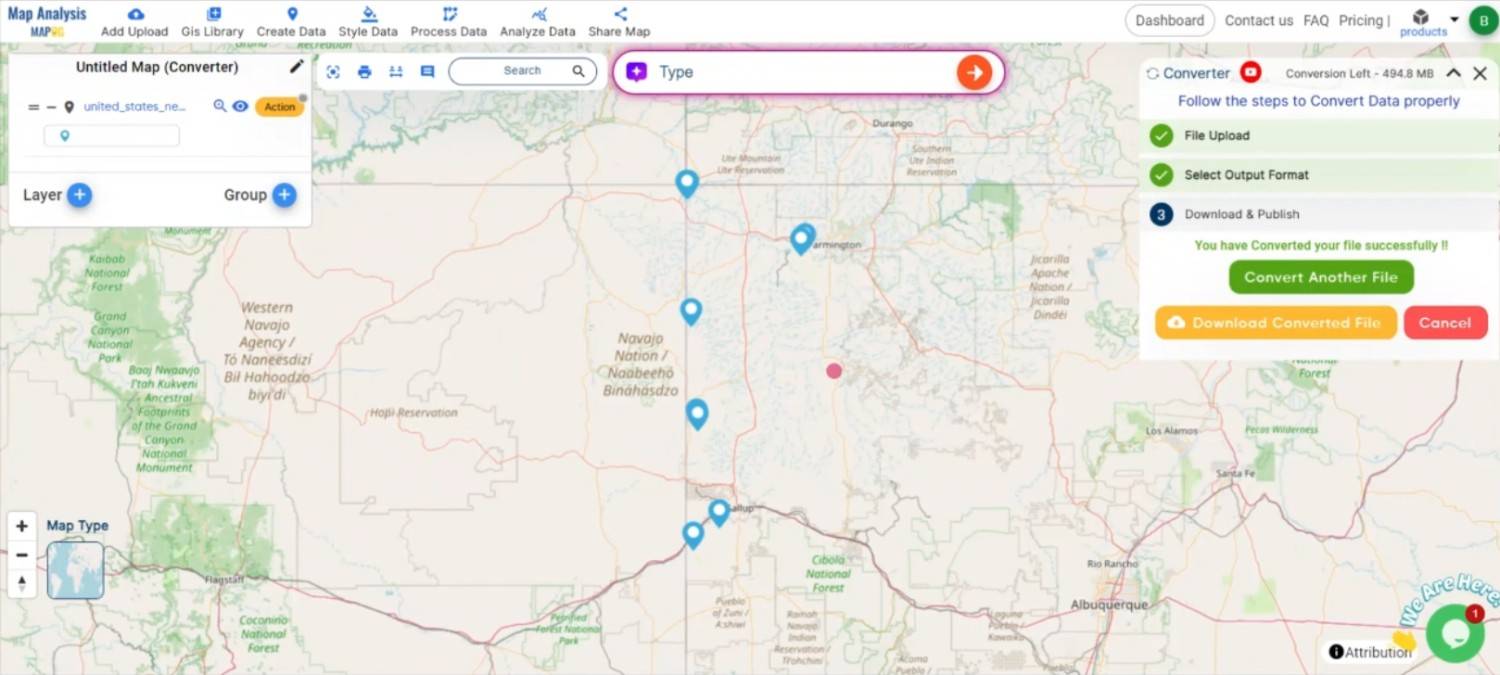
This tutorial will guide you through convert DXF file to KMZ format using the Converter Tool in MAPOG. Whether you’re a MAPOG novice or an experienced user, this step-by-step guide will make the conversion process straightforward, helping you confidently transform your DXF file into KMZ format.
Key Concept to Converting Files:
The Converter Tool in MAPOG serves as a key mechanism for converting data between two different formats. Imagine it as a smooth transition where you provide data in one format, and it efficiently transforms it into another format tailored to your analytical requirements. Additionally, GIS data can be exported in multiple formats, enhancing its versatility and applicability across different uses.
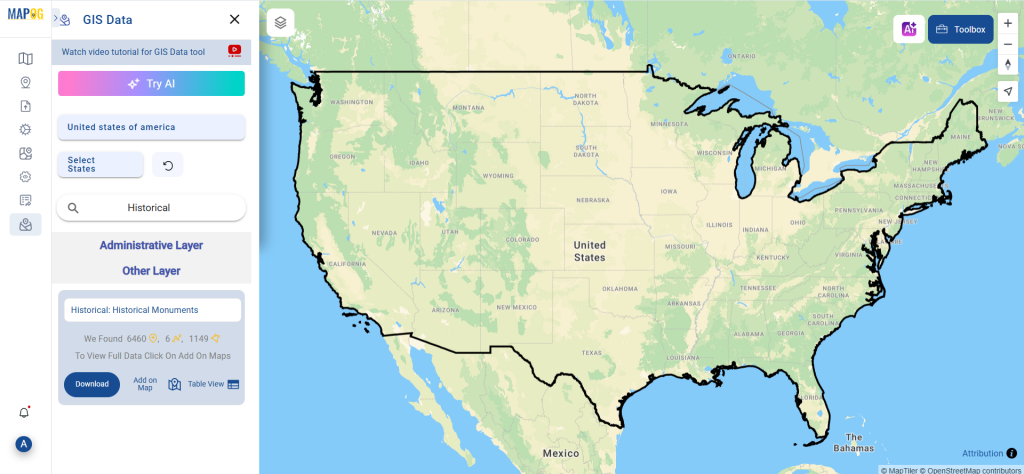
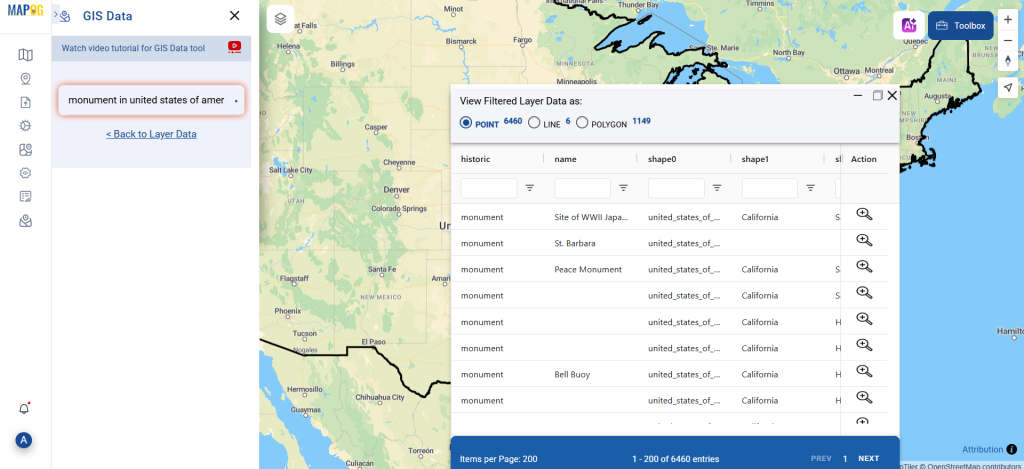
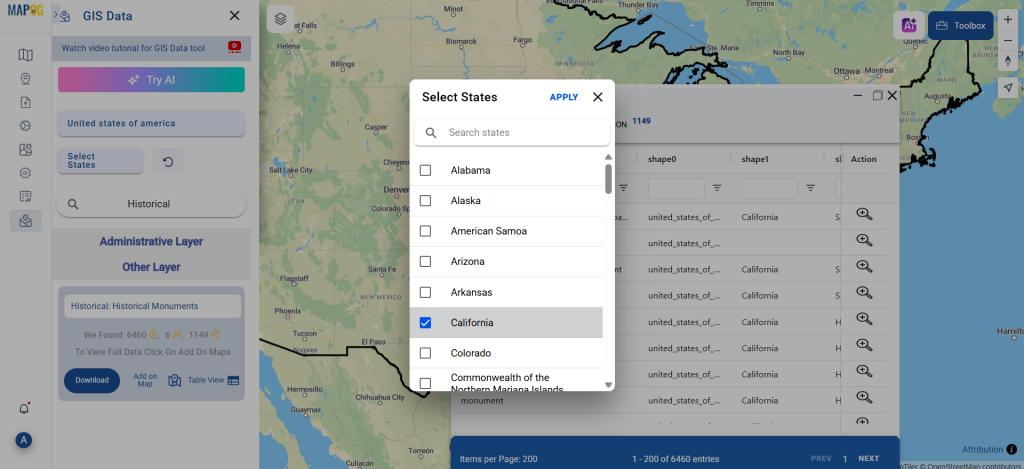
Step 1: Upload Your Data:
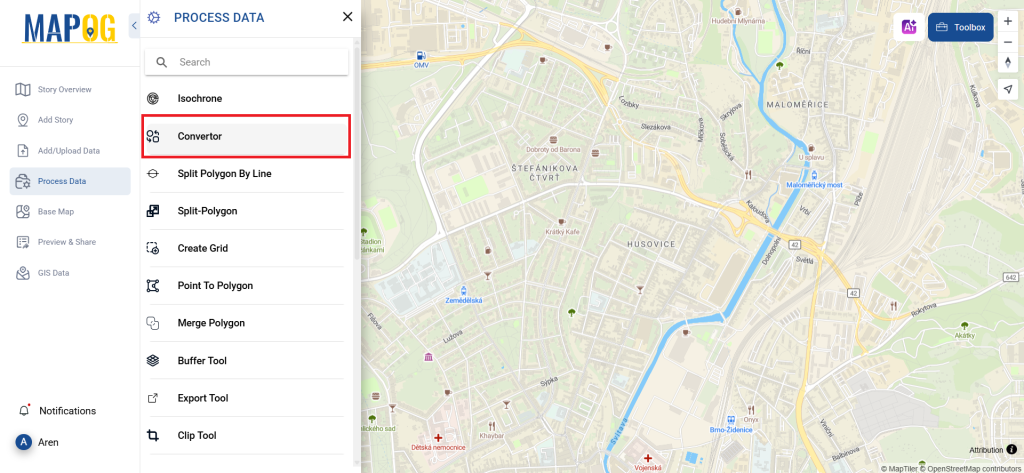
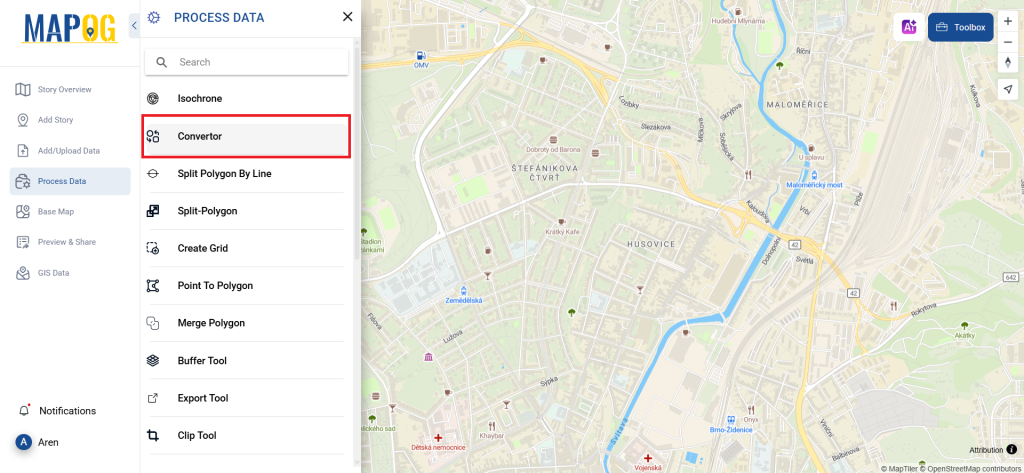
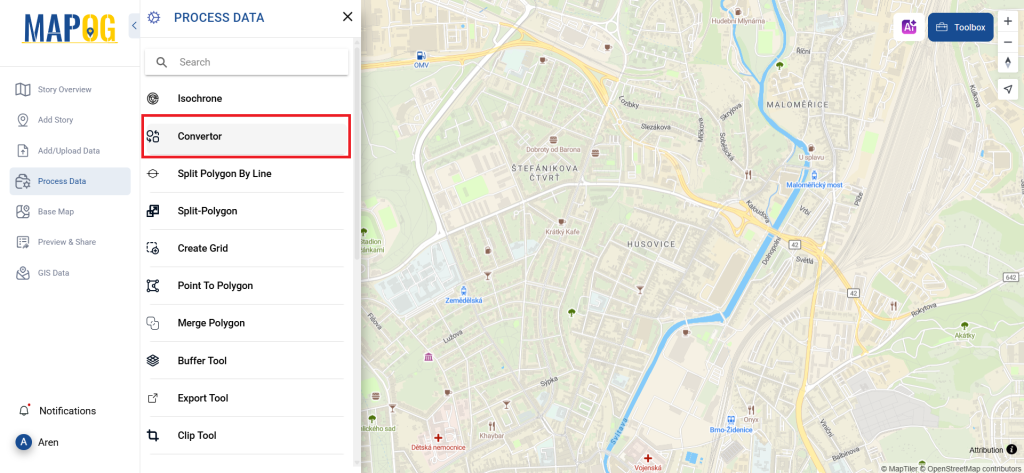
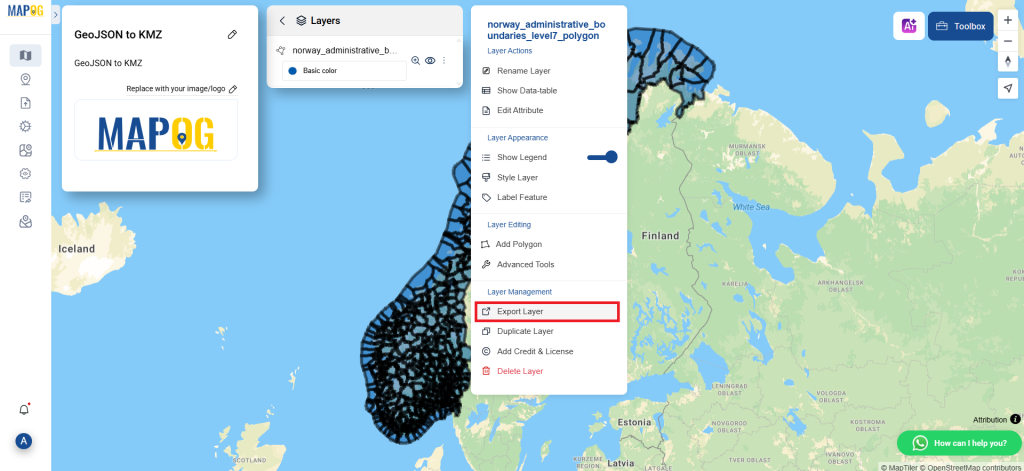
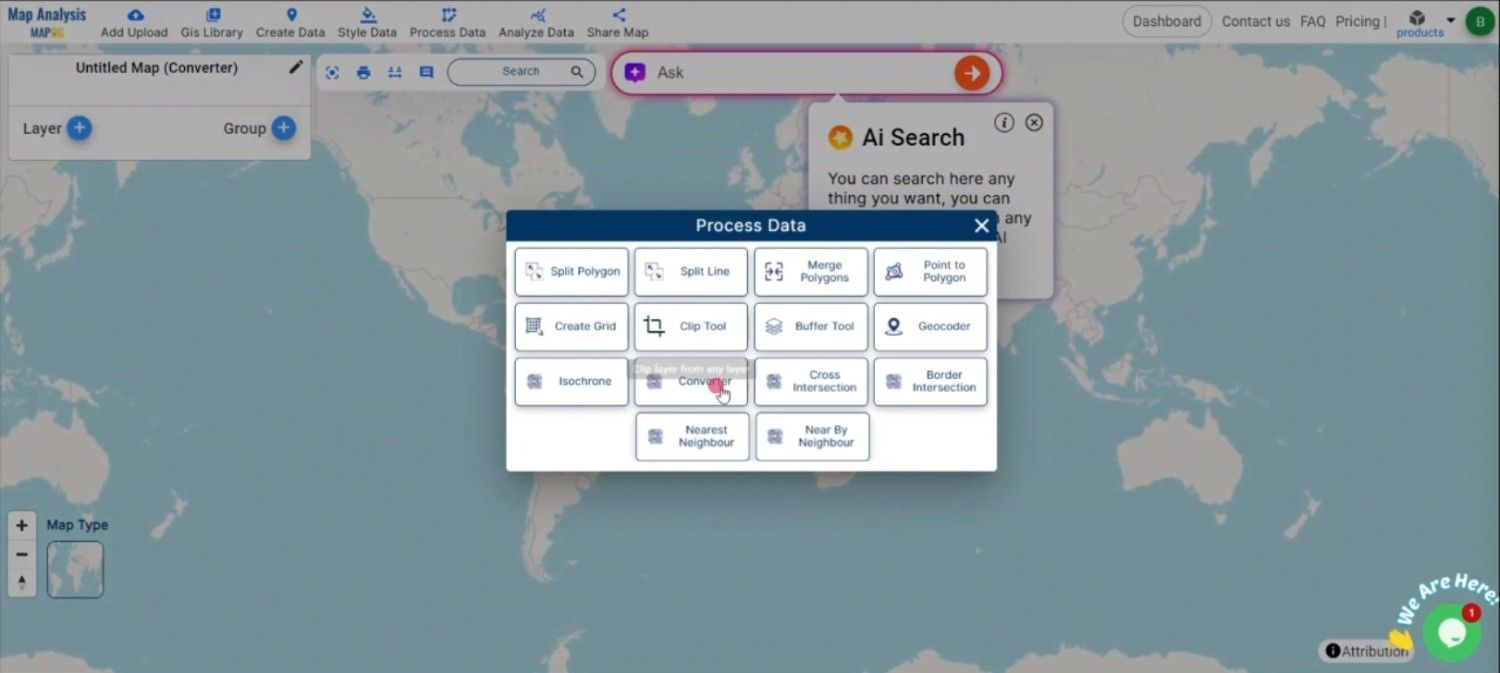
1. Navigate to “Process Reference Layers” and select the “Converter Tool” option.
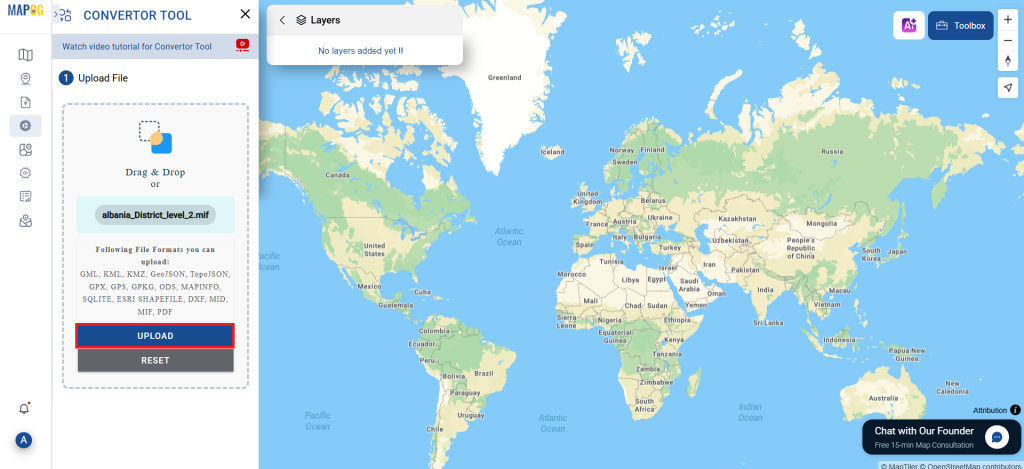
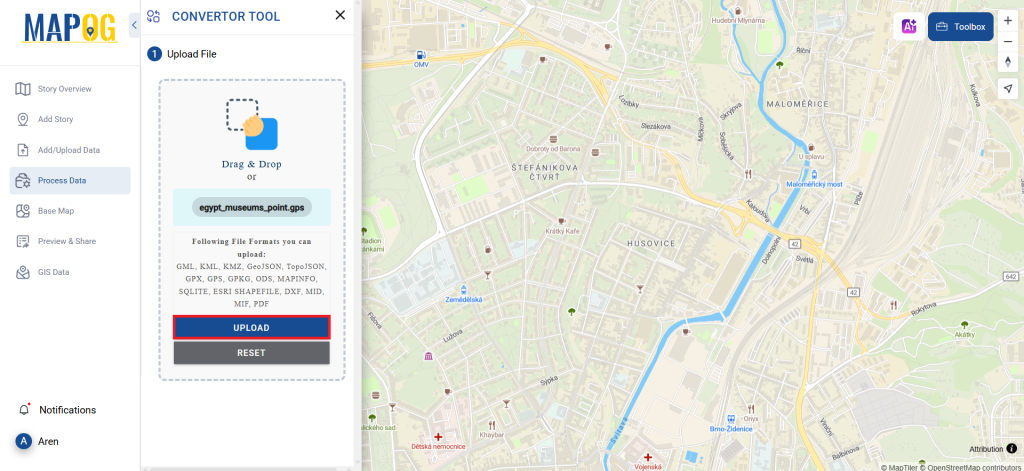
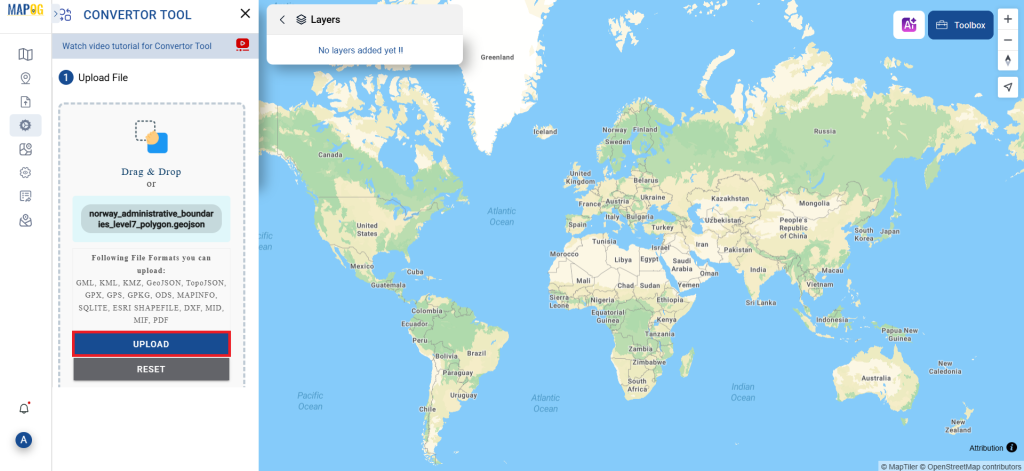
2. Upload your DXF file. This is where you begin by supplying the data that you want to convert.
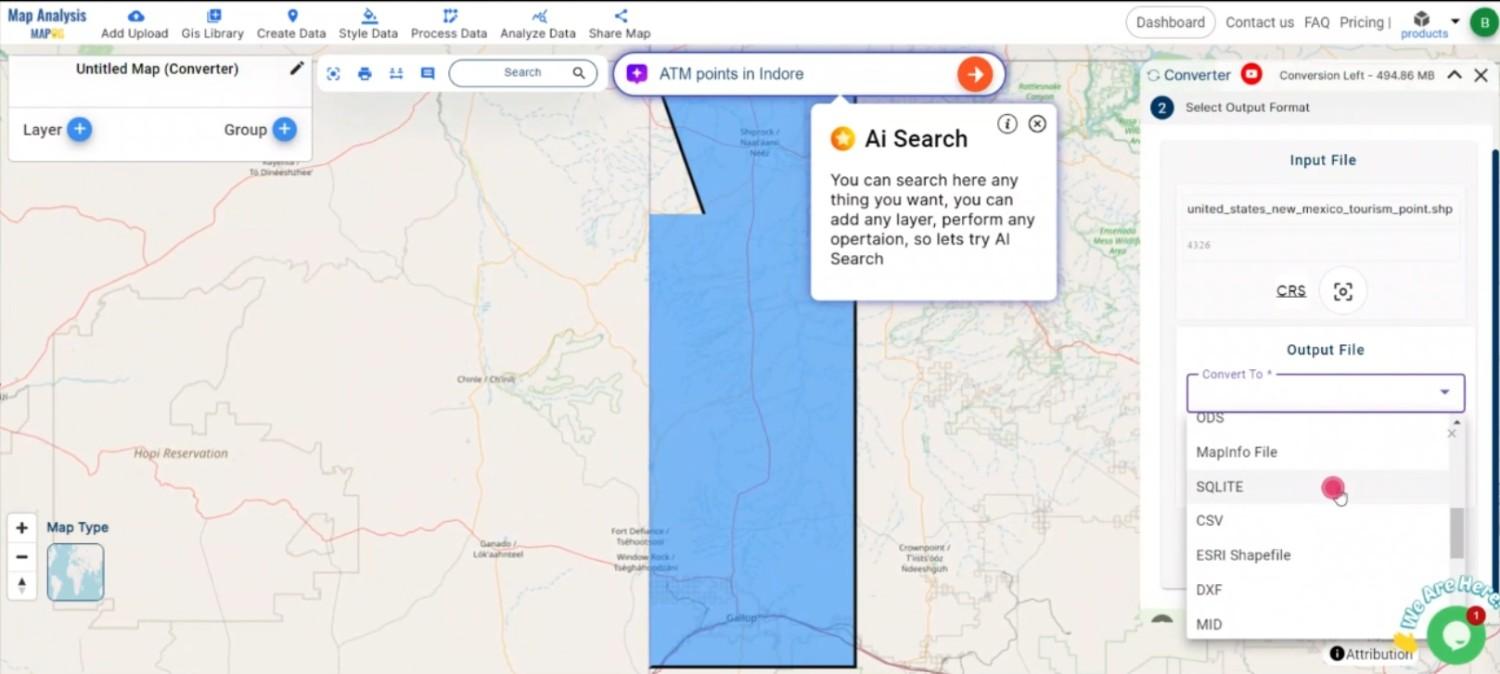
Step 2: Choose the Conversion Format:
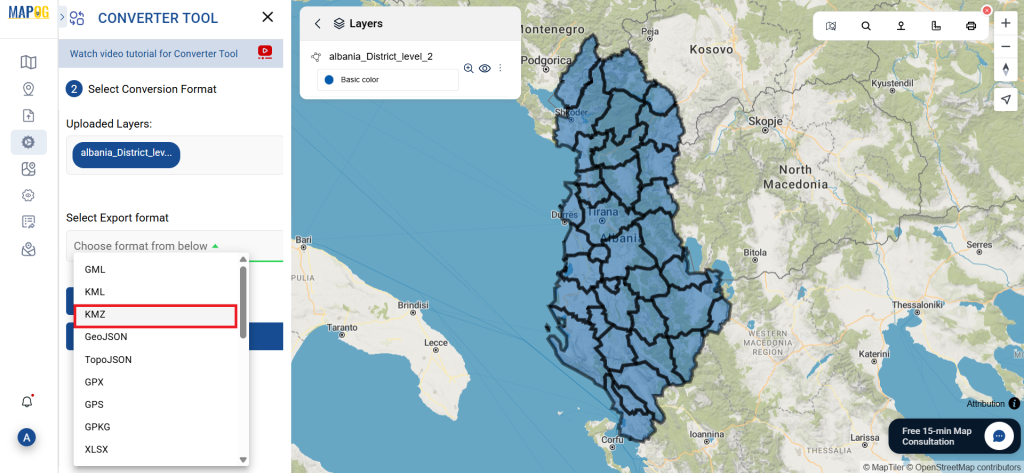
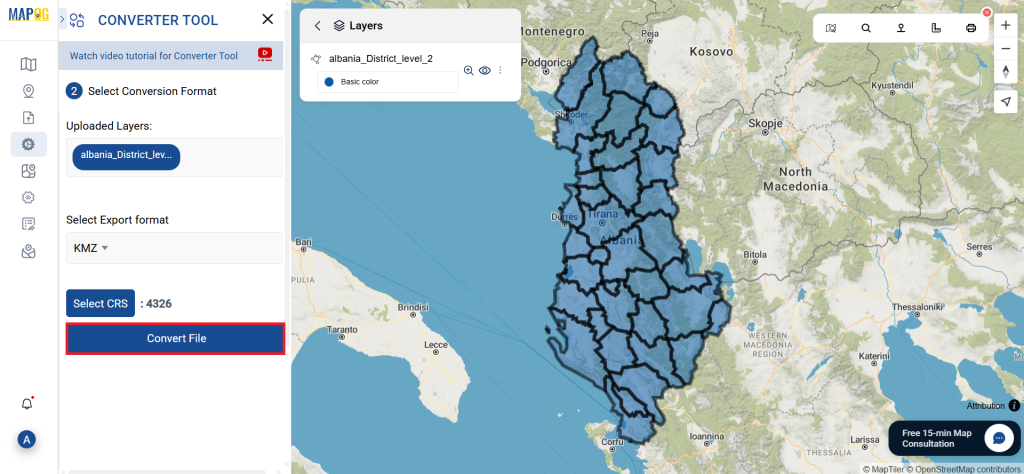
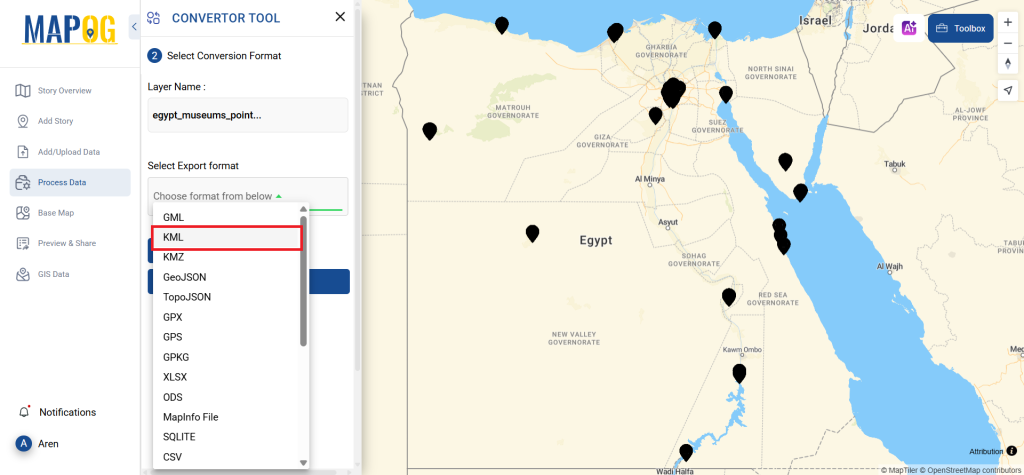
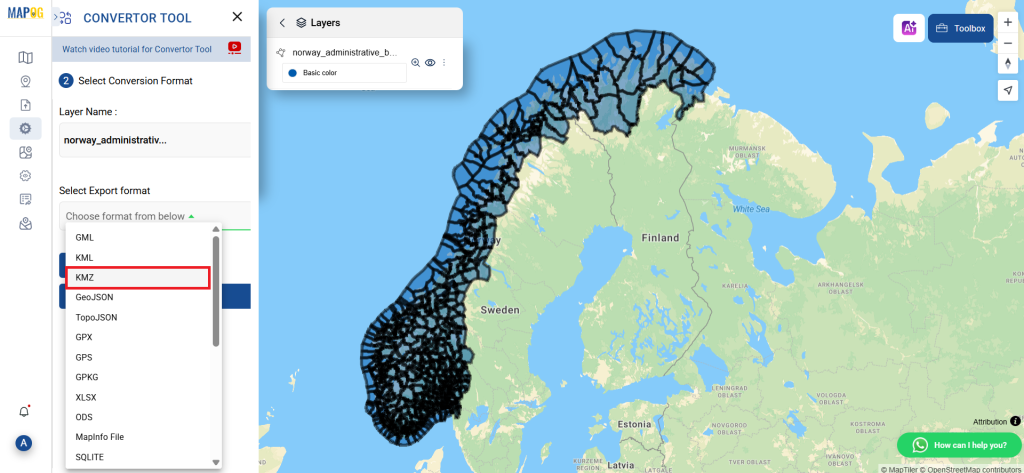
Select KMZ as the output format if you intend to export just the data. Although the tool provides several options to achieve this, this guide specifically focuses on converting the file to KMZ.
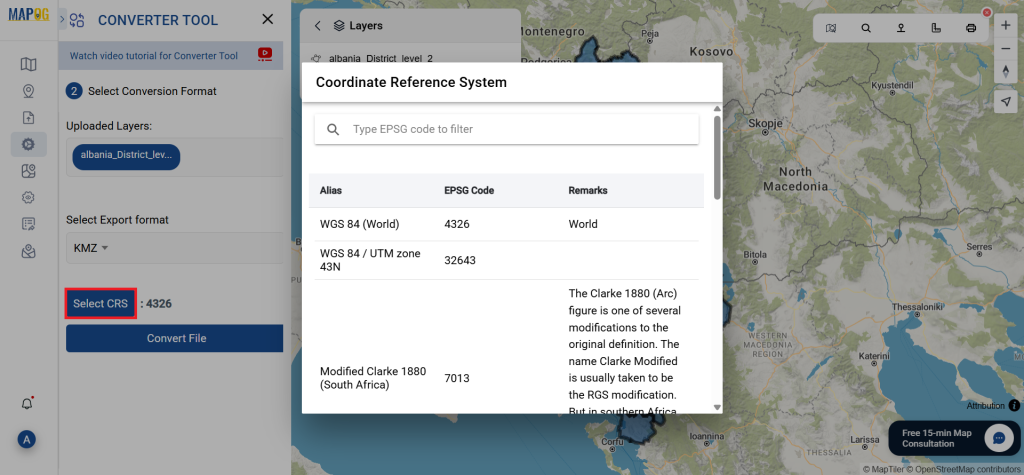
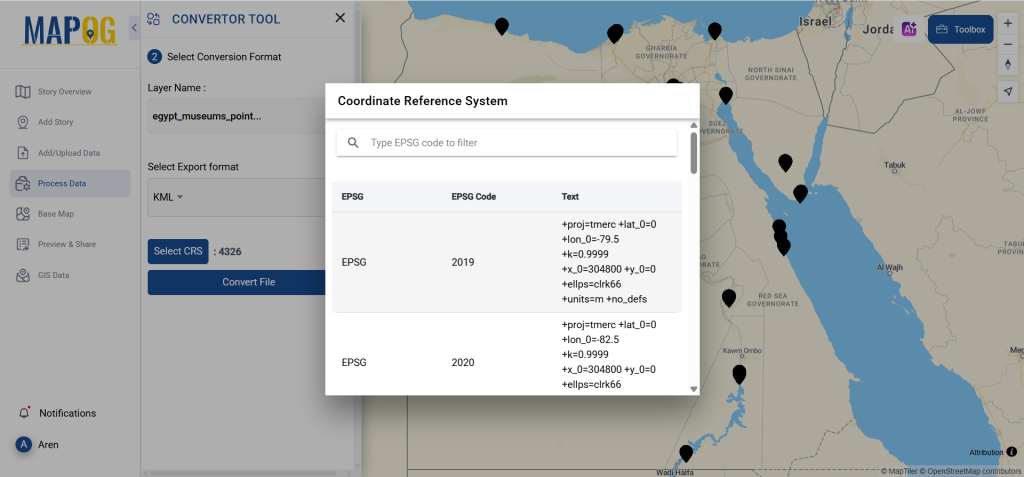
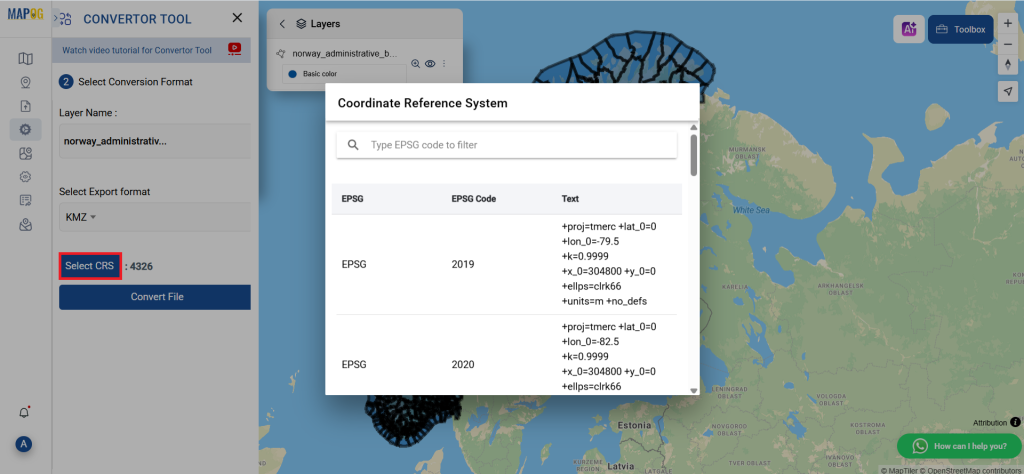
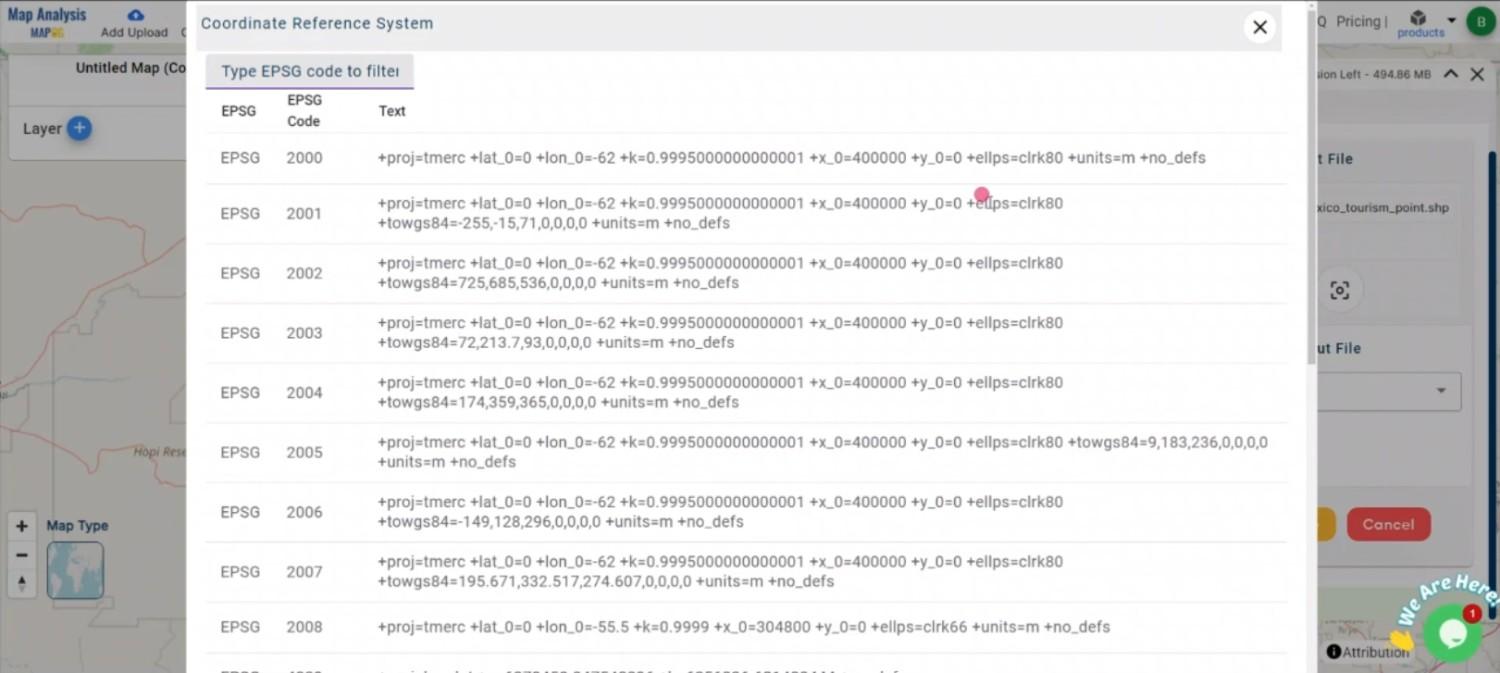
You can also set the Output CRS as per your need.
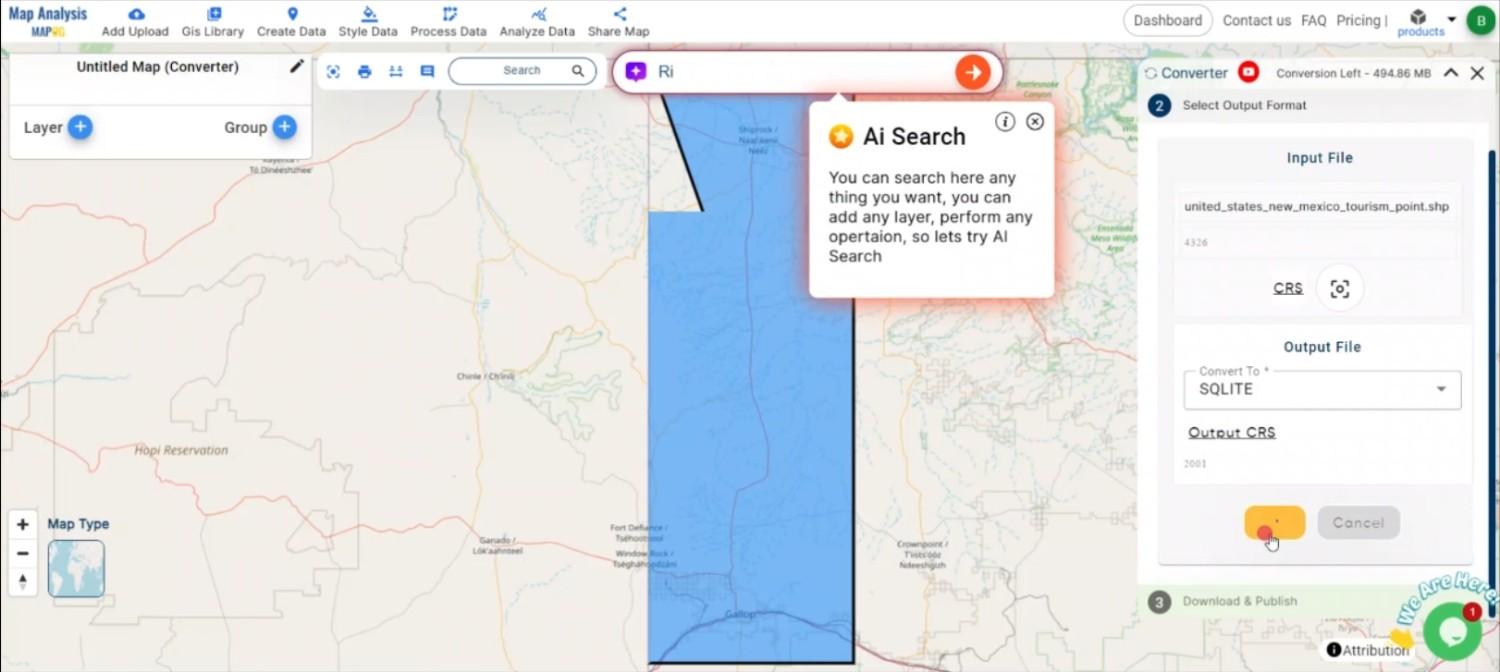
Step 3 : Execute the Conversion:
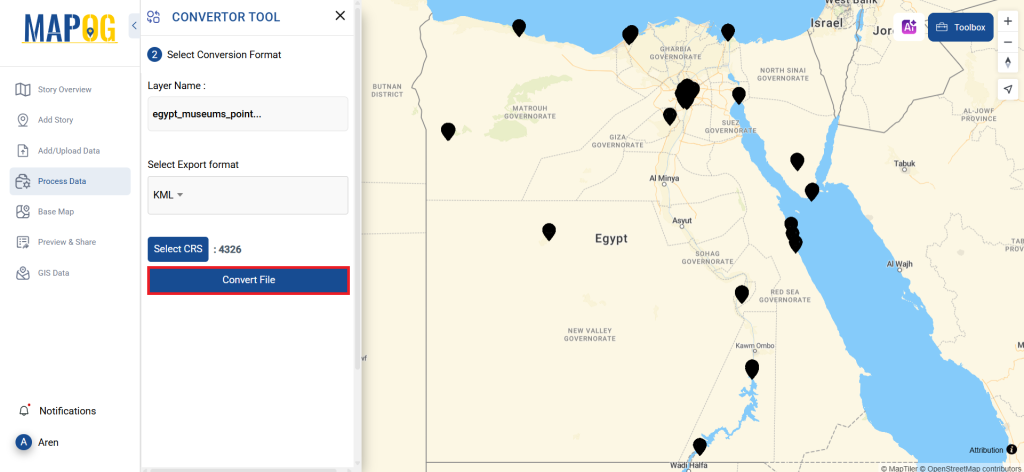
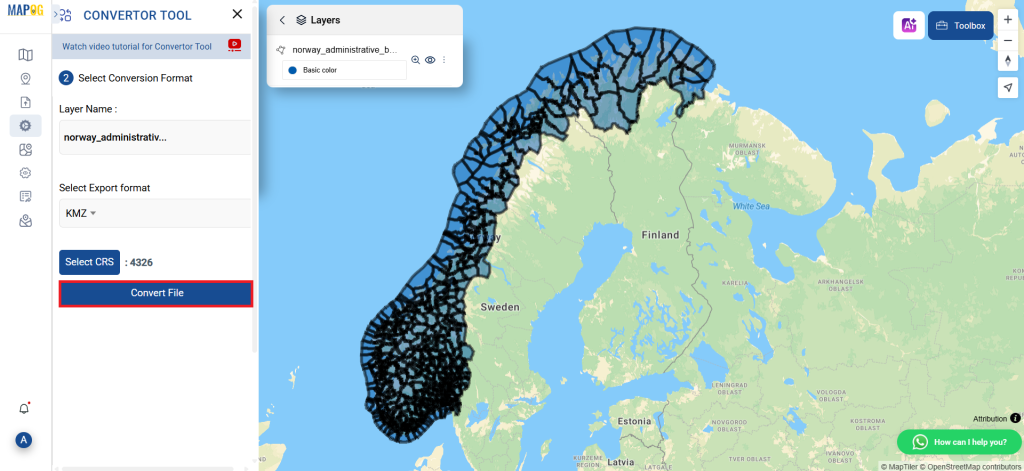
Go to ‘Convert Files’ and allow the tool to work. With the Converter Tool, you just supply your data, and it takes care of converting from DXF to KMZ format.
Step 4: Review and Download:
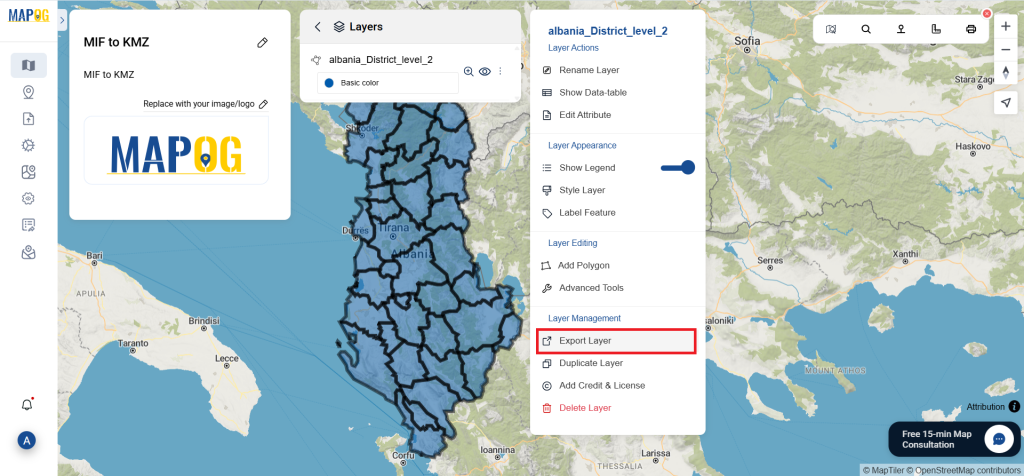
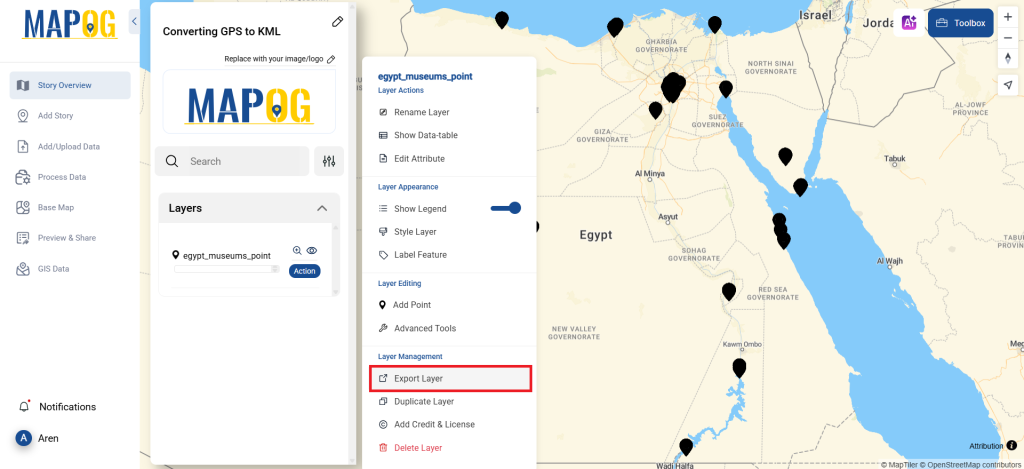
Take a moment to examine your converted KMZ data to confirm its accuracy. Once you’re confident with the outcome, go ahead and download the file. This step is essential to ensure that the conversion was successful and that all your data is correctly maintained.
Result:
You’ve successfully converted DXF to KMZ using MAPOG’s straightforward tools. This process not only simplifies your data management but also enhances the versatility of your data across different GIS platforms. For assistance or inquiries, contact us at support@mapog.com. Happy mapping!
Use MAPOG for mapping and visualizing data across all domains. Its tools make analysis easy and accurate. Convert files to get data in the format you need.
Here are some other blogs you might be interested in:
Need accurate postal boundary and location datasets for mapping or spatial analysis? Download Australia Postal Code Data easily with GIS Data by MAPOG, a powerful platform that provides geographic datasets in multiple GIS-ready formats. From urban planning to logistics management and demographic analysis, MAPOG helps users access structured postal code datasets compatible with leading GIS software.
Postal code data is widely used for delivery optimization, regional analysis, customer segmentation, and administrative planning. With GIS Data by MAPOG, users can obtain postal code layers in formats like Shapefile, KML, MID, GeoJSON, CSV, SQL, DXF, GPX, TOPOJSON, and many more for seamless integration into different mapping environments.
Understanding the Process
GIS Data by MAPOG simplifies spatial data access by organizing datasets into searchable layers and downloadable GIS formats. Users can quickly locate postal code boundaries, analyze them on interactive maps, and export them for further GIS workflows.
The platform supports over 200 countries and 900+ data layers, making the process efficient for researchers, analysts, planners, and GIS professionals. In addition, advanced filtering and AI-assisted search tools help users find highly specific datasets without complex technical steps.
All datasets are available in GCS datum EPSG:4326 WGS84 CRS (Coordinate Reference System).
Login is required before downloading datasets in your preferred format.
Step-by-Step Guide to Download Australia Postal Code Data
Step 1: Search for Postal Code Data
Begin by selecting GIS Data tool. Choose “Australia” in select country panel. Then, you can get the Postal Code in other layer or use the search layer option to find “Postal Code Data” Users can review dataset attributes to understand whether the information is available as polygon boundaries or point-based layers.
The Filter Data option allows users to narrow datasets using state and district-level filters for more refined results. If a country-wide dataset is available, users can further drill down into detailed regional postal code information. This improves accuracy and helps in finding location-specific data quickly.
Step 3: Analyze Using “Add on Map”
With the “Add on Map” feature, selected postal code layers can be directly added to the GIS analysis interface. This helps users visualize boundaries, compare nearby regions, and perform advanced spatial analysis within the interactive map workspace.
Step 4: Download the Dataset
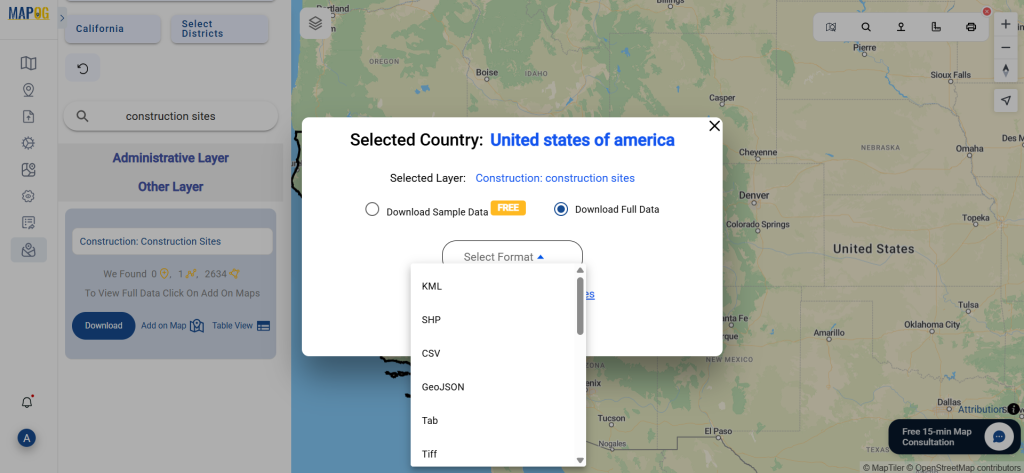
After reviewing the data, click on “Download Data” and choose either the sample version or the complete dataset. Select the required format such as SHP, KML, MID, GeoJSON, CSV, or other supported GIS formats. Accept the terms and proceed with the download process.
Final Thoughts
With GIS Data by MAPOG, Download Australia Postal Code Data becomes a smooth and efficient experience for GIS professionals, researchers, planners, and businesses. The platform not only supports multiple GIS formats but also provides smart search, filtering, and visualization tools for better geographic analysis. Whether the data is needed for mapping, delivery planning, or regional studies, Download Australia Postal Code Data effortlessly through MAPOG’s advanced GIS ecosystem.
Disclaimer : The GIS data provided for download in this article was initially sourced from OpenStreetMap (OSM) and further modified to enhance its usability. Please note that the original data is licensed under the Open Database License (ODbL) by the OpenStreetMap contributors. While modifications have been made to improve the data, any use, redistribution, or modification of this data must comply with the ODbL license terms. For more information on the ODbL, please visit OpenStreetMap’s License Page.
Need accurate electoral boundary datasets for mapping and spatial analysis? Download Australia Commonwealth Electoral Divisions (CED) Data easily with GIS Data by MAPOG. The platform provides access to structured GIS datasets in multiple formats such as Shapefile, KML, MID, GeoJSON, CSV, and many more, making it suitable for planners, researchers, analysts, and GIS professionals. With an easy-to-use interface and extensive geographic coverage, users can quickly access and manage electoral division data for various mapping projects.
Understanding Australia Commonwealth Electoral Divisions (CED)
Australia Commonwealth Electoral Divisions (CED) represent officially defined electoral boundaries used for parliamentary representation and election management. These geographic divisions help in demographic analysis, political mapping, regional planning, and administrative studies. Through GIS Data by MAPOG, users can efficiently visualize, analyze, and work with these electoral boundaries in different GIS environments.
How GIS Data by MAPOG Works
GIS Data by MAPOG simplifies geographic data access by offering more than 900+ GIS layers across multiple themes. Users can search datasets, filter results, preview layers on an interactive map, and download them in over 15 GIS-supported formats including SHP, KML, MID, GeoJSON, SQL, DXF, TOPOJSON, GPX, and MIF. The platform is designed to support seamless integration with popular GIS software for advanced spatial analysis.
All datasets are provided in GCS datum EPSG:4326 WGS84 CRS (Coordinate Reference System).
Login is required before downloading datasets in any preferred GIS format.
Step-by-Step Guide to Download Australia Commonwealth Electoral Divisions (CED) Data
Step 1: Search for Australia Commonwealth Electoral Divisions (CED) Data
Begin by selecting GIS Data tool. Choose “Australia” in select country panel. Then, you can get the Commonwealth Electoral Divisions (CED) in other layer or use the search layer option to find “Commonwealth Electoral Divisions (CED)” After selecting the layer, users can review the dataset attributes and geometry type to better understand the available boundary information.
The Filter Data option allows users to narrow down datasets based on state and district-level divisions. If the dataset contains broader administrative coverage, filters can be used to explore more detailed regional electoral data. This improves accuracy and helps users obtain highly relevant datasets for targeted GIS analysis.
Step 3: Add Data on the Map
With the “Add on Map” feature, selected electoral division layers can be directly added to the interactive map analysis interface. This enables users to visualize boundaries, compare spatial patterns, and conduct further geographic analysis within the platform before downloading the data.
Step 4: Download the Dataset
After reviewing the data, click on the “Download Data” option. Users can either download a sample dataset or access the complete version. Choose the required GIS format such as Shapefile, KML, MID, GeoJSON, or any other supported format, accept the terms, and begin the download process.
Final Thoughts
With GIS Data by MAPOG, users can conveniently Download Australia Commonwealth Electoral Divisions (CED) Data for mapping, electoral studies, demographic analysis, and planning purposes. The platform offers flexible GIS format support, advanced filtering tools, AI-assisted search, and interactive map visualization features, making spatial data management faster and more effective for GIS workflows.
Disclaimer : The GIS data provided for download in this article was initially sourced from OpenStreetMap (OSM) and further modified to enhance its usability. Please note that the original data is licensed under the Open Database License (ODbL) by the OpenStreetMap contributors. While modifications have been made to improve the data, any use, redistribution, or modification of this data must comply with the ODbL license terms. For more information on the ODbL, please visit OpenStreetMap’s License Page.
Looking to Download Australia electoral divisions (sed) Data for mapping or analysis? GIS Data by MAPOG provides a seamless way to access structured boundary datasets in multiple GIS formats like Shapefile, KML, GeoJSON, and MID. Electoral divisions (SED) represent administrative boundaries used for statistical and governance purposes, making them highly valuable for demographic studies, planning, and regional analysis. With MAPOG, users can quickly access well-organized and ready-to-use datasets for efficient GIS workflows.
Understanding the Process
When you Download Australia electoral divisions (sed) Data, you are essentially accessing boundary datasets that define electoral regions for analysis and visualization. These datasets are available in various GIS-compatible formats, allowing them to be easily integrated into tools like QGIS or other mapping platforms. The platform simplifies complex data retrieval by combining structured layers with intuitive search and filtering options.
How to Download Australia Electoral Divisions (SED) Data
MAPOG streamlines the entire process, offering access to hundreds of layers and global datasets in formats such as SHP, KML, CSV, GeoJSON, SQL, DXF, MIF, TOPOJSON, and GPX. This ensures flexibility for different GIS applications and user requirements.
• All datasets are provided in GCS datum EPSG:4326 WGS84 CRS. • Login is required to download datasets in your preferred format.
Step-by-Step Guide to Download Australia Electoral Divisions (SED) Data
Step 1: Search for Electoral Divisions (SED) Data
Begin by selecting GIS Data tool. Choose “Australia” in select country panel. Then, you can get the Province layer in other layer or use the search layer option to find “Electoral Divisions (SED) Data.” Review dataset attributes to understand geometry type (polygon-based boundaries in most cases).
Refine your results using the Filter Data option. You can narrow down datasets by states and districts, which helps in extracting more precise and localized boundary data for better insights.
Step 3: Visualize with “Add on Map”
Use the “Add on Map” feature to load the selected layer directly into the map interface. This allows you to visually analyze spatial distribution, compare regions, and validate the dataset before downloading.
Step 4: Download the Data
Once finalized, click on “Download Data.” Choose between sample or full dataset options, select your required format (Shapefile, KML, MID, etc.), accept the terms, and proceed. This completes your Download Australia electoral divisions (sed) Data process efficiently.
Conclusion
GIS Data by MAPOG makes it simple and efficient to access electoral boundary datasets in multiple formats. Whether used for research, governance analysis, or spatial planning, these datasets provide valuable geographic insights. With powerful tools like AI search, filtering, and map visualization, users can confidently Download Australia electoral divisions (sed) Data and integrate it into their GIS projects with ease.
Disclaimer : The GIS data provided for download in this article was initially sourced from OpenStreetMap (OSM) and further modified to enhance its usability. Please note that the original data is licensed under the Open Database License (ODbL) by the OpenStreetMap contributors. While modifications have been made to improve the data, any use, redistribution, or modification of this data must comply with the ODbL license terms. For more information on the ODbL, please visit OpenStreetMap’s License Page.
Looking for accurate administrative boundary data? You can easily Download Sierra Leone Province Data using GIS Data by MAPOG, a platform built to simplify access to structured geospatial datasets. It supports multiple GIS formats such as Shapefile, KML, GeoJSON, and MID, making it suitable for various mapping and analysis tools. Whether the goal is regional planning, resource allocation, or spatial analysis, this platform ensures reliable and ready-to-use data.
Understanding the Dataset and Its Use
Province-level data represents administrative divisions that are essential for governance, planning, and geographic analysis. These datasets typically include boundary polygons along with attributes like province names and codes. With GIS Data by MAPOG, such information is organized and delivered in a way that can be directly used across different GIS environments, helping users save time while maintaining accuracy.
How to Download Sierra Leone Province Data
GIS Data by MAPOG offers a smooth and guided process to access datasets from a vast collection of global layers. Simply look up the nation and layer, examine them, add them to a map for easy study, or download them for later use. With support for formats like SHP, KML, CSV, GeoJSON, SQL, DXF, MIF, TOPOJSON, and GPX, the platform is designed for flexibility and ease of use.
All datasets are provided in GCS datum EPSG:4326 WGS84 Coordinate Reference System.
Login is required to download datasets in preferred formats.
Step-by-Step Guide to Download Sierra Leone Province Data
Step 1: Search for Province Data
Begin by selecting GIS Data tool. Choose “Sierra Leone” in select country panel. Then, you can get the Province layer in other layer or Enter relevant keywords like “Province Data ” to locate the dataset. Check whether the data is available in polygon format along with its attributes.
Next, refine your dataset using the filter option. You can narrow down the data by administrative levels such as state or district, allowing deeper exploration within the dataset for more precise analysis.
Step 3: Visualize with “Add on Map”
After selecting the dataset, use the “Add on Map” feature to overlay it on the GIS interface. This step allows users to visually analyze spatial distribution, compare regions, and better understand geographic patterns before downloading.
Step 4: Download the Data
Finally, click on the download option once you are satisfied with the dataset. Choose between sample or full data, select your required format like Shapefile, KML, or MID, and proceed with the download. This completes the process to Download Sierra Leone Province Data efficiently.
Conclusion
GIS Data by MAPOG makes it simple and efficient to access administrative boundary datasets in multiple formats. With its intuitive tools, AI-powered search, and flexible download options, users can seamlessly integrate data into their GIS workflows. If you’re planning analysis or mapping projects, choosing to Download Sierra Leone Province Data ensures you have accurate and structured geographic information ready for use.
Disclaimer : The GIS data provided for download in this article was initially sourced from OpenStreetMap (OSM) and further modified to enhance its usability. Please note that the original data is licensed under the Open Database License (ODbL) by the OpenStreetMap contributors. While modifications have been made to improve the data, any use, redistribution, or modification of this data must comply with the ODbL license terms. For more information on the ODbL, please visit OpenStreetMap’s License Page.
Need accurate political boundary data for planning, research, or administrative analysis? Download India Assembly Constituency Data easily with GIS Data by MAPOG, a simple and efficient platform for accessing high-quality GIS datasets in multiple formats. It supports Shapefile, KML, MID, GeoJSON, and 15+ other GIS formats, making it suitable for mapping, election studies, governance planning, and regional development projects.
Understanding India Assembly Constituency Data
India Assembly Constituency data represents the geographic boundaries of legislative assembly regions used for state-level elections and administrative purposes. These boundaries help in understanding political divisions, voter distribution, constituency mapping, and regional planning. With GIS Data by MAPOG, this data can be accessed in structured formats that work smoothly across different GIS platforms.
The platform provides access to 200+ countries and 900+ layers, allowing users to work with detailed spatial datasets for multiple applications. Simply look up the nation and layer, examine them, add them to a map for easy study, or download them for later use. Formats such as SHP, KML, CSV, MID, SQL, DXF, MIF, TOPOJSON, and GPX are available for flexible usage.
All datasets are provided in GCS Datum EPSG:4326 WGS84 CRS (Coordinate Reference System).
Users must log in first to access and download their preferred GIS data formats.
Step-by-Step Guide to Download India Assembly Constituency Data
Step 1: Search for India Assembly Constituency Data
Begin by selecting GIS Data tool. Choose “India” in select country panel. Then, you can get the Assembly Constituency layer in other layer or use the search layer option and type Assembly Constituency to locate the dataset. Before proceeding, check the attribute details to understand whether the data is available in polygon format and review the included information.
The Filter Data option helps users narrow down the results by selecting specific states and districts. If the dataset covers a large area, filtering makes the search much more precise and useful. This allows deeper-level data discovery and supports more targeted GIS analysis.
Step 3: Visualize Using “Add on Map”
With the “Add on Map” option, users can directly place the selected layer into the map analysis interface for further examination. This makes it easier to study constituency boundaries, compare nearby regions, and perform advanced spatial analysis. It also improves understanding before final download.
Step 4: Download the Dataset
After reviewing the data, click on the download option to proceed. Users can choose between sample data or the complete dataset based on project requirements. Select the preferred format such as Shapefile, KML, MID, GeoJSON, or any other supported format, accept the terms, and complete the download.
Final Thoughts
With GIS Data by MAPOG, Download India Assembly Constituency Data becomes a simple and efficient process for professionals, researchers, and planners. The platform offers accurate geographic boundaries in multiple GIS formats, making data handling smooth across various GIS tools. Whether used for electoral mapping, constituency analysis, or governance planning, these datasets provide strong support for informed decision-making and better spatial understanding.
Disclaimer : The GIS data provided for download in this article was initially sourced from OpenStreetMap (OSM) and further modified to enhance its usability. Please note that the original data is licensed under the Open Database License (ODbL) by the OpenStreetMap contributors. While modifications have been made to improve the data, any use, redistribution, or modification of this data must comply with the ODbL license terms. For more information on the ODbL, please visit OpenStreetMap’s License Page.
Looking to explore regional travel patterns and tourism zones? Download Australia Tourism Regions Data easily with GIS Data by MAPOG, a platform built to simplify access to structured geographic datasets. It supports multiple GIS formats such as Shapefile, KML, GeoJSON, and MID, making it highly adaptable for various mapping tools. Tourism regions represent officially defined travel zones that help in planning, promotion, and regional analysis, making this dataset valuable for researchers, planners, and GIS professionals.
Understanding the Process
Tourism regions data includes boundaries and attributes that define travel zones, helping users analyze visitor distribution, regional attractions, and planning strategies. With MAPOG, this process is simplified—users can search, filter, visualize, and download datasets in just a few steps. As a result, spatial analysis becomes more efficient and accessible across different GIS platforms.
How to Download Australia Tourism Regions Data
GIS Data by MAPOG provides access to extensive datasets across hundreds of layers, ensuring flexibility and depth for spatial analysis. Simply look up the nation and layer, examine them, add them to a map for easy study, or download them for later use. Various formats like SHP, KML, CSV, GeoJSON, SQL, DXF, MIF, MID, and more are supported, allowing seamless integration into your workflow.
• All datasets are provided in GCS datum EPSG:4326 WGS84 CRS. • Login is required to access and download datasets.
Step-by-Step Guide to Download Australia Tourism Regions Data
Step 1: Search for Tourism Regions Data
Begin by selecting GIS Data tool. Choose “Australia” in select country panel. Then, you can get the Province layer in other layer or Enter relevant keywords like “Tourism Regions Data ” to locate the dataset. You can also review attributes to understand whether the data is polygon-based or contains additional regional details.
Next, refine your dataset using the filter option. You can narrow down results based on states, districts, or smaller administrative levels. This helps in extracting more targeted insights and improves the quality of your analysis when you Download Australia Tourism Regions Data.
Step 3: Visualize with “Add on Map”
After selecting the dataset, use the “Add on Map” feature to overlay it on the interactive map interface. This allows you to analyze spatial distribution, regional connectivity, and tourism coverage visually before downloading.
Step 4: Download the Data
Finally, click on the “Download Data” button. Choose between sample or full dataset options, select your preferred format (Shapefile, KML, MID, or others), accept the terms, and proceed with the download.
Conclusion
GIS Data by MAPOG streamlines the way users access and analyze tourism region datasets. With powerful tools like AI search, filtering, and map visualization, it ensures a smooth workflow from discovery to download. Whether it is for planning, research, or regional analysis, Download Australia Tourism Regions Data becomes a quick and efficient process, offering flexibility across more than 15 GIS formats.
Disclaimer : The GIS data provided for download in this article was initially sourced from OpenStreetMap (OSM) and further modified to enhance its usability. Please note that the original data is licensed under the Open Database License (ODbL) by the OpenStreetMap contributors. While modifications have been made to improve the data, any use, redistribution, or modification of this data must comply with the ODbL license terms. For more information on the ODbL, please visit OpenStreetMap’s License Page.
Accessing healthcare infrastructure data is essential for planning, analysis, and decision-making. With GIS Data by MAPOG platform, users can easily Download Family Planning Clinics Data in multiple GIS formats such as Shapefile, KML, GeoJSON, and MID. The platform is designed to provide structured and ready-to-use geographic datasets that help professionals visualize clinic locations and improve spatial analysis related to healthcare services.
Understanding the Process
GIS Data by MAPOG simplifies the data discovery process through an intuitive interface where users can search, filter, visualize, and download spatial datasets. More than 200 regions and 900+ GIS layers are available on the platform, and the data can be exported in formats like SHP, KML, CSV, GeoJSON, SQL, DXF, MID, MIF, TOPOJSON, and GPX.
The datasets are designed to be compatible with most GIS software, allowing users to quickly integrate the downloaded layers into mapping projects, spatial analysis, and planning workflows.
All datasets are provided in GCS datum EPSG:4326 WGS84 CRS (Coordinate Reference System).
Users must log in to access and download datasets in their preferred GIS formats.
Step-by-Step Guide to Download Family Planning Clinics Data
Step 1: Search for Family Planning Clinics Data
First, open the GIS Data interface on MAPOG and select the required region. Then use the Search Layer option and type Family Planning Clinics Data. After the dataset appears, review the attributes to understand whether the data is available in point or polygon format.
Next, refine the results using the Filter Data option. With this feature, users can narrow datasets by state or district, making it easier to locate specific clinic locations within a larger dataset. As a result, the extracted data becomes more relevant for detailed spatial analysis.
Step 3: Visualize with “Add on Map”
Once the desired dataset is identified, the Add on Map option can be used to display the selected layer directly in the GIS analysis interface. This allows users to visually explore the spatial distribution of clinics, analyze accessibility, and evaluate service coverage before downloading the dataset.
Step 4: Download the Dataset
Finally, click the Download Data button. Users can choose between a sample dataset or the full dataset. Select the preferred format such as Shapefile, KML, GeoJSON, MID, or any other supported format, accept the terms, and complete the download process to Download Family Planning Clinics Data for further GIS analysis.
Conclusion
GIS Data by MAPOG makes healthcare spatial data easily accessible for mapping and planning purposes. Through its powerful search, filtering, and visualization tools, users can quickly obtain structured datasets for spatial studies. By allowing professionals to Download Family Planning Clinics Data in multiple GIS formats, the platform supports better healthcare analysis, improved infrastructure planning, and informed decision-making across various GIS applications.
Disclaimer : The GIS data provided for download in this article was initially sourced from OpenStreetMap (OSM) and further modified to enhance its usability. Please note that the original data is licensed under the Open Database License (ODbL) by the OpenStreetMap contributors. While modifications have been made to improve the data, any use, redistribution, or modification of this data must comply with the ODbL license terms. For more information on the ODbL, please visit OpenStreetMap’s License Page.
Accessing location-based property information has become much easier with modern GIS platforms. With GIS Data by MAPOG, users can Download Farmhouse Data in multiple GIS formats such as Shapefile, KML, MID, GeoJSON, and many others. The platform provides structured geospatial datasets that can be used for mapping, land assessment, agricultural planning, or rural development analysis.
Understanding the Process
GIS Data by MAPOG offers access to hundreds of geospatial layers and datasets that can be downloaded in more than 15 GIS-supported formats. The system is designed to help users easily search, filter, visualize, and download spatial datasets without complex processing. As a result, professionals and researchers can efficiently obtain accurate farmhouse location data for mapping, analysis, and planning.
How to Download Farmhouse Data
MAPOG simplifies geospatial data access through a clear and guided workflow. The platform provides access to a large collection of geographic datasets with formats such as SHP, KML, CSV, GeoJSON, SQL, DXF, MIF, GPX, TOPOJSON, and more.
All datasets are available in GCS datum EPSG:4326 WGS84 CRS (Coordinate Reference System).
Users must log in to the platform in order to access and download datasets in their preferred format.
Step-by-Step Guide to Download Farmhouse Data
Step 1: Search for Farmhouse Data
Begin by opening the GIS Data by MAPOG interface and selecting the required region. After that, use the Search Layer option and type Farmhouse Data. The dataset will appear along with its attributes, allowing you to verify whether the data is available in point or polygon format.
To obtain more accurate results, use the Filter Data option. This allows you to narrow down the dataset based on administrative levels such as state or district. As a result, users can work with more precise data relevant to their mapping or research needs.
Step 3: Visualize Using “Add on Map”
Before downloading, users can review the dataset by using the Add on Map option. This feature displays the farmhouse layer directly in the map analysis interface, enabling users to explore spatial patterns and confirm the dataset before proceeding.
Step 4: Download the Dataset
Finally, once the data is verified, click on Download Data. Users can choose either a sample dataset or the full dataset. Select the desired format such as Shapefile, KML, MID, or other supported GIS formats, accept the terms, and the Download Farmhouse Data process will begin instantly.
Conclusion
GIS Data by MAPOG makes geospatial data access simple and efficient for professionals and researchers. With its advanced search tools, filtering options, and interactive map visualization, users can easily obtain farmhouse location datasets for a wide range of GIS applications. Whether the goal is land-use analysis, rural infrastructure planning, or property mapping, the platform provides reliable datasets in multiple formats for smooth GIS integration.
Disclaimer : The GIS data provided for download in this article was initially sourced from OpenStreetMap (OSM) and further modified to enhance its usability. Please note that the original data is licensed under the Open Database License (ODbL) by the OpenStreetMap contributors. While modifications have been made to improve the data, any use, redistribution, or modification of this data must comply with the ODbL license terms. For more information on the ODbL, please visit OpenStreetMap’s License Page.
Looking to Download India Pin Code Data for mapping or analysis? GIS Data by MAPOG makes the process simple and efficient by offering structured datasets in multiple GIS formats like Shapefile, KML, GeoJSON, MID, and more. Pin Code data represents postal code boundaries and locations, which are widely used in logistics, service planning, demographic studies, and location-based analysis. With MAPOG, accurate and well-organized datasets can be accessed and used seamlessly across different GIS platforms.
Understanding the Process
To Download India Pin Code Data, users need to identify the required dataset and choose a compatible format based on their GIS tools. MAPOG organizes data into layers, allowing users to quickly search, filter, and visualize pin code information. As a result, spatial patterns such as regional distribution, service coverage, and accessibility can be easily analyzed.
How to Download India Pin Code Data
MAPOG simplifies data access through an intuitive workflow, supporting 900+ layers and multiple GIS formats including SHP, KML, CSV, GeoJSON, SQL, DXF, MIF, TOPOJSON, and GPX. Simply look up the nation and layer, examine them, add them to a map for easy study, or download them for later use. This flexibility ensures that both beginners and professionals can work with the data comfortably.
• All datasets are provided in GCS datum EPSG:4326 WGS84 CRS (Coordinate Reference System). • Login is required to access and download data in preferred formats.
Step-by-Step Guide to Download India Pin Code Data
Step 1: Search for India Pin Code Data
Begin by selecting GIS Data tool. Choose “India” in select country panel. Then, you can get the Pin Code layer in other layer or Use the search layer option to find “Pin Code Data.” You can also review attributes to understand whether the dataset is available as points or polygons.
Step 2: Apply Data Filters
The Filter Data option helps refine results by narrowing them down to specific states or districts. This makes it easier to work with highly targeted datasets and ensures more precise analysis.
Step 3: Visualize with “Add on Map”
With the “Add on Map” feature, selected layers can be directly added to the map analysis interface. This allows users to explore spatial distribution, compare regions, and perform deeper analysis interactively.
Step 4: Download Pin Code Data
Once the dataset is finalized, click on “Download Data.” You can choose between sample or full data and select the required format such as Shapefile, KML, MID, or others. After agreeing to the terms, the dataset will be ready for download and use.
Conclusion
With GIS Data by MAPOG, accessing and working with pin code datasets becomes a smooth and efficient experience. The platform not only supports multiple formats but also enhances data discovery through AI search, filtering, and visualization tools. Whether used for planning, analysis, or mapping projects, pin code data provides valuable geographic insights for better decision-making.
Disclaimer : The GIS data provided for download in this article was initially sourced from OpenStreetMap (OSM) and further modified to enhance its usability. Please note that the original data is licensed under the Open Database License (ODbL) by the OpenStreetMap contributors. While modifications have been made to improve the data, any use, redistribution, or modification of this data must comply with the ODbL license terms. For more information on the ODbL, please visit OpenStreetMap’s License Page.
We use cookies to ensure that we give you the best experience on our website. If you continue to use this site we will assume that you are happy with it.