How to style your polygon GIS data categorically

GIS helps users to understand patterns, relationships and geographic context. It benefit includes improved communication and efficiency, as well as improved management and decision-making. GIS combines datasets with maps, integrated regional datasets with any type of descriptive information or data. It provides mapping and assessment prerequisites for technology and almost every industry.

Visualization and intepretaion of data is what makes GIS a beautiful and interesting fields in data analytics. Science of visualization is the core essence in the art of cartography and mapping. Any type of geospatial features presented in the map with proper color combination, accurate size and location helps in better image interpretation. Quantity and category based representation of spatial features are the common visualization styles used in GIS.

IGISMap Styling Tools

IGISMap is a web platform providing multiple GIS applications that are most important in the field of geospatial analytics. The peculiarity of IGISMap in the GIS Industry is its UI/UX that helps the user to perform effortless geospatial operations. IGISMap provides the following styling tools:

  • Basic Style
  • Category Style
  • Quantity Style
  • Bubble Style
  • Icon Style

Among the styling options listed above – Basic, Category and Quantity styling options are used to style polygon and points, whereas Bubble Style and Icon Style are used to symboloze point GIS data. Basic Style will give any single color for the while GIS layer. Quantity Style is used to visualize the GIS data quantitatively. And Category Style will style your GIS map with separate colors assigned to each category of features

In this article we will talk about Category Style tool of IGISMap and how it can be used to categorically visualize your polygon GIS data like the following.
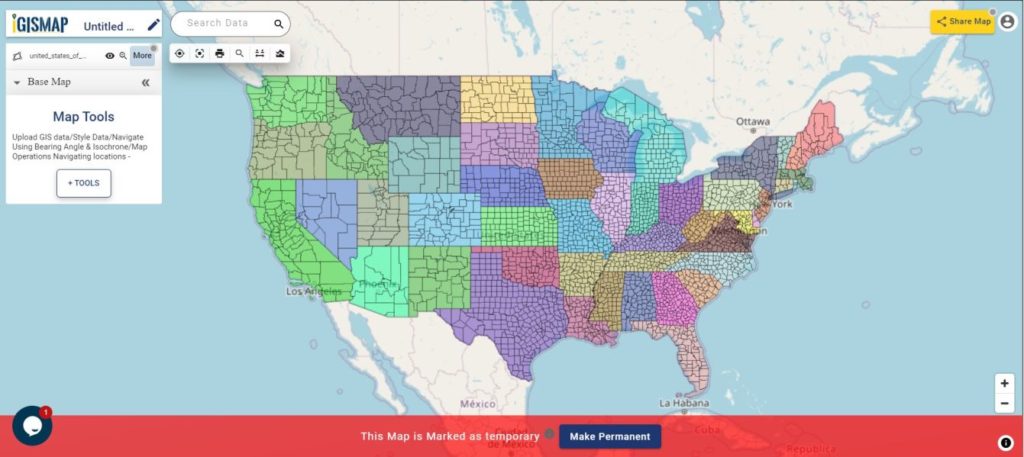
USA County Boundaries Data Categorized Based On States

Add your GIS data

For the demonstration, let’s add county boundary polygon data of USA from IGISMap GIS data collection. For this let’s use Add GIS Data tool of IGISMap.

Click to open https://story.mapog.com/app/tools/vector Upload Vector File tool.

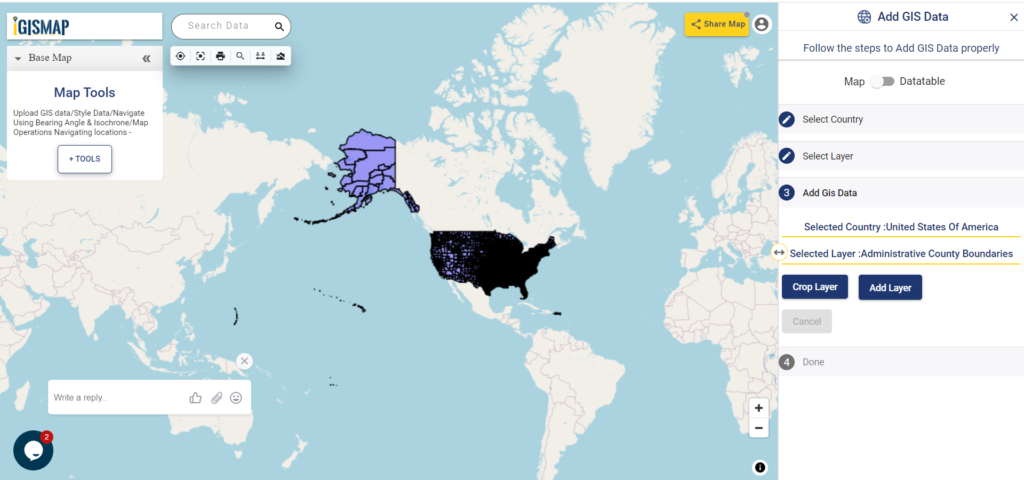
After opening the Add GIS Data tool, in the Select Country section we will select United States of America. Then Search Layer section opens with the list of GIS data of USA, where we need to select ‘administrative county boundaries‘.
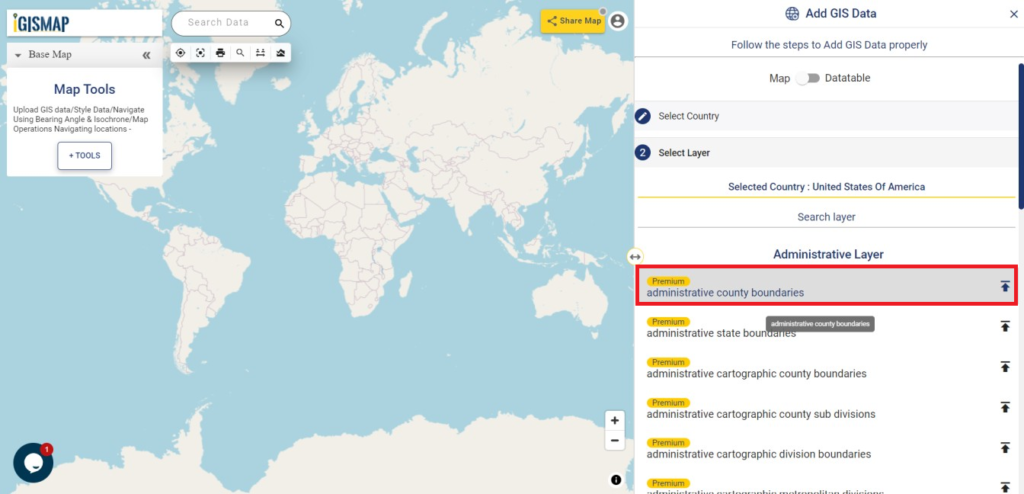
Add GIS Data
Add GIS Data

Before adding this data, lets check the data table of this data and verify the attribute field which we need to categorize this data. Switch the view from Map to Datatable and review the attribute fields. Here we are going to categorize the polygon features of county boundaries based on the state which it belongs to.

As you can see below, we have the attribute field for counties and the attribute field with states it belongs to.
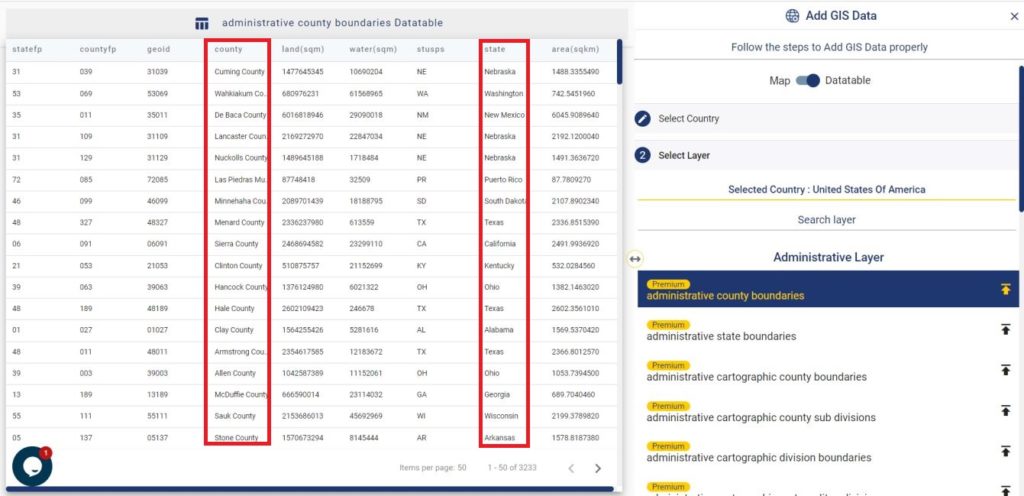
Add GIS Data - Datatable
Datatable in Add GIS Data

Since we have confirmed the data, lets continue downloading. First click the download icon beside the data name and then click the Add Layer button in the next section that opens.
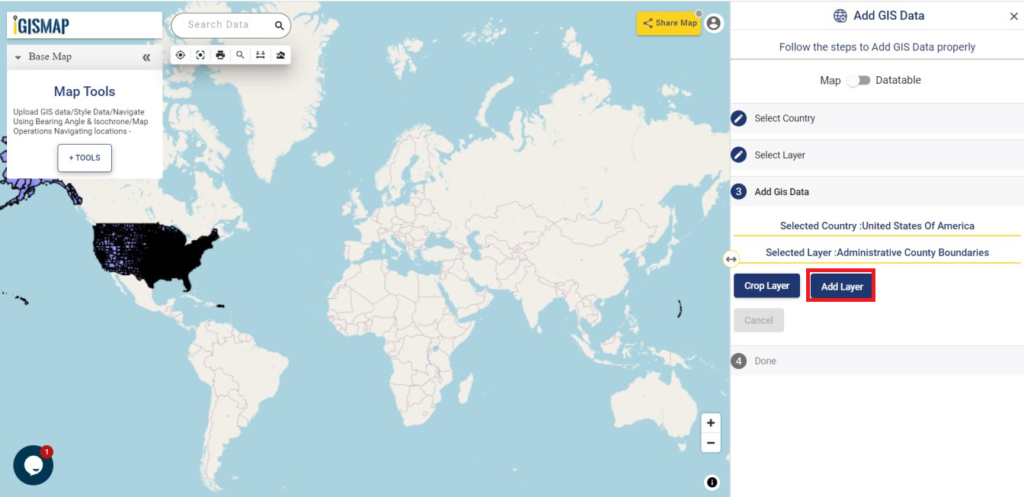
Add GIS Data - Add Layer
Add Layer

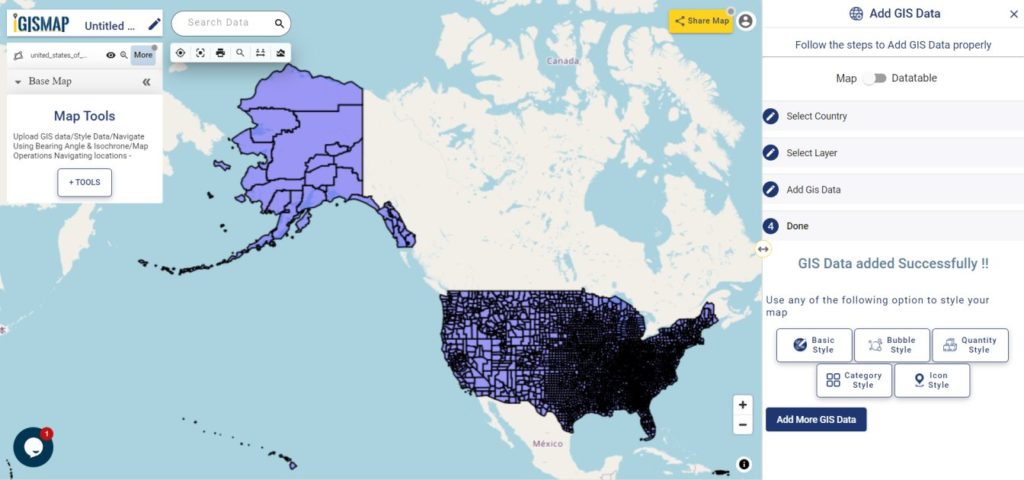
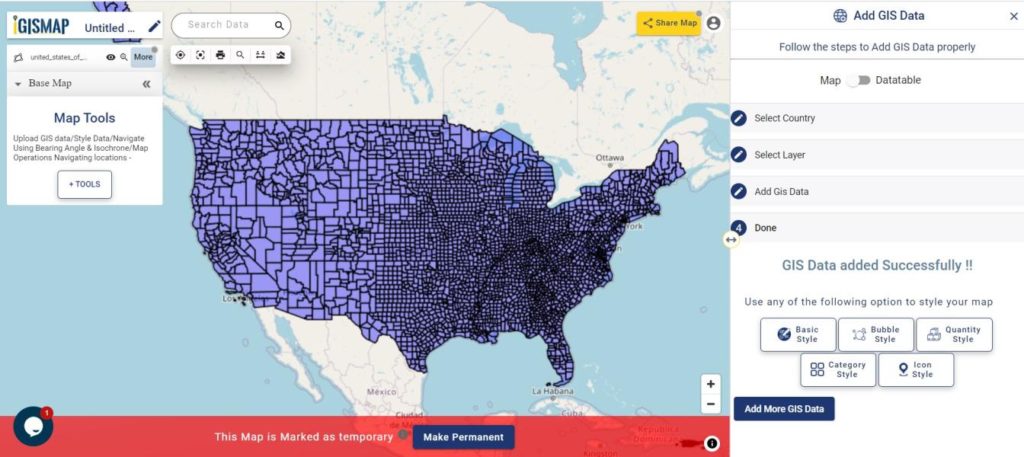
Now the layer is published in the map with the name ‘united_states_administrative_county_boundaries

Data published
Data published from Add GIS Data

Click here – Download USA County Boundaries GIS Data

Open IGISMap Category Style tool

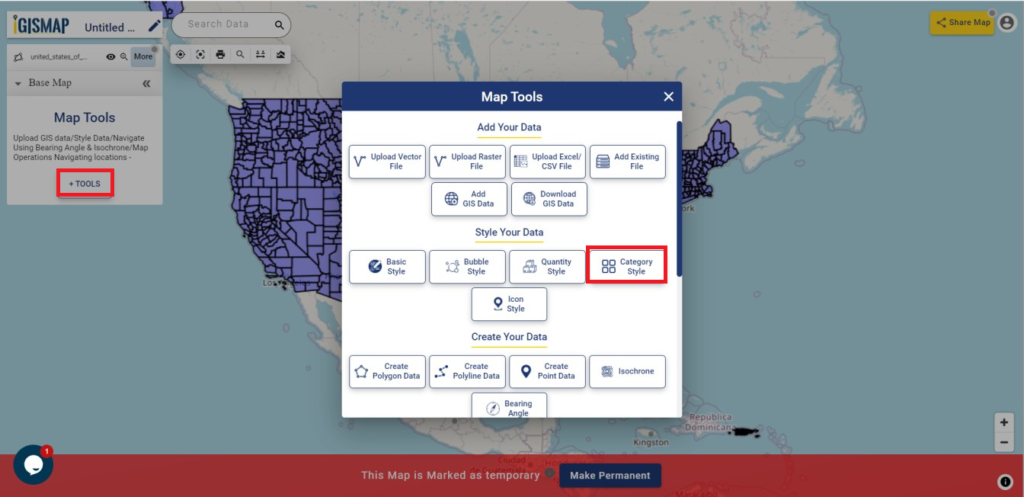
After adding the input GIS data from Add GIS Data, we can style the counties categorically using Category Style tool. For accessing the tool, click Tools button at the upper left side of screen to open the map tools popup. Then select Category Style tool listed under Style Your Data section.

Map Tools
Map Tools

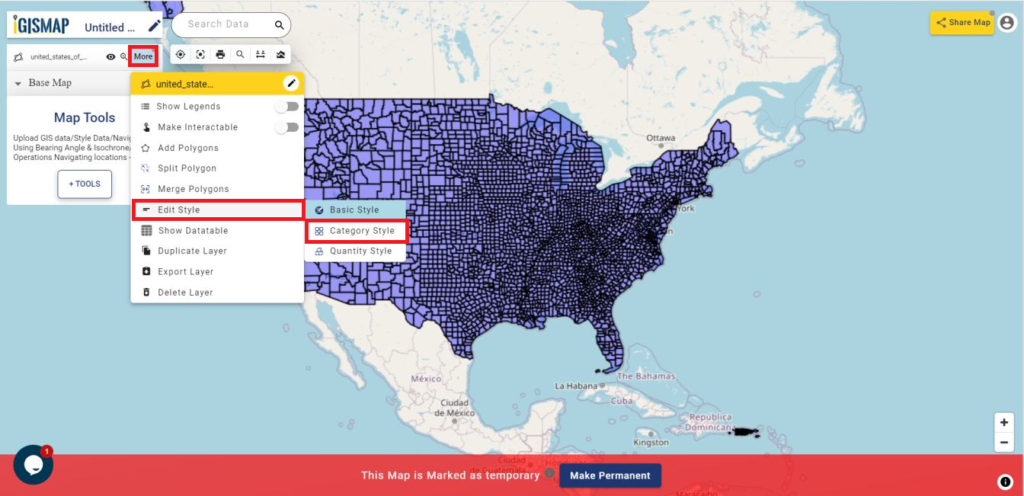
We can also open the Category Style tool by going to the More option of input point data and choose the Category Style from the Edit Style option.

More options - Category Style
More options -Edit Style – Category Style

Styling GIS data categorically

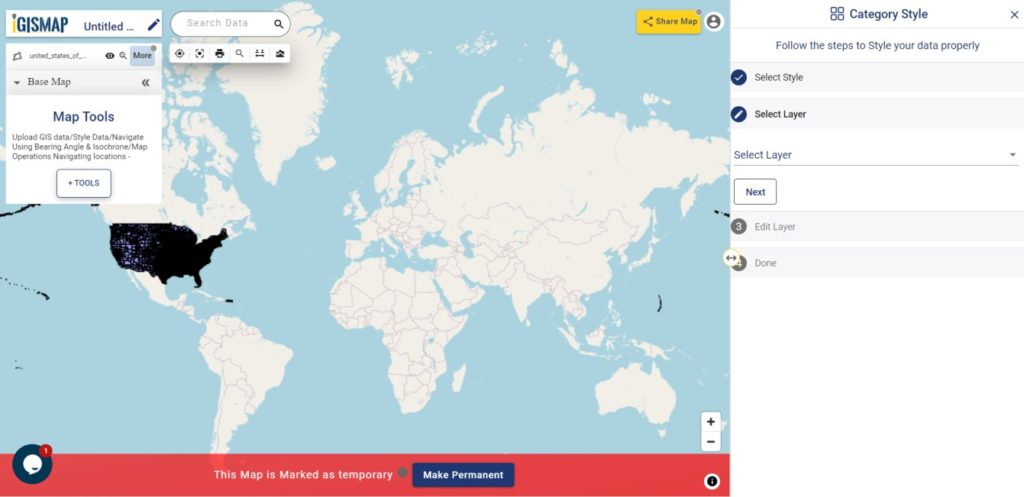
Then the tool is appeared on the screen of IGISMap.

Category Style
Category Style

Then the tool appears and we have to select the layer from Select Layer section which is the ‘united_states_administrative_county_boundaries‘ data that is published in this map and then we have to click Next option.
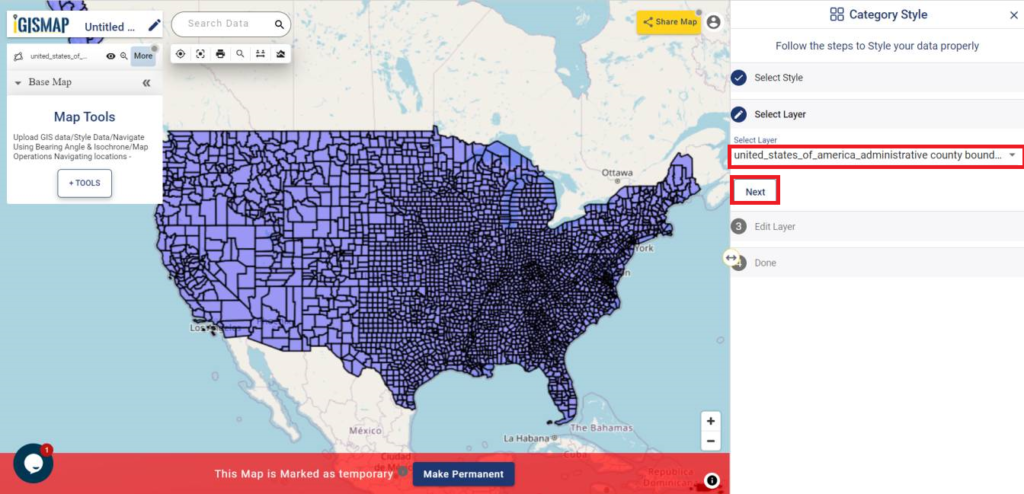
Category Style - Select Layer
Select Layer

After clicking Next, in the Edit Layer section, we can change the style as we want. In this section we can can change Opacity and change the Border Width as required. Now in the Attribute field, select state field to categorize the counties based on its individual attributes values.
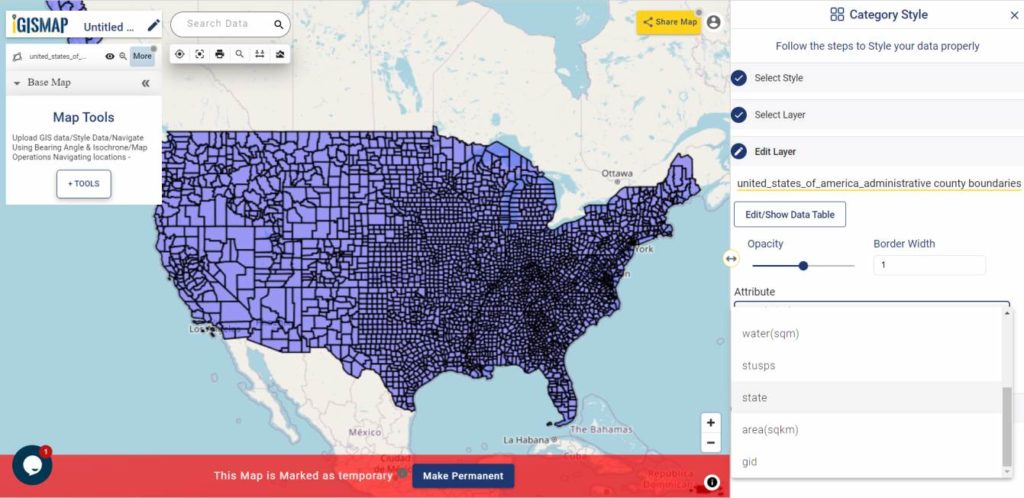
Category Style - Edit Layer
Edit Layer

After selecting the required attribute field, all individual values will be listed with different colors assigned for each category.
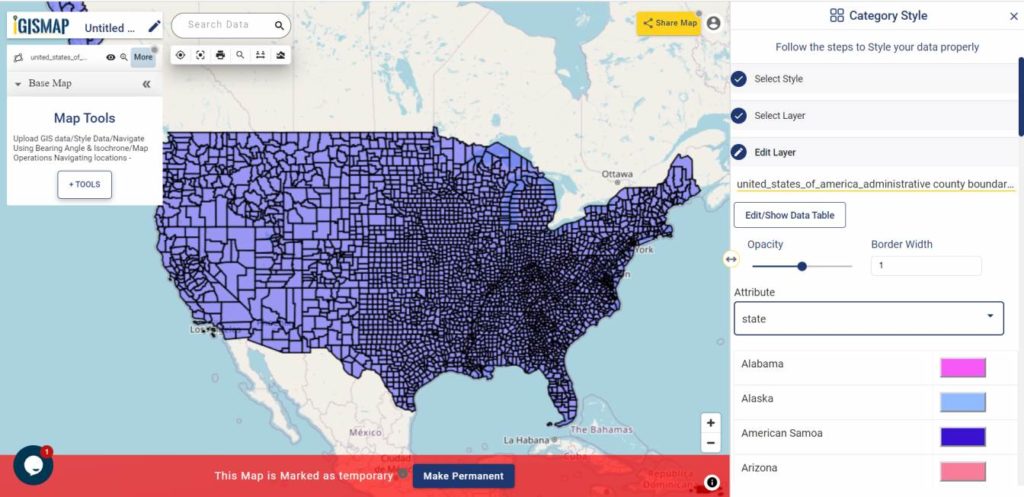
Select Attribute Field

We can change the color for each category by the color and choosing the right color. Then we have to click OK.
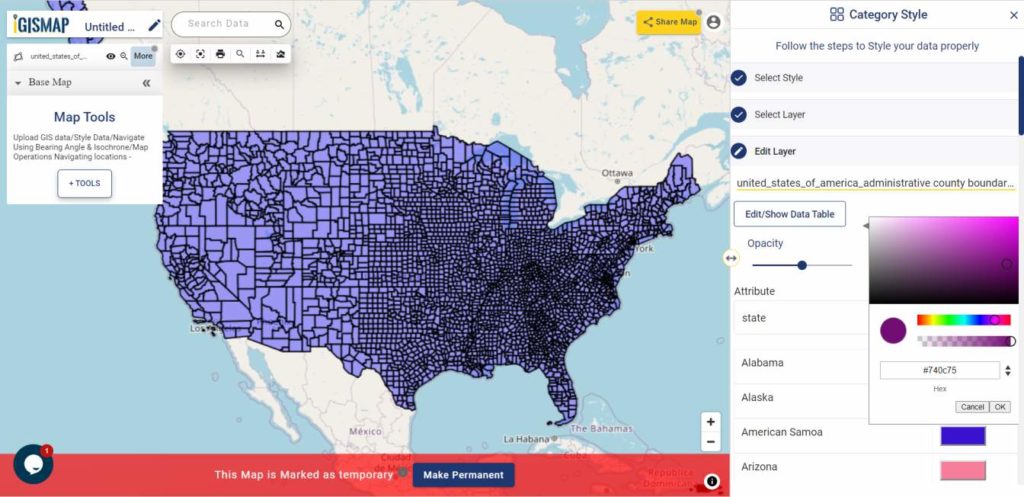
Category Style - Assign Color
Assign color to each category

After changing all color of the attributes we have to click on Save Style for styling the map categorically.
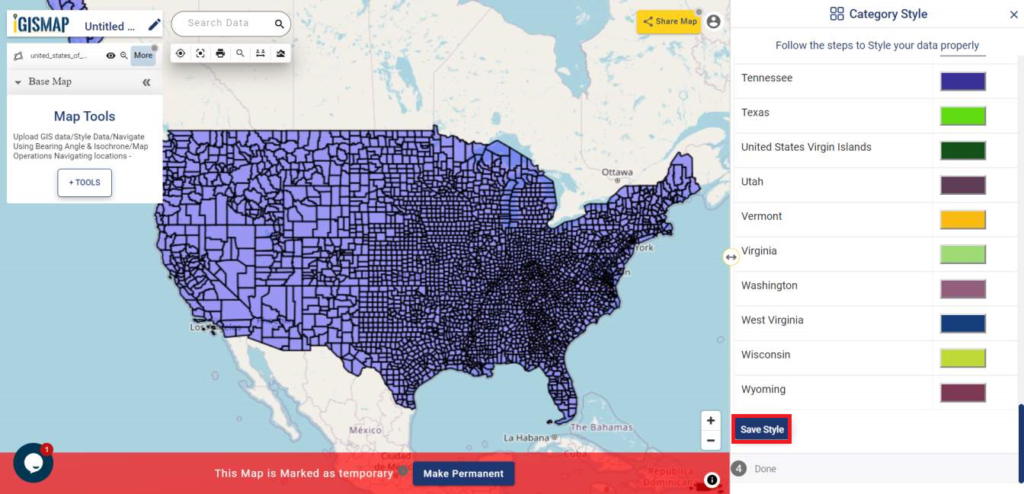
Save style
Save the Style

Now as you can see the map is converted into categorical style and the output map is shown.
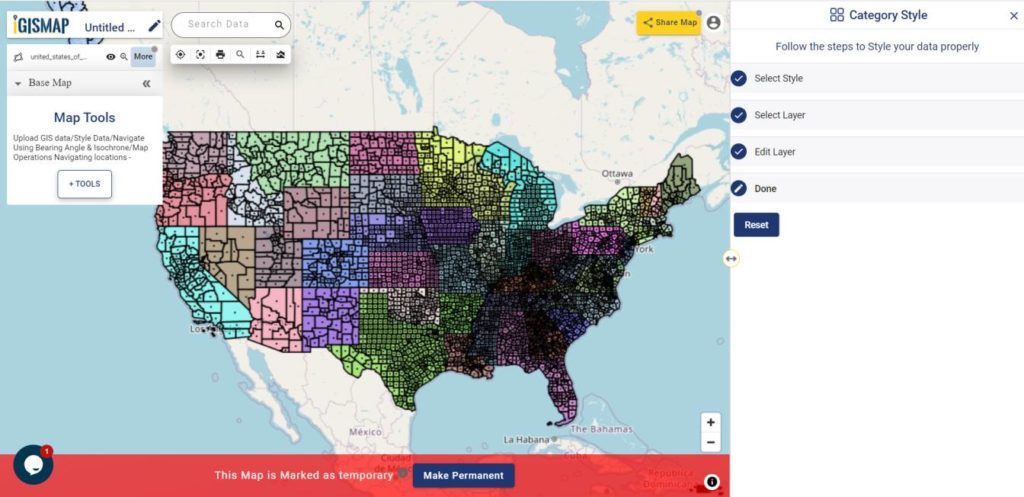
Polygon GIS data categorized

For better view and make your data more interactive in the map, go to More and enable Make Interactive option.
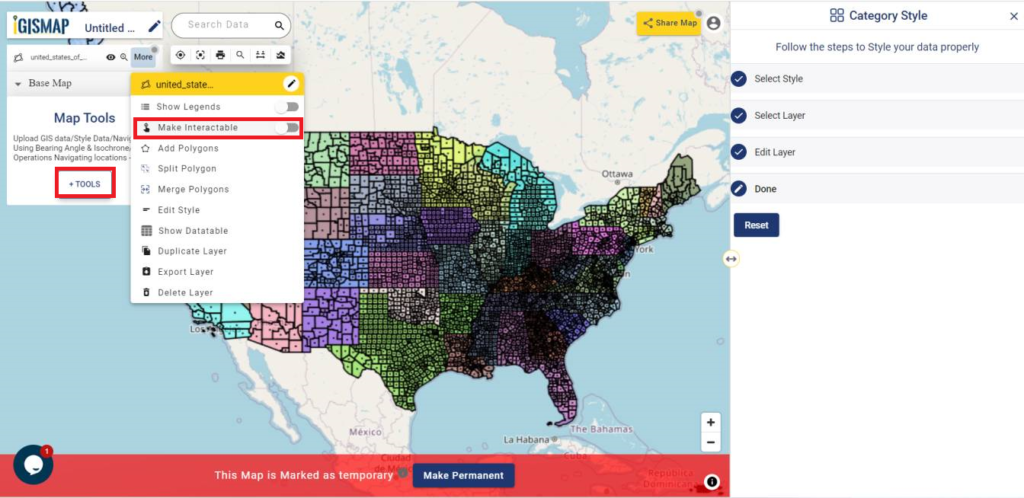
Make Interactable
Make Interactable

Now as you see below, the USA county level boundaries GIS data is better visualized in state based categories and the map got more interactive.
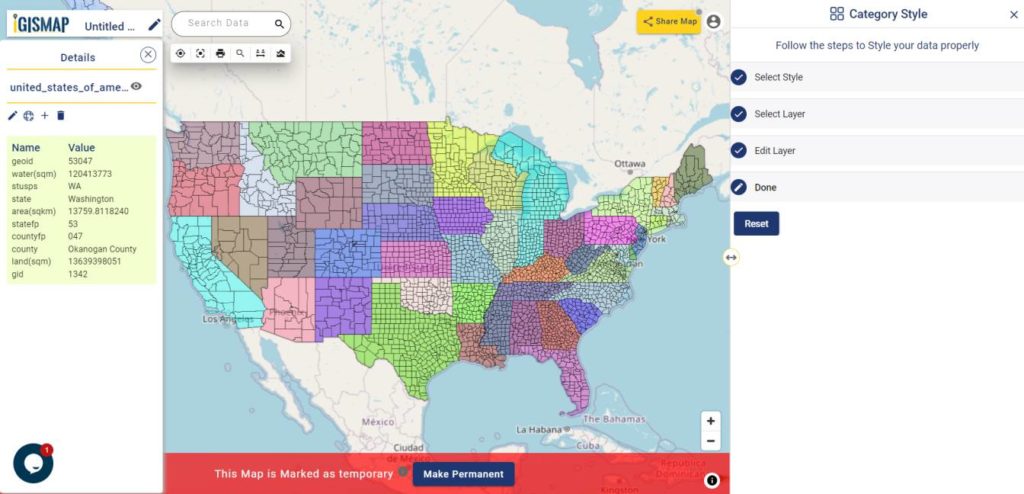
Interactable Map
Interactable Map

You can share your map with others in public or private mode. Article Share your Map will help you understand more about Share Map feature of IGISMap.
How to use Add Existing File tool of IGISMap

The applications of GIS tools are expanding in the field of business, research, defense, etc. Thus the features and tools of every GIS software are updating abruptly for helping users in these industries to get the right information by performing complex analyses over GIS data. But working with most of the GIS software in the market requires adequate training and dense knowledge in geospatial concepts.

That is where IGISMap is useful. IGISMap is GIS based web platform providing multiple GIS applications that are most important in the field of geospatial analytics. The peculiarity of IGISMAP in the GIS Industry is its UI/UX that helps the user to perform effortless geospatial operations. In this article, we will discuss Add Existing File tool of IGISMap.

In IGISMap, GIS data is uploaded, created, edited and worked on a map. A map is a spatial interface that supports GIS data and give access to various tools to perform geospatial operations. As a user of IGISMap, you can create any number of maps and add GIS data of any formats.

Add Existing File is a tool that keeps the list of all data that are available on every map in your IGISMap account. Users can open this tool directly from the map or from the dashboard to view the list of data that are published in the maps. You can select any data from the list, preview it and add that data to the map. Thus you dont have to take effort on uploading the data again if it is available in any map.

Let’s look into the application of Add Existing File tool in IGISMap.

Get directed to Add Existing file tool using the following link

https://story.mapog.com/app/tools/existing-file

Publish GIS data in the map

Let’s see how a data published in a map get listed in Add Existing Tool. So let’s first publish a data in a map. For this lets use Add GIS Data and publish USA county boundaries polygono data

Add data from IGISMap GIS data collection

Select united states of america from the list of countries and select the data administrative county boundaries and click Add Layer icon.

Download USA County Boundaries Shapefile

Add GIS Data
Add GIS Data

In the next step, since we dont need to crop the data, directly click Add Layer button as shown below.

Add GIS Data - Add Layer
Add GIS Data – Add Layer

Now, GIS data of USA county boundaries are successfully added in the map.

Add GIS Data - Data Published
Data Published

Publish data from Add Existing File

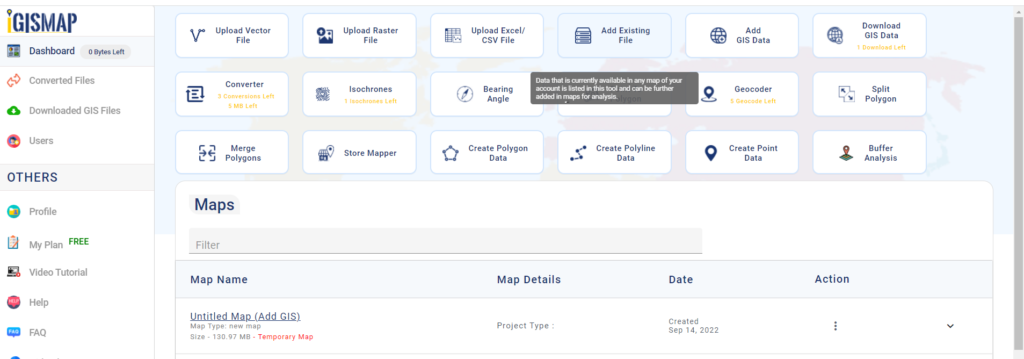
Now, we can add the USA County Level data layer using the Add Existing File. If you want add the data in a new map, open Add Existing File tool from the dashboard.

IGISMap Dasboard
IGISMap Dasboard

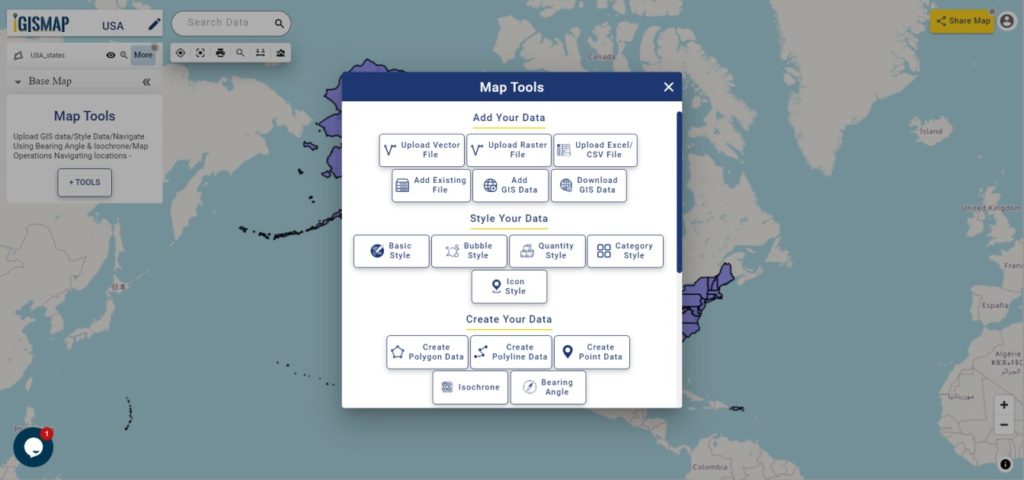
If you want to add the data from an existing map, click the Tools button below the layer list. This will open the list of all tools of IGISMap, as shown below.

In the section Add Your Data, click Add Existing File to open the tool.

Map Tools
Map Tools

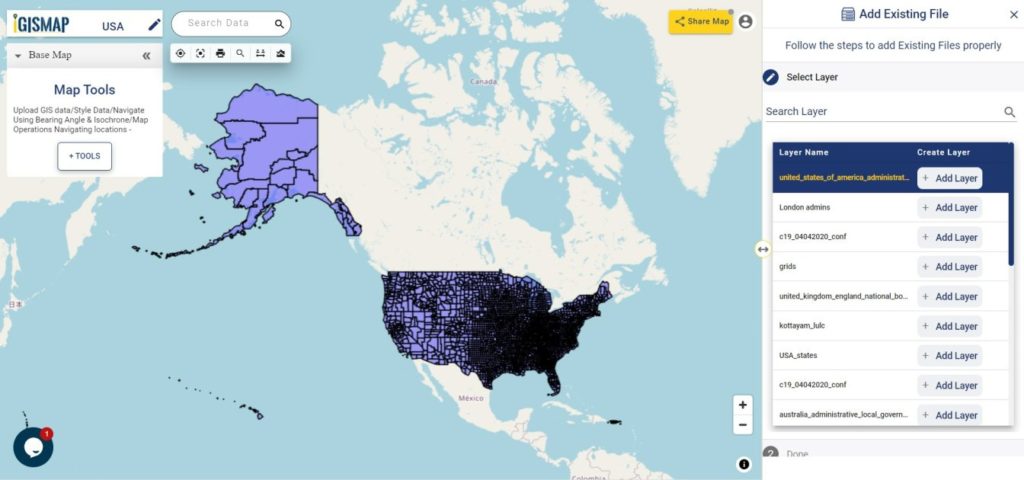
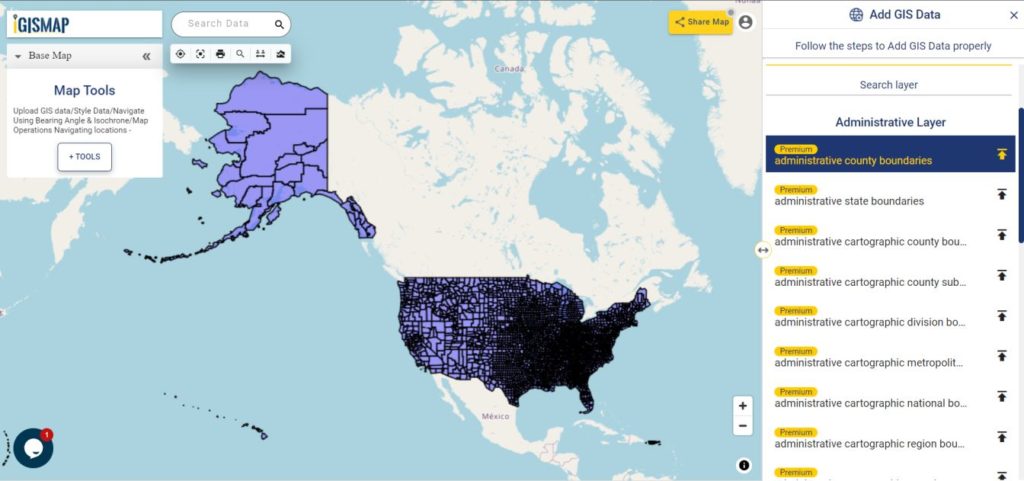
Now Add Existing File tool is opened with the list of all images currently published in the maps of your IGISMap account. The data we added from Add GIS Data, which is administrative county boundaries data of USA is listed top of the list. Or you can search the data using Search Layer option.

You can click and preview the data like the following.

IGISMap Add Existing File tool
Add Existing File tool

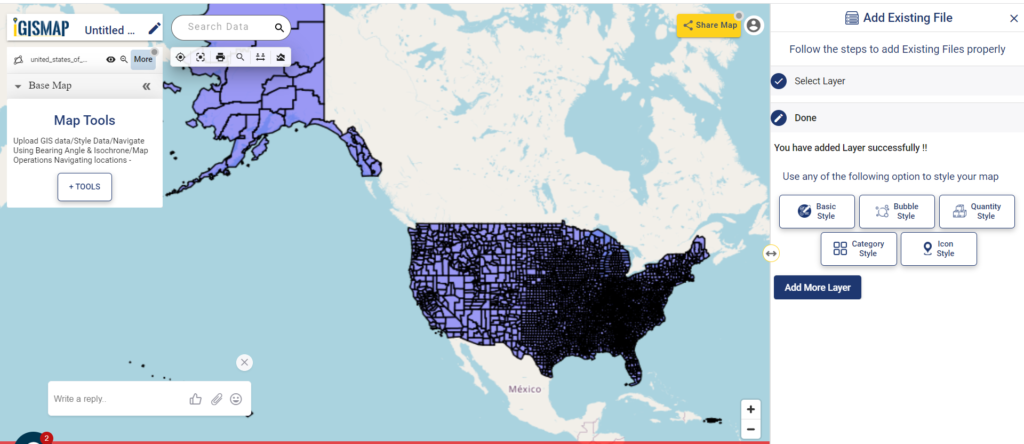
Click Add Layer button to publish this layer in your new map.

Data published
Data published from Add Existing File tool

Download United States of America Administrative Boundary Shapefiles – States, Counties, Reservation Lands and more

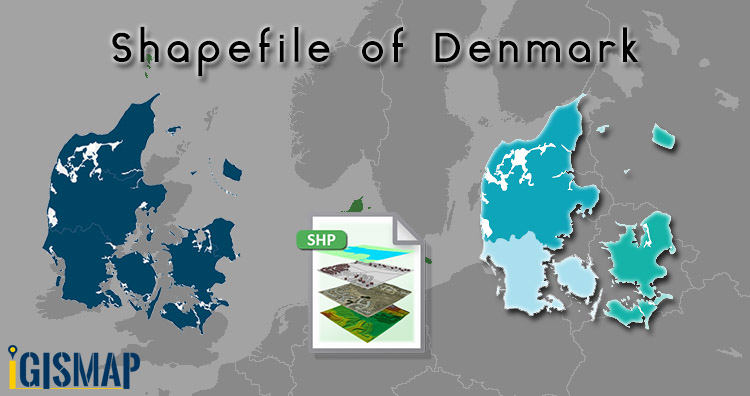
Download Denmark Administrative Boundary Shapefiles – Regions, Municipalities, Postal Areas and More

Hello GIS enthusiasts, IGISMAP has now published the latest GIS vector data of Denmark administrative levels. Links for downloading the shapefiles of the important administrative divisions of Denmark are provided in the following. You can also download these data in KML, GeoJSON or CSV formats. 

Note:

  • All data available are in GCS datum EPSG:4326 WGS84 CRS (Coordinate Reference System).
  • You need to login for downloading the shapefile.

Download Free Shapefile Data of Denmark

Denmark is a Nordic country in Northern Europe. It is the most populous and politically central constituent of the Kingdom of Denmark, a constitutionally unitary state that includes the autonomous territories of the Faroe Islands and Greenland in the North Atlantic Ocean. European Denmark is the southernmost of the Scandinavian countries, lying southwest of Sweden, south of Norway, and north of Germany. Spanning a total area of 42,943 km2 (16,580 sq mi), it consists of the peninsula of Jutland and an archipelago of 443 named islands, of which the largest are Zealand, Funen and the North Jutlandic Island. Denmark’s geography is characterized by flat, arable land, sandy coasts, low elevation, and a temperate climate. As of 2022, it had a population of 5.88 million (1 March 2022), of which 800,000 live in the capital and largest city, Copenhagen.

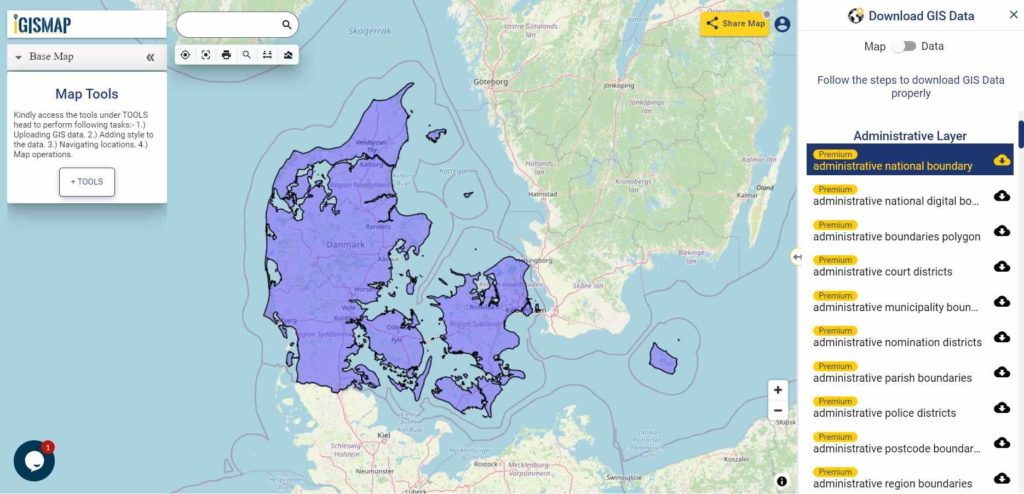
Denmark National Boundary

Download Denmark National Outline Boundary Shapefile

Download Denmark Regions Shapefile Data

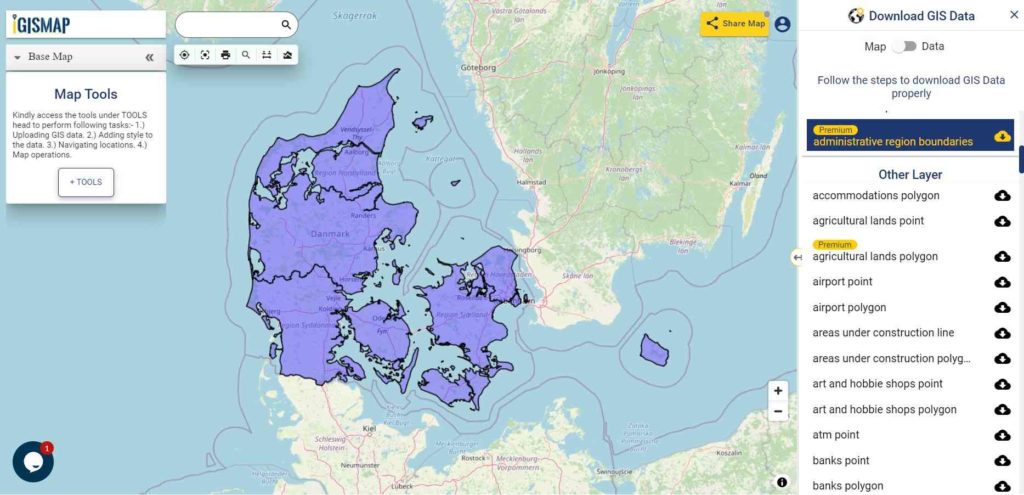
Denmark is divided into 5 regions. The governing bodies of the regions are the regional councils, each with forty-one councillors elected for four-year terms.

Following are the list of regions:

  1. Hovedstaden – Capital Region of Denmark
  2. Midtjylland – Central Denmark Region
  3. Nordjylland – North Denmark Region
  4. Sjælland – Region Zealand
  5. Syddanmark – Region of Southern Denmark
Denmark Region Boundaries

Download Denmark Region Boundaries Shapefile

Download Denmark Municipalities Shapefile Data

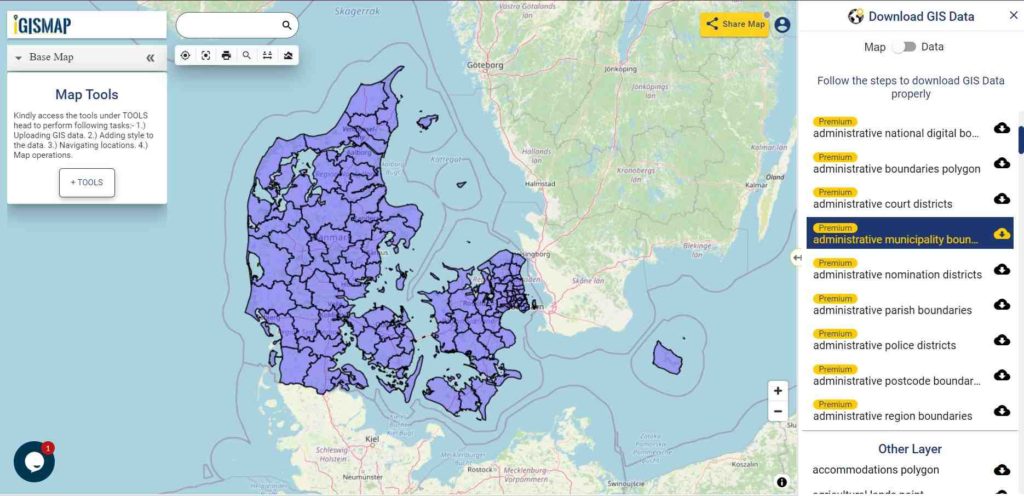
Denmark Municipality Boundaries

Download Denmark Municipality Boundaries Shapefile

Download Denmark Postal Areas Shapefile Data

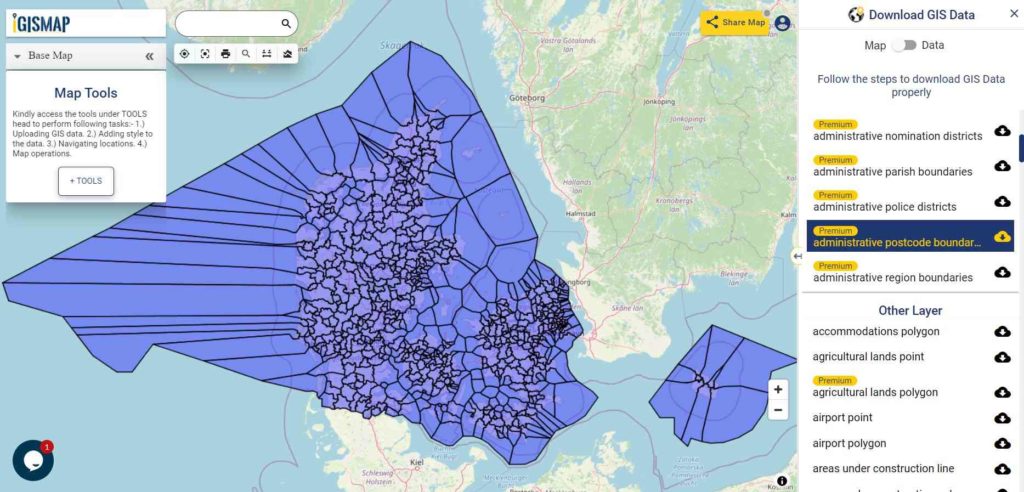
Denmark Postal Area Boundaries

Download Denmark Postal Area Boundaries Shapefile

Other Administrative Boundary Data:

Other GIS Data:

Please note that the Papua New Guinea data provided here is license under Open Data Commons Open Database License (ODbL). Please review the same before using it. If you want data under different license you can also look over to the post : Download Free Shapefile Maps – Country Boundary Polygon, Rail-Road, Water polyline etc

Download Free Shapefile for the following:

  1. World Countries Shapefile
  2. Australia
  3. Argentina
  4. Austria
  5. Belgium
  6. Brazil
  7. Canada
  8. Denmark
  9. Fiji
  10. Finland
  11. Germany
  12. Greece
  13. India
  14. Indonesia
  15. Ireland
  16. Italy
  17. Japan
  18. Kenya
  19. Lebanon
  20. Madagascar
  21. Malaysia
  22. Mexico
  23. Mongolia
  24. Netherlands
  25. New Zealand
  26. Nigeria
  27. Papua New Guinea
  28. Philippines
  29. Poland
  30. Russia
  31. Singapore
  32. South Africa
  33. South Korea
  34. Spain
  35. Switzerland
  36. Tunisia
  37. United Kingdom Shapefile
  38. United States of America
  39. Vietnam
  40. Croatia
  41. Chile
  42. Norway

Disclaimer : If you find any shapefile data of country provided is in correct do contact us or comment below, so that we will correct the same in our system as well we will try to correct the same in openstreetmap.

Download India Administrative Boundary Shapefiles – States, Districts, Pincodes and more

Namaste GIS professionals after a long time here is the shapefile of India. We get lots of queries on how to download India boundary shapefile for free and now the wait is over. In this post you will find administrative levels as well as electoral divisions of India.

  • All data available are in GCS datum EPSG:4326 WGS84 CRS (Coordinate Reference System).
  • You need to login for downloading the shapefile.

Download Free Shapefile Data of India

India, officially known as the Republic of India is a country in South Asia. It is the seventh-largest country by area, the second-most populous country, and the most populous democracy in the world. Bounded by the Indian Ocean on the south, the Arabian Sea on the southwest, and the Bay of Bengal on the southeast, it shares land borders with Pakistan to the west, China, Nepal, and Bhutan to the north and Bangladesh and Myanmar to the east. In the Indian Ocean, India is in the vicinity of Sri Lanka and the Maldives. Its Andaman and Nicobar Islands share a maritime border with Thailand, Myanmar and Indonesia.

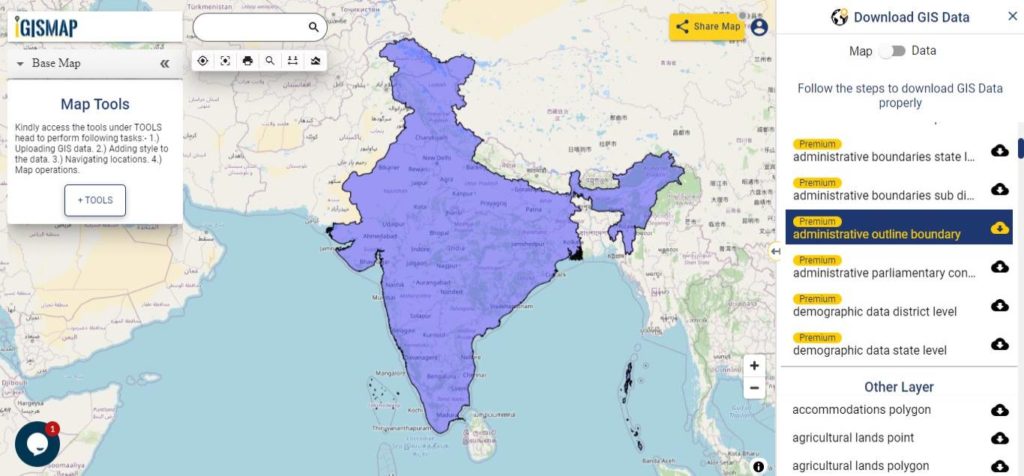
India GIS Data - National Boundary
India National Boundary

Download India National Outline Boundary Shapefile

Download India States Shapefile Data

India is a federal union comprising 28 states and 8 union territories, for a total of 36 entities. The states and union territories are further subdivided into districts and smaller administrative divisions.

States:

  • Arunachal Pradesh
  • Assam
  • Karnataka
  • Manipur
  • Meghalaya
  • Mizoram
  • Nagaland
  • Punjab
  • Rajasthan
  • Sikkim
  • Tripura
  • Uttarakhand
  • Telangana
  • Bihar
  • Kerala
  • Madhya Pradesh
  • Gujarat
  • Odisha
  • Chhattisgarh
  • Goa
  • Haryana
  • Himachal Pradesh
  • Jharkhand
  • Tamil Nadu
  • Uttar Pradesh
  • West Bengal
  • Andhra Pradesh
  • Maharashtra

Union Territories:

  • Chandigarh
  • Andaman and Nicobar Islands
  • Lakshadweep
  • Jammu and Kashmir
  • NCT of Delhi
  • Puducherry
  • Dadra and Nagar Haveli and Daman and Diu
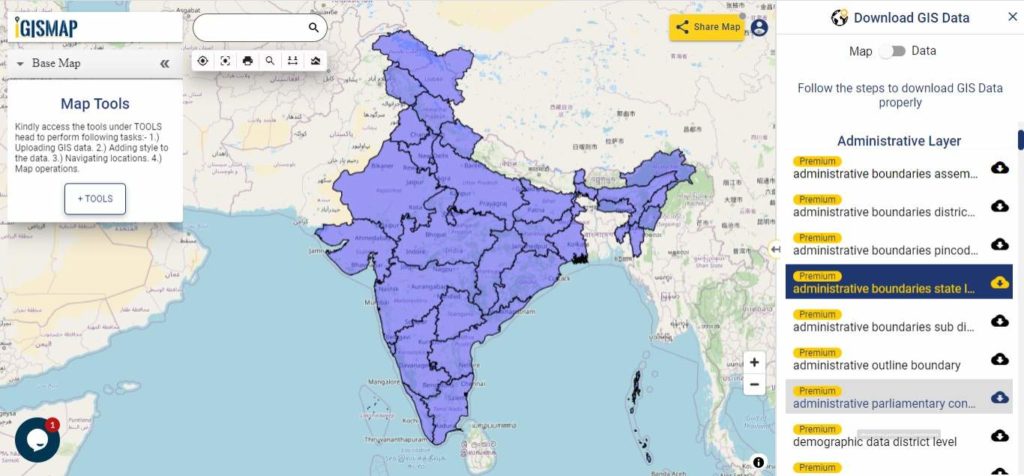
India GIS Data - State Boundaries
India State Boundaries

Download India State Boundaries Shapefile

Download India Districts Shapefile Data

States and the Union Territories are divided into districts. At the time of Census 2001 there were in all 593 districts against 467 districts at the time of 1991 Census. Each district is further divided in to sub-districts, which are known differently in different parts in the country (e.g., tahsil, taluka, community development (CD) block, Police station, Mandal, revenue circle, etc.).

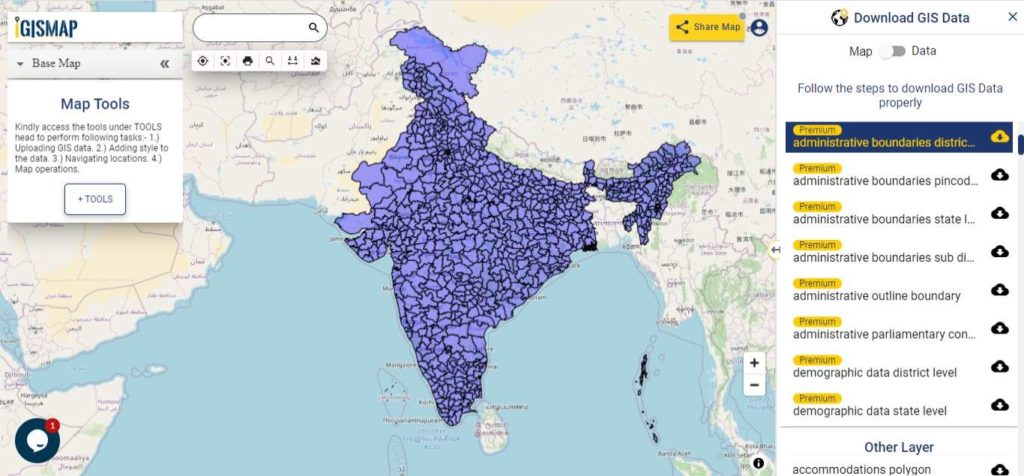
India GIS Data - District Boundaries
India District Boundaries

Download India District Boundaries Shapefile

Download India Pincode Boundaries Shapefile Data

There is more than 1,55,000 post offices based on Department of Posts (DoP) website. The following GIS data provided by IGISMAP contains 19929 postcode area polygon boundaries,

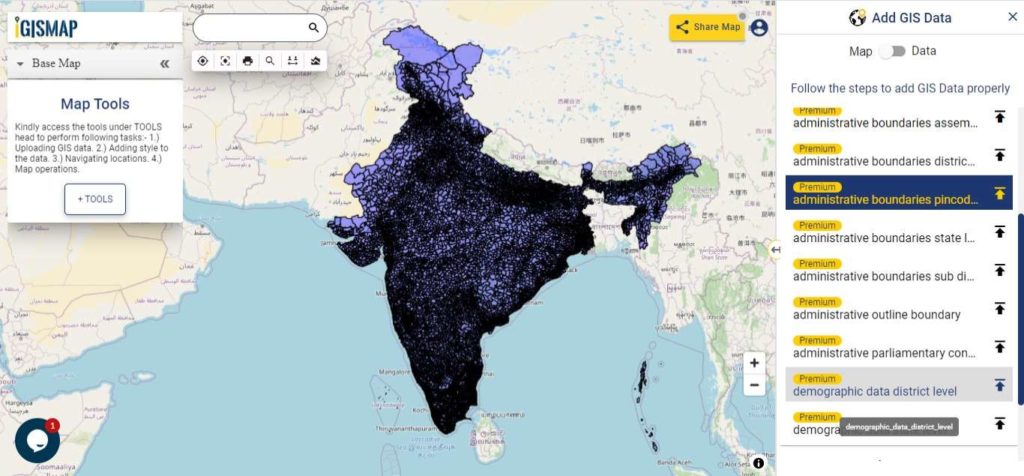
India GIS Data - Pincode Boundaries
India Pincode Boundaries

Download India Pincode Boundaries Shapefile

Other Administrative Boundary Data:

India Demographic Data:

Download free Shapefile

  1. World Countries Shapefile
  2. Australia
  3. Argentina
  4. Austria
  5. Belgium
  6. Brazil
  7. Canada
  8. Denmark
  9. Fiji
  10. Finland
  11. Germany
  12. Greece
  13. India
  14. Indonesia
  15. Ireland
  16. Italy
  17. Japan
  18. Kenya
  19. Lebanon
  20. Madagascar
  21. Malaysia
  22. Mexico
  23. Mongolia
  24. Netherlands
  25. New Zealand
  26. Nigeria
  27. Papua New Guinea
  28. Philippines
  29. Poland
  30. Russia
  31. Singapore
  32. South Africa
  33. South Korea
  34. Spain
  35. Switzerland
  36. Tunisia
  37. United Kingdom Shapefile
  38. United States of America
  39. Vietnam
  40. Croatia
  41. Chile
  42. Norway

Disclaimer : If you find any shapefile data of country provided is in correct do contact us or comment below, so that we will correct the same in our system as well we will try to correct the same in OSM.

💬 Book a Meeting