Category map in GIS is the most common and simple type of GIS Map. Category map in GIS can be created very easily with the help of MapOG Converter Tool. The Category map in GIS help us visualize and identify the category of the location. Categorization is an essential requirement for the map users to analyze and understand the data easily.
Create Category Map in GIS – IGIS Map Converter Tool
Styling a Category map in GIS allows you to give different features and styles based on values in the attribute data in a specific layer. As a result user can easily analyze and understand the data. Likewise with the help of styling the attribute data in a layer, user can categories specific locations and data in minutes.
To create GIS Category Map with IGIS Map Tool you need to follow some steps as follows:
- Go To MapOG Converter Tool and login to your account.
- Upload dataset and create a new map project Or Open your existing map project.
- Once the map is open click on the “Style Layer” option on top of the map layer.
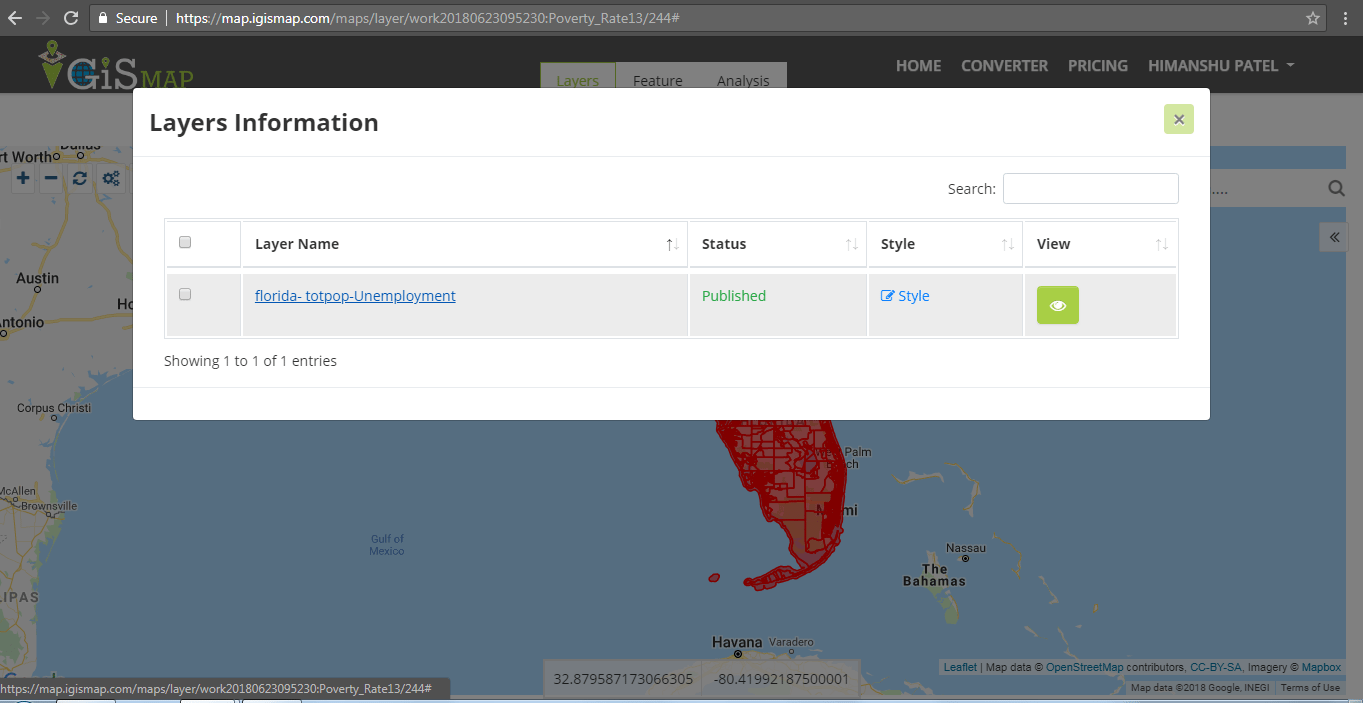
- Select a layer that you want to create GIS Category map with.
- Now click on the Category map section to create GIS Category map.
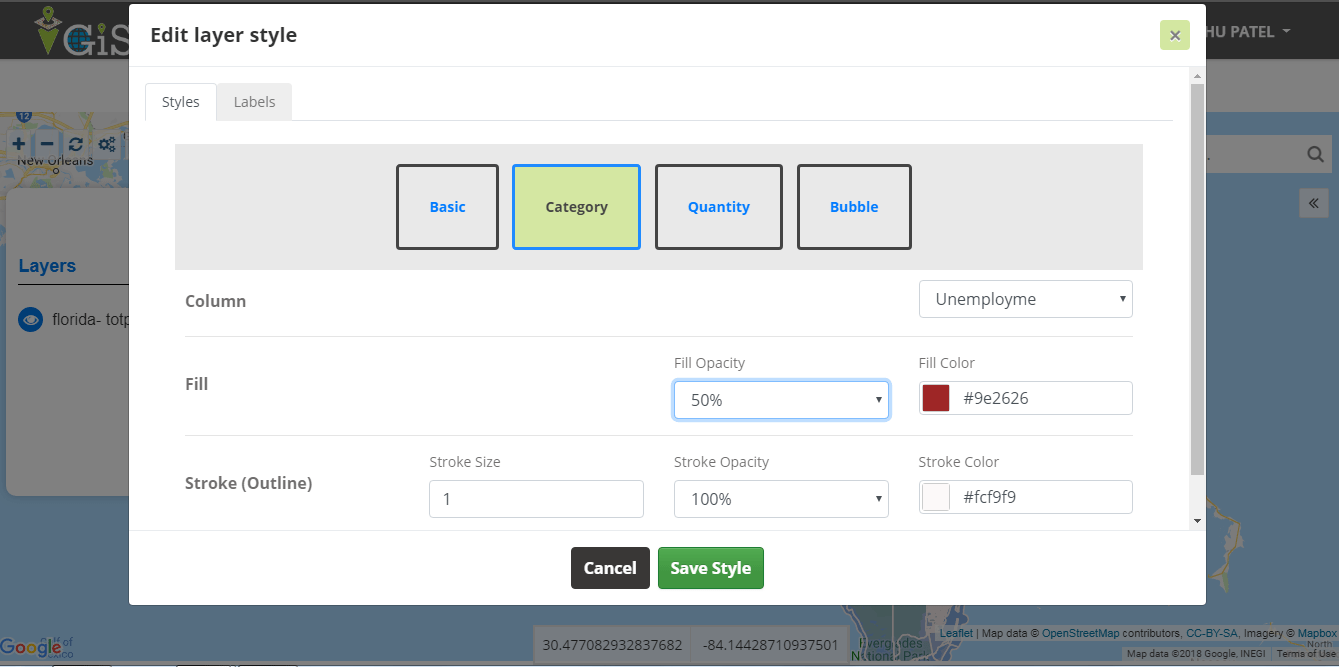
- The column dropdown in the Category section contains every column present in the data attribute table. Select the column that you want to categorize. By default each different value in the column will be given its own color.
- Only the first 50 columns will be styled because columns have the limit of not more than 50 unique values. As it can not style more than 50 values.
- You can set the opacity for the colors to filled in the fill section. Each category will be assigned a color at random from the color bar and you can also change the default color in the fill section.
- You can also set the line width, opacity & color of the stroke or outline section.
Finally this is how you can Create Category Map in GIS with IGIS Map Converter Tool. This type of visualization is useful for classifying expertise and insight into a whole new map on the basis of location or dataset in the attribute table.
Category Map in GIS – Uses
Business analysis, Risk management and classified mapping are the main uses of Category map. It can be very helpful because of the its ability to allow us visualize the category of the data attribute table. It also provides a deeper understanding of the commercial and operational data associated with a particular dataset.
Category Map mainly serves in following industries:
- Insurance
- Healthcare
- Real Estate
- Surveying
- Risk Assessment
- Government sector
- Banking etc.
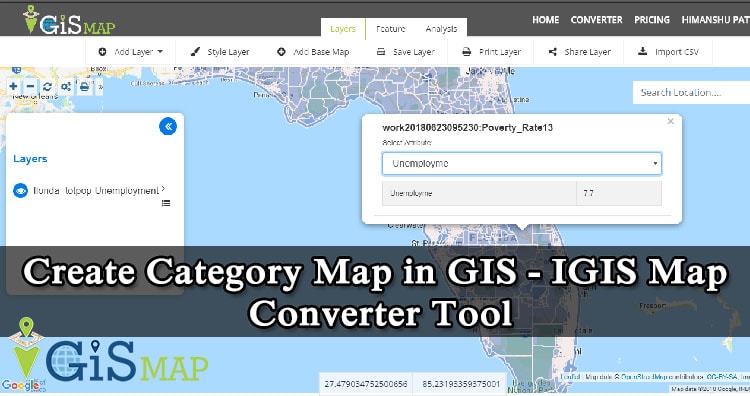
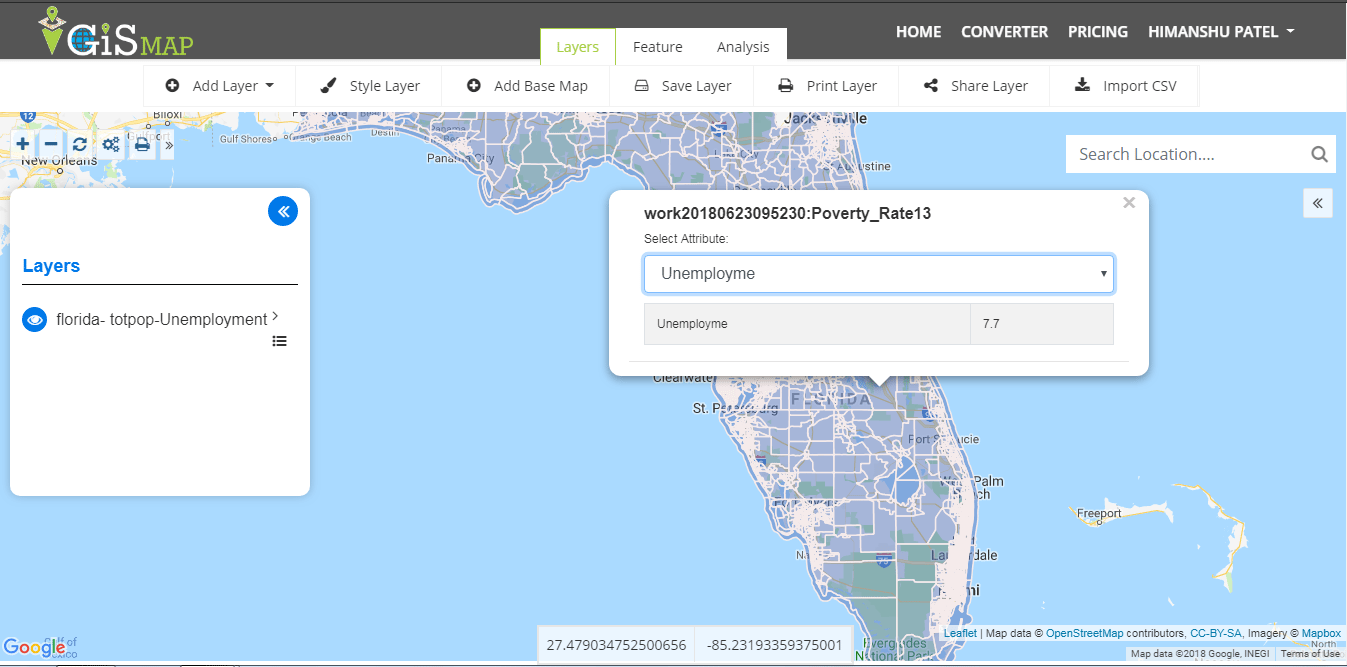
Let’s take a example. US Government took a survey in Florida (USA) for reviewing the unemployed population of different areas to compare the number of unemployed people in one area to the number of people in another area in Florida. By creating Category map they helped in the visual analysis of the unemployed population in different areas of Florida.
Category Map in GIS categorizes the unemployed population in different areas of Florida with the help of MapOG Converter Tool.
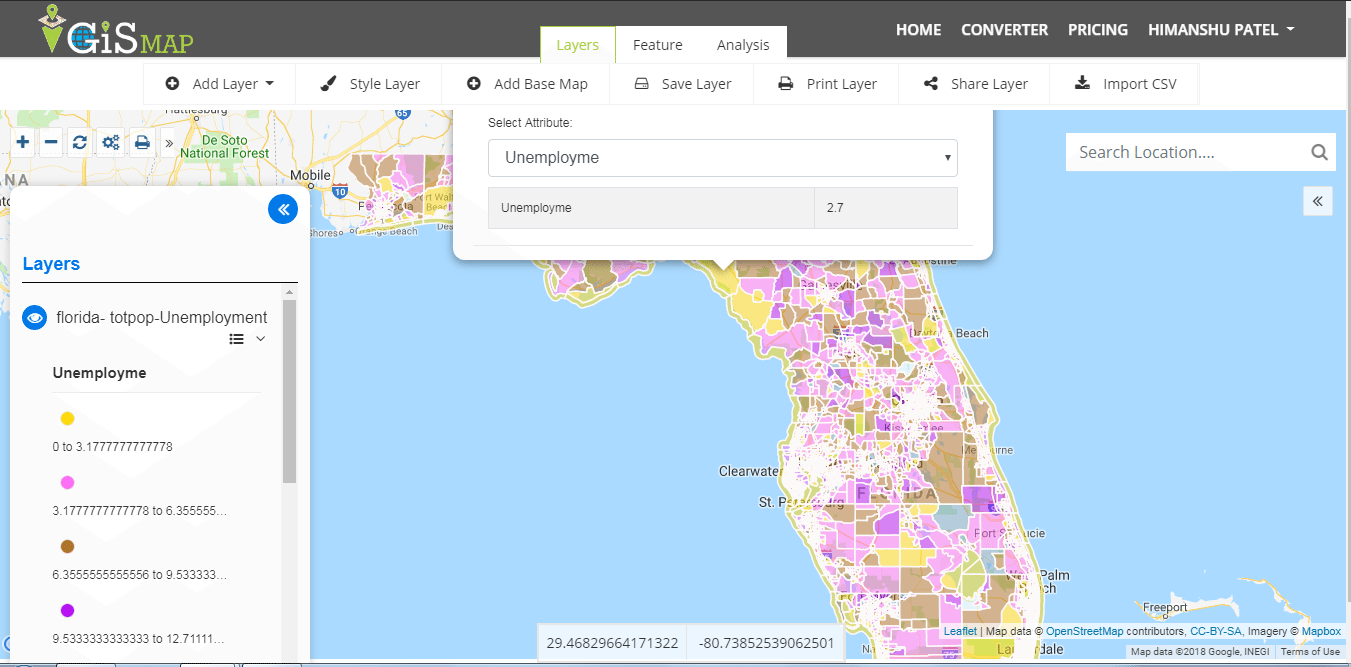
(#this is a sample data)
It seems like this post can help you in development and Create Category map in GIS with IGIS Map Converter Tool. If you find any problem in creating one such example do let us know by commenting below.