Finding accurate Optometrists Data is now easier than ever. GIS Data by MAPOG is a user-friendly platform that allows you to access, analyze, and download optometrists’ geographic data in various formats like Shapefile, KML, MID, and 15+ GIS formats. This data is valuable for researchers, healthcare organizations, policymakers, and GIS professionals looking to map optometry clinics, eye care centers, and vision specialists worldwide.
Why Use GIS Data for Optometrists?
With an intuitive interface, MAPOG ensures you can download Optometrists Data efficiently for over 200 countries and 900+ layers. Whether for healthcare planning, spatial analysis, or business expansion, this platform provides a comprehensive database with flexible export options.
Download Optometrists Data of any countries
Note:
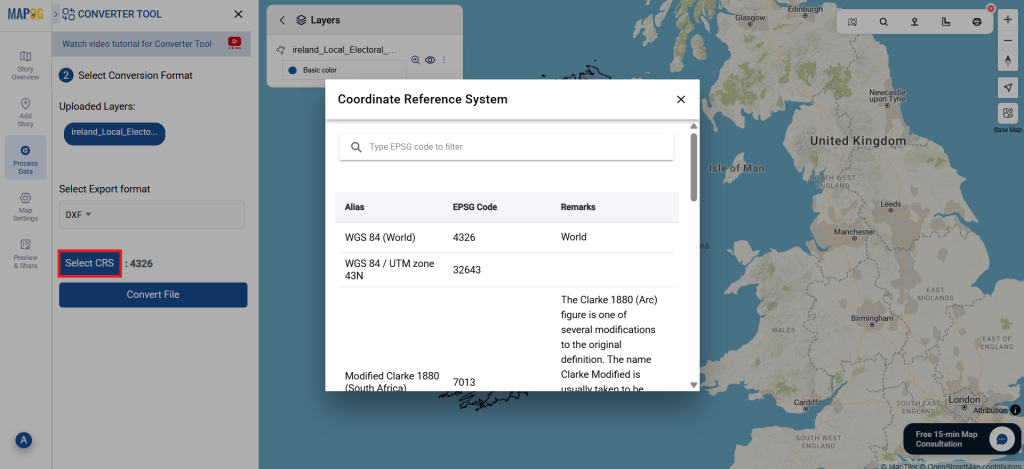
- All data is provided in GCS datum EPSG:4326 WGS84 CRS (Coordinate Reference System).
- Users need to log in to access and download their preferred data formats.
Step-by-Step Guide to Download Optometrists Data
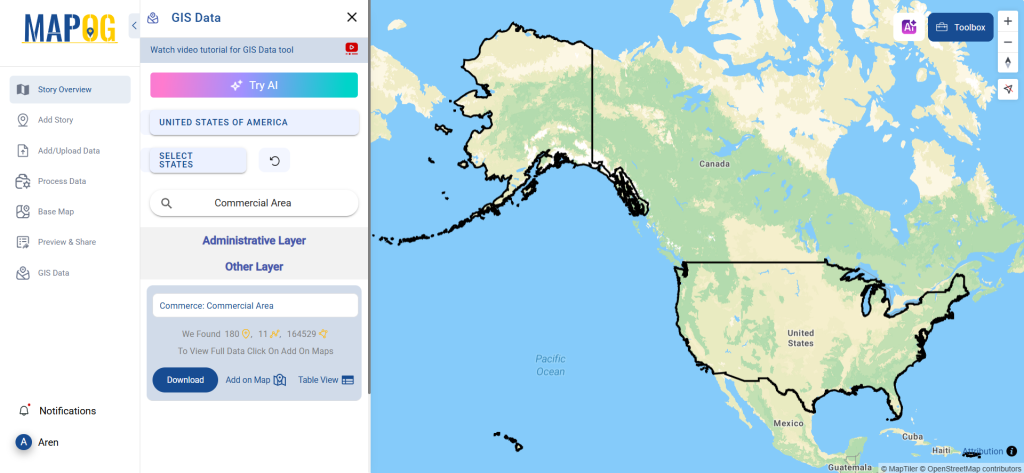
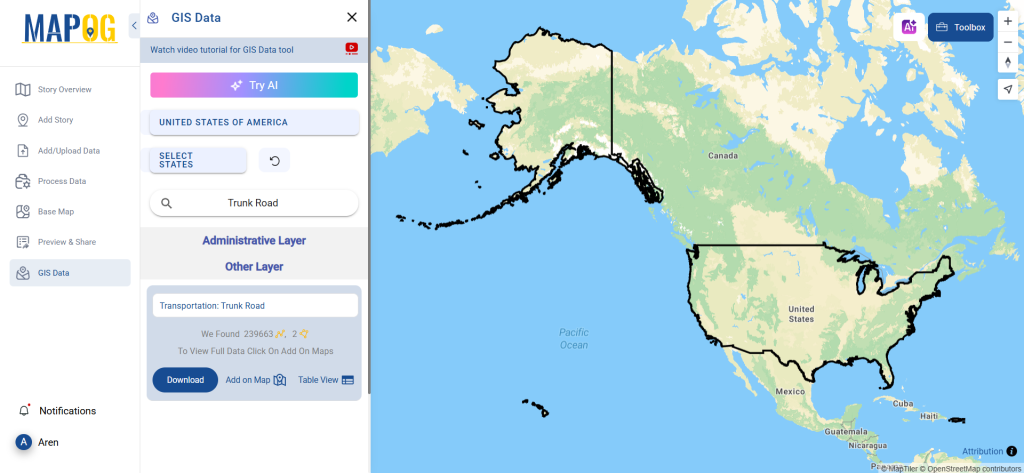
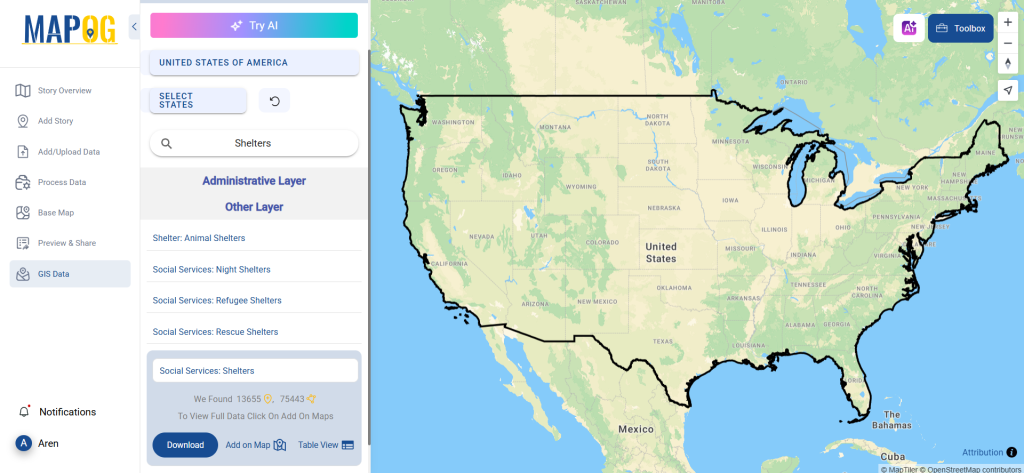
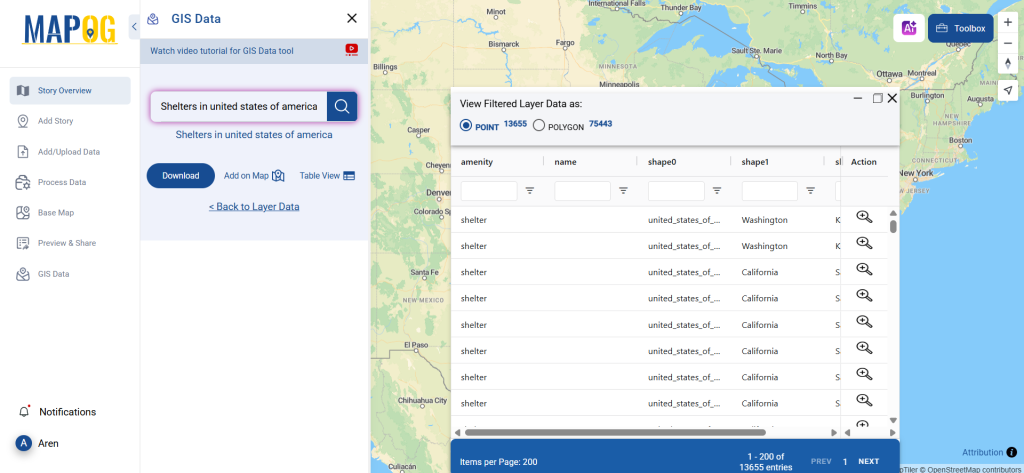
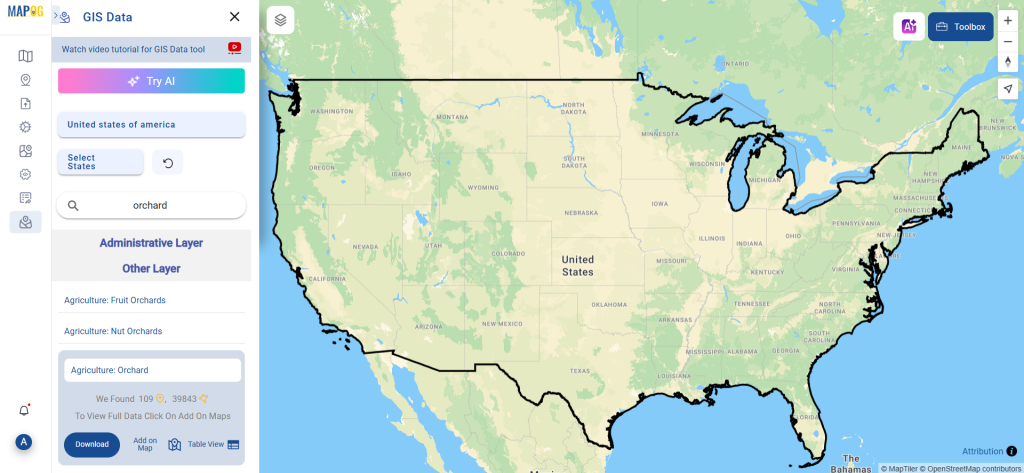
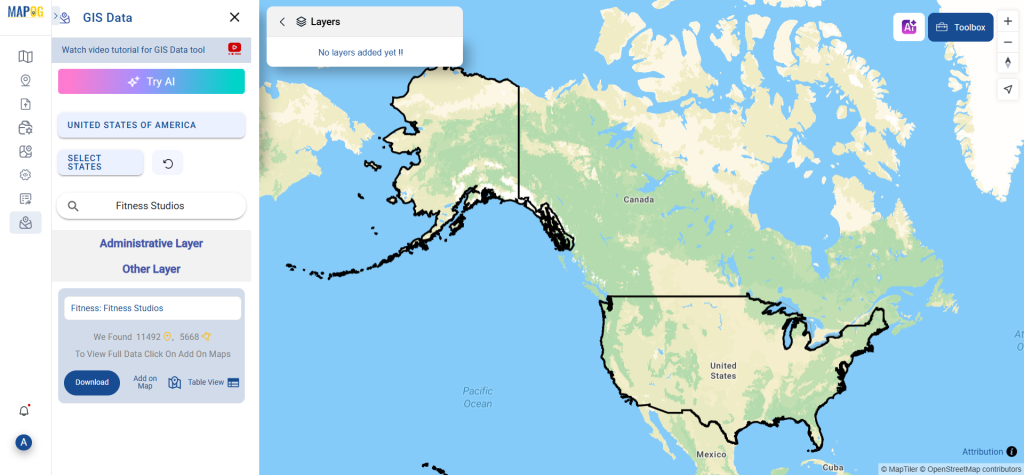
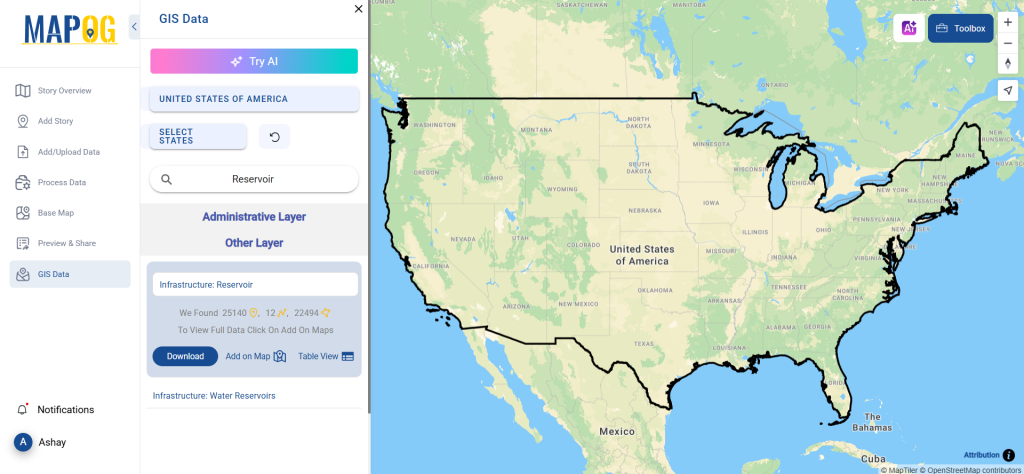
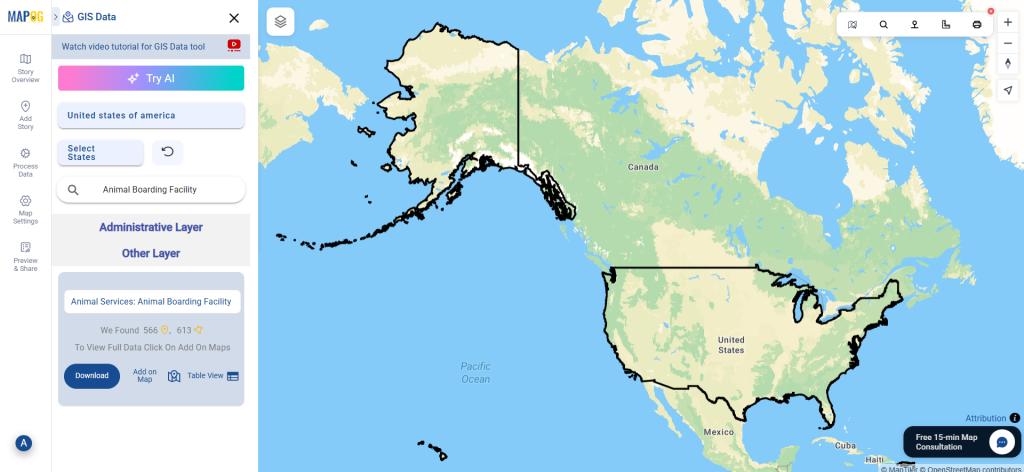
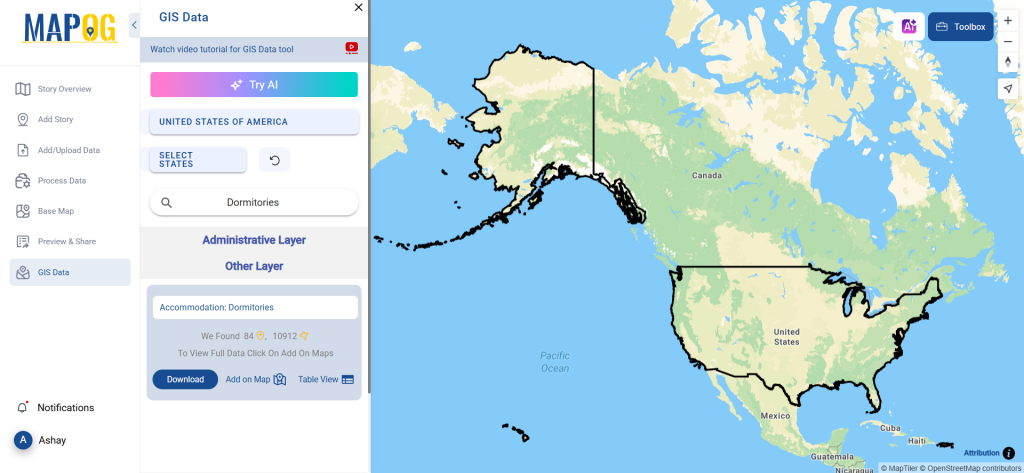
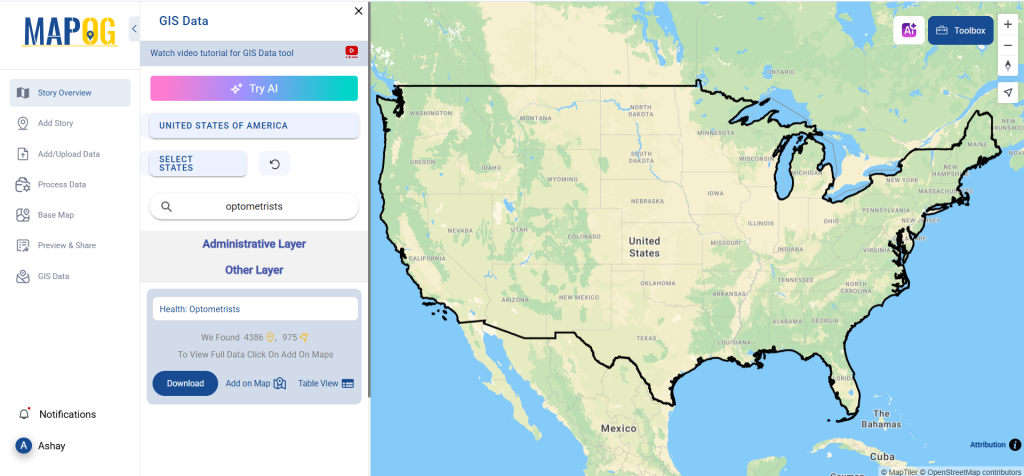
Step 1: Search for Optometrists Data
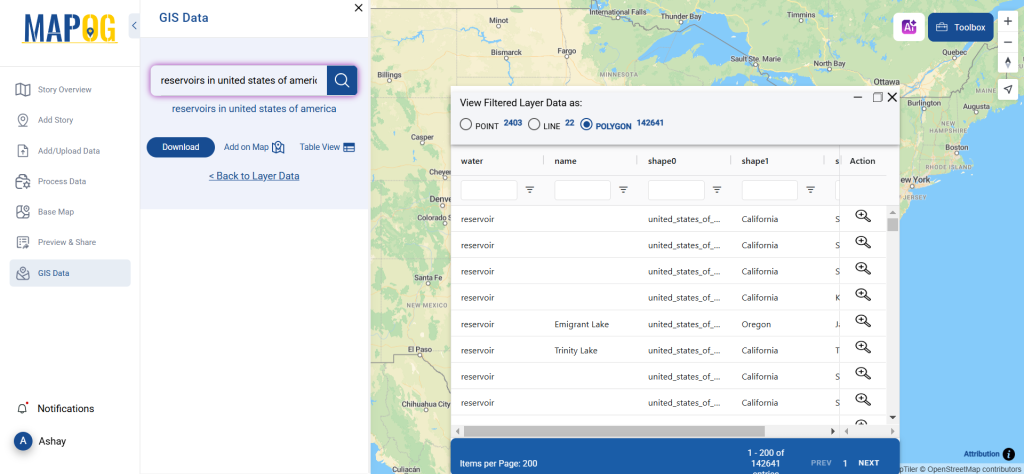
Log into MAPOG GIS Data and select the desired country. Use the search bar to locate Optometrists Data layers. View essential details such as location type (point or polygon) before proceeding.
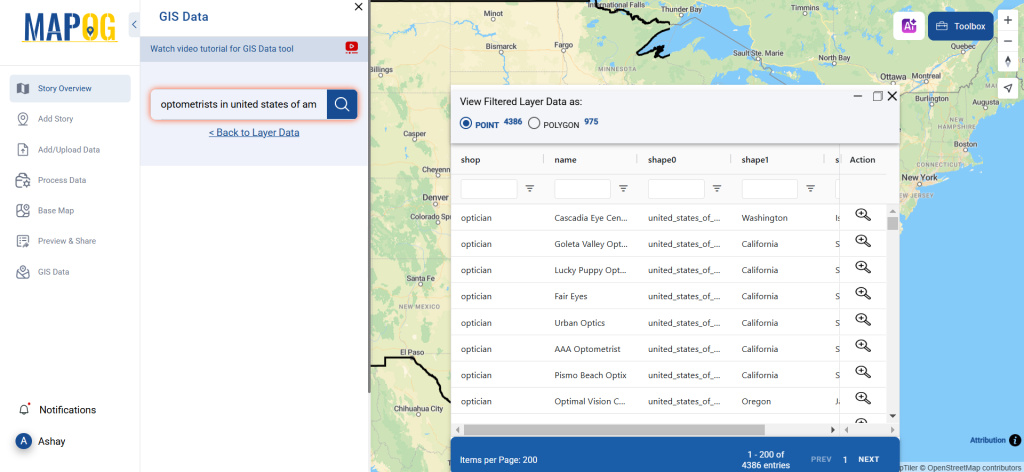
Step 2: Utilize the AI Search Tool
MAPOG’s Try AI feature helps users find data effortlessly. Enter ‘Optometrists Data’ along with a specific location, and the AI will retrieve relevant datasets quickly.
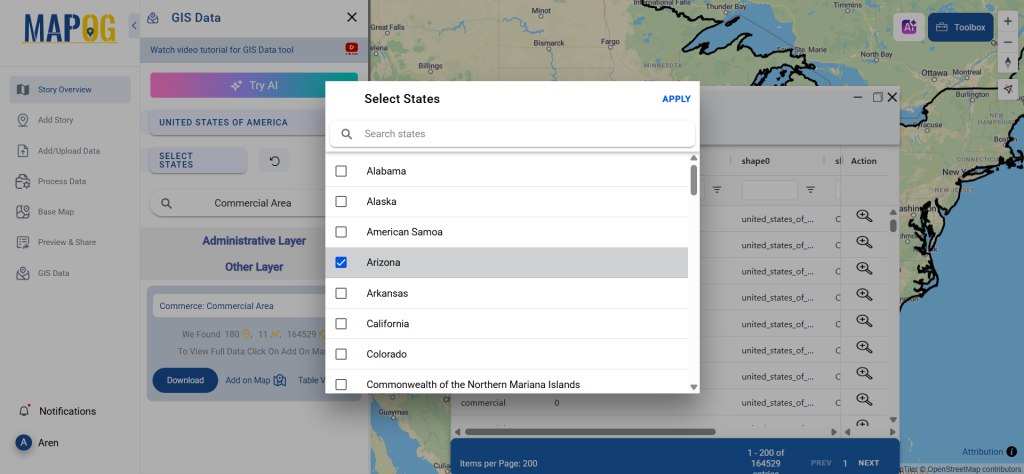
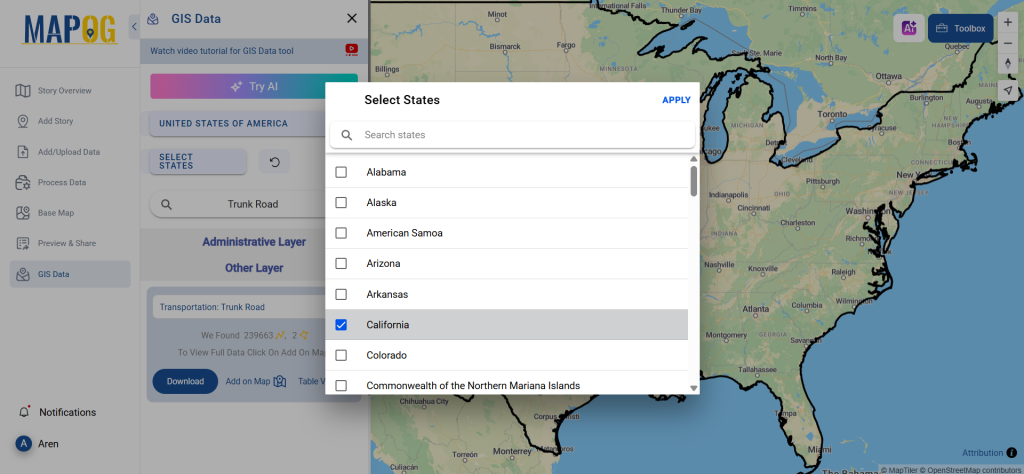
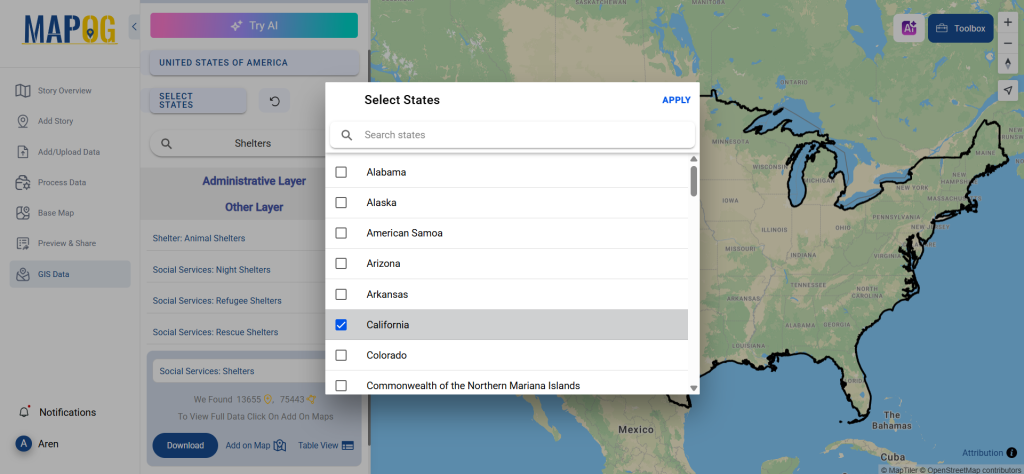
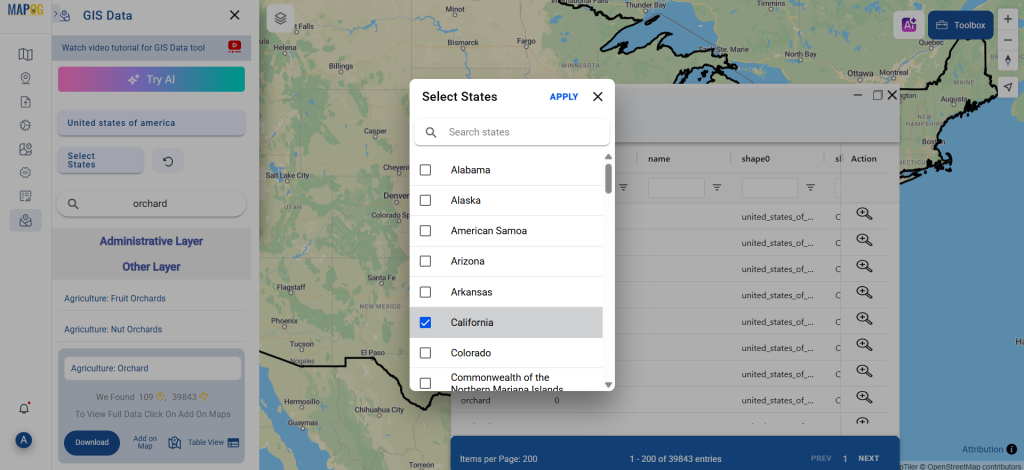
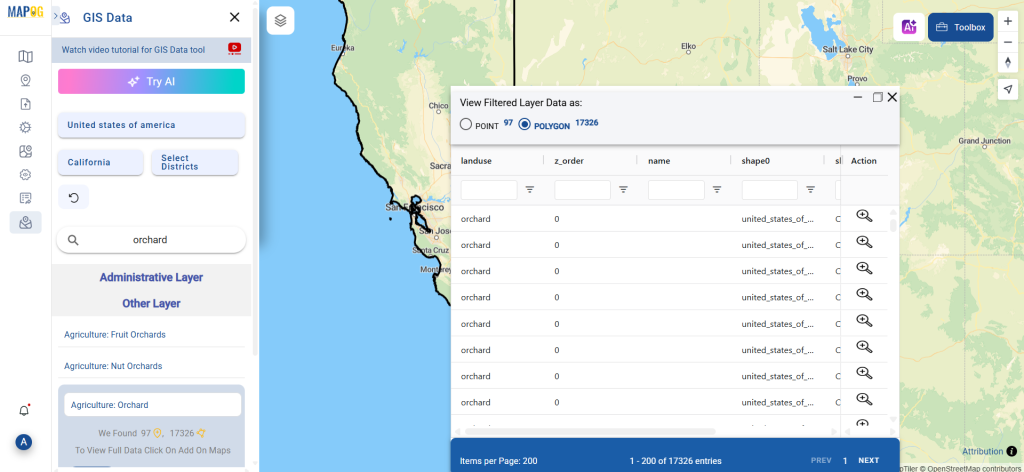
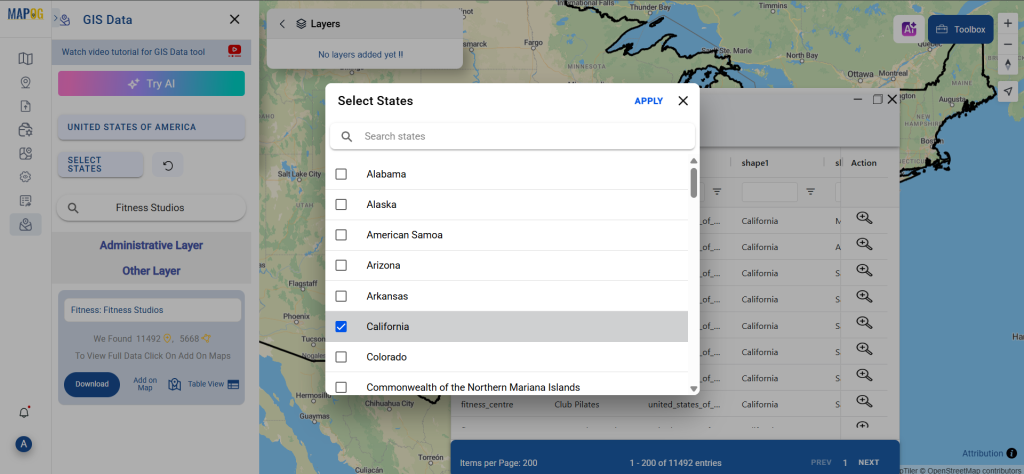
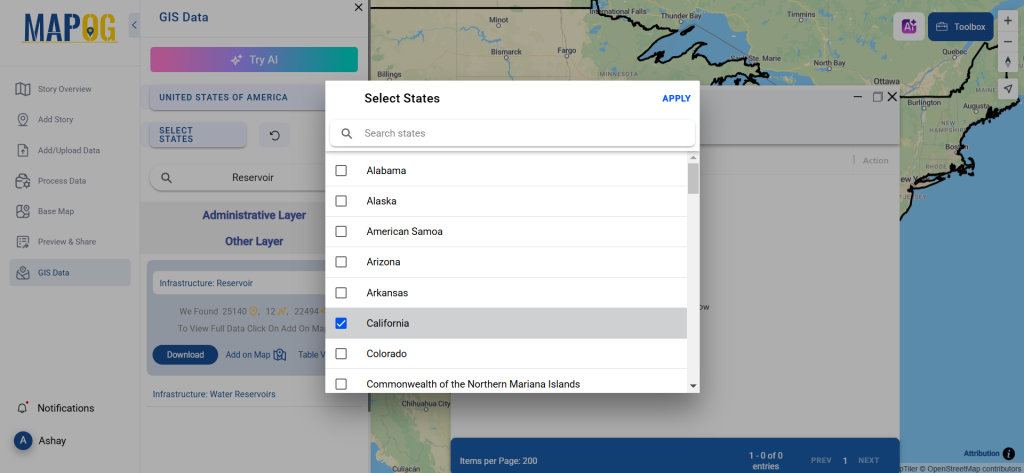
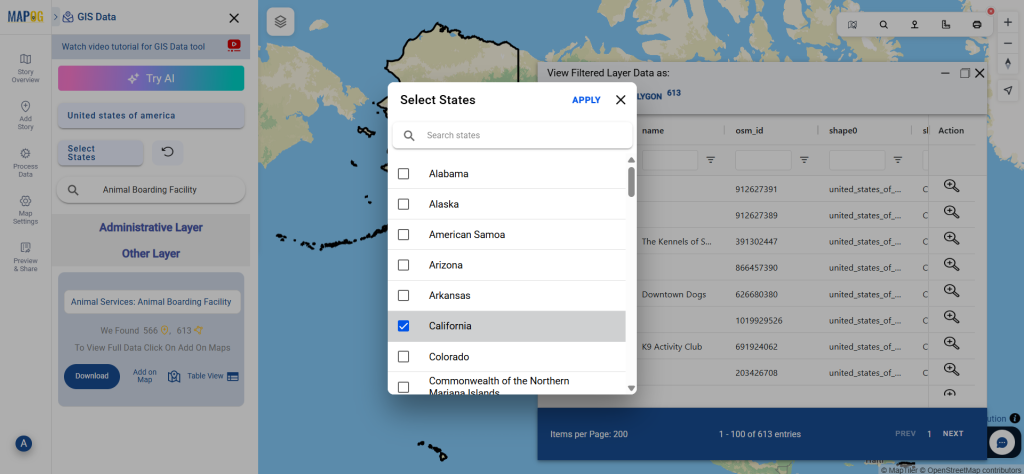
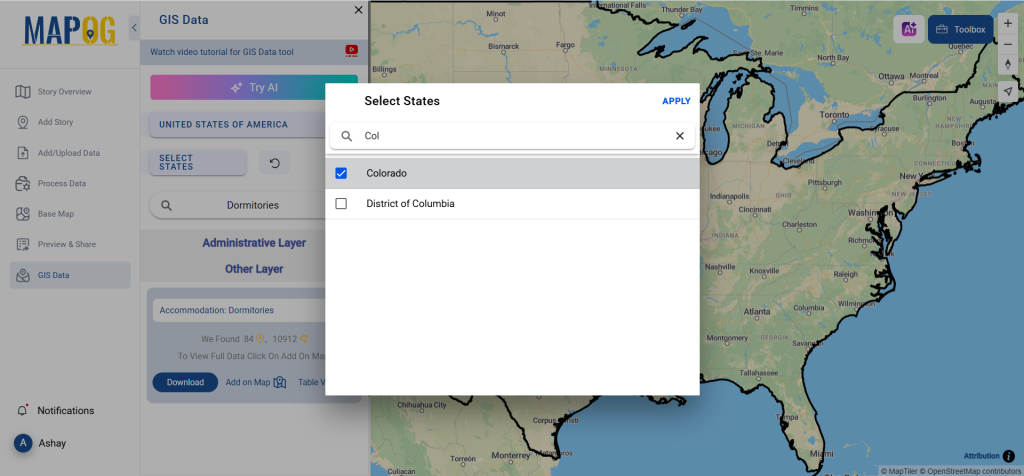
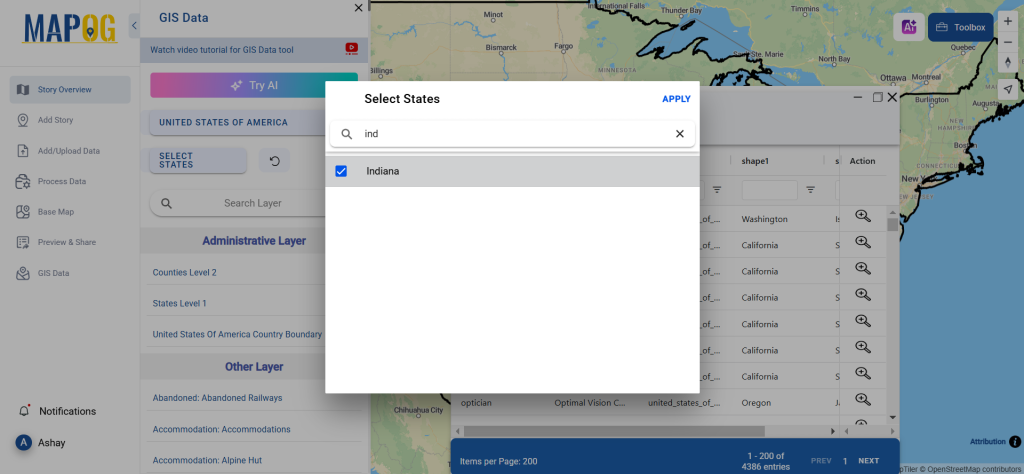
Step 3: Apply Data Filters
Refine your dataset using advanced filtering options. Narrow results by state, city, or district to get more precise optometrist location data. This ensures you download only the most relevant information.
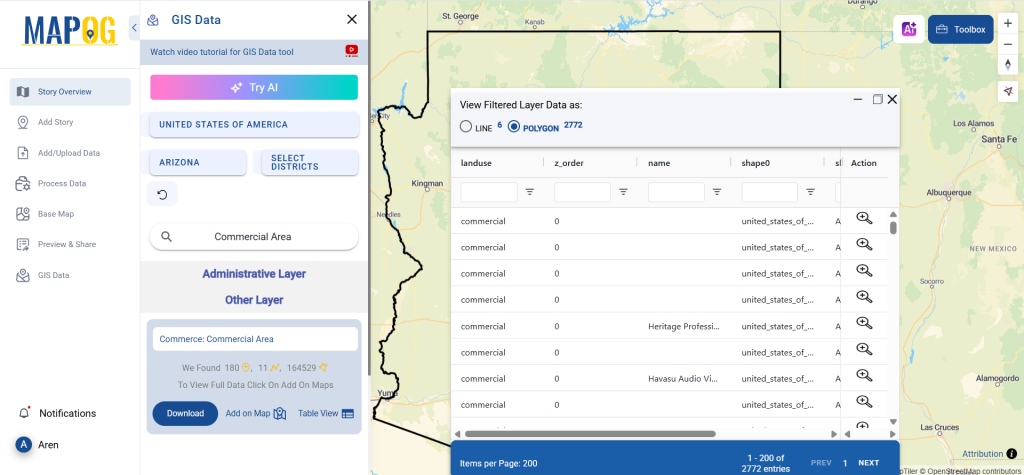
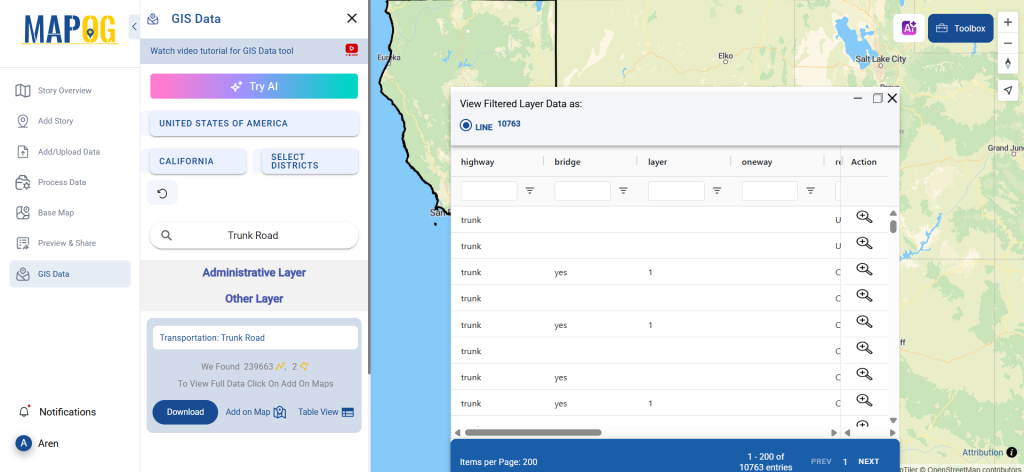
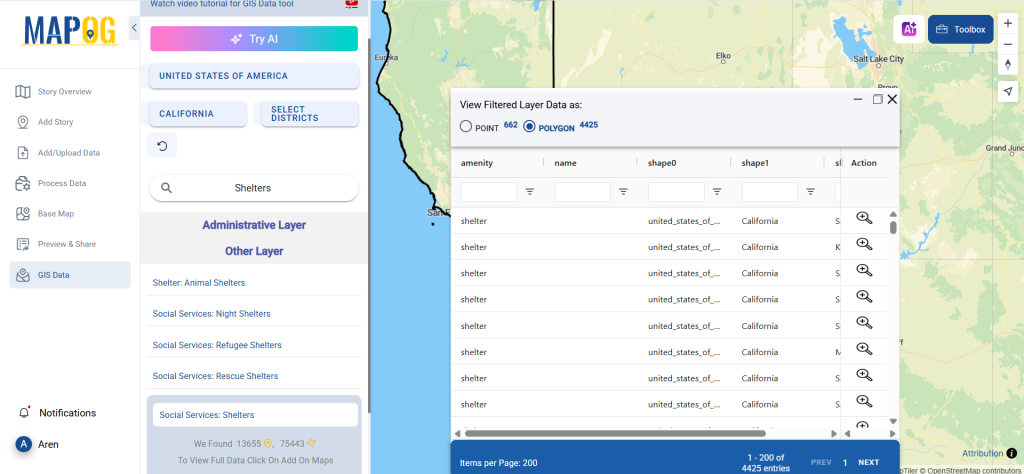
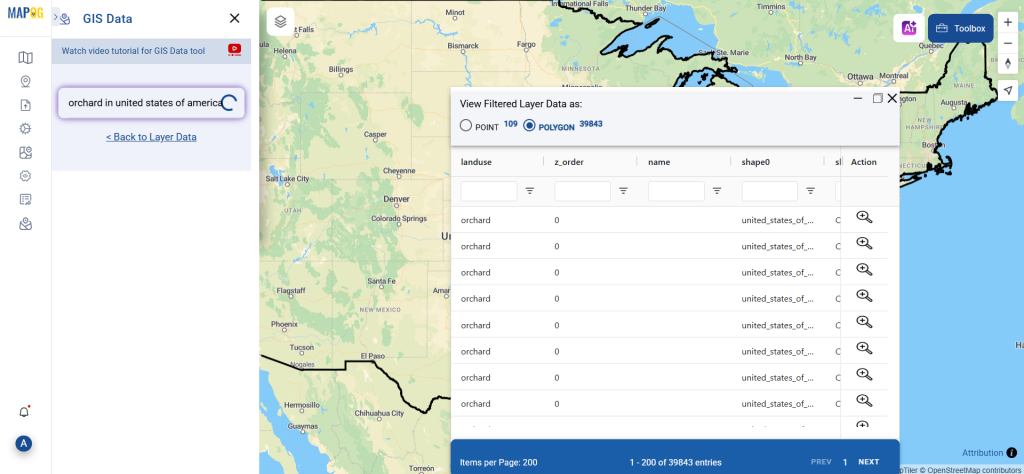
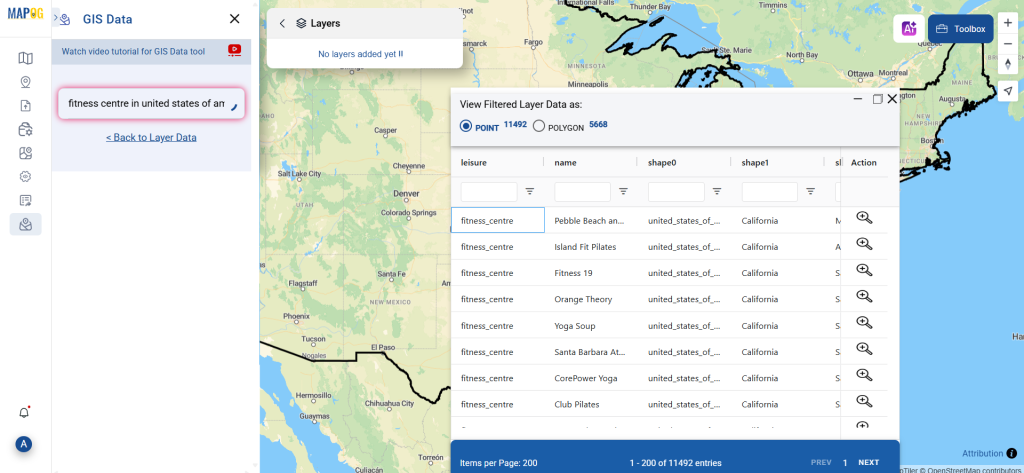
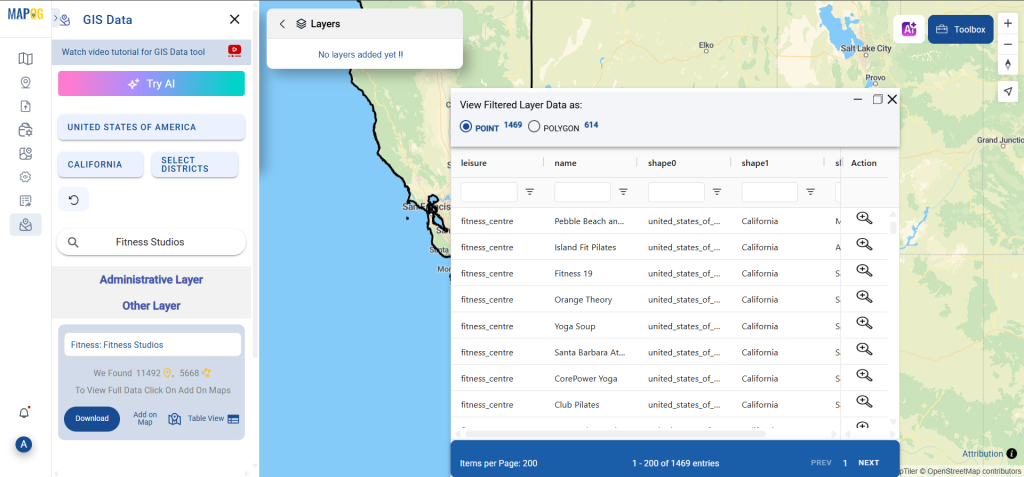
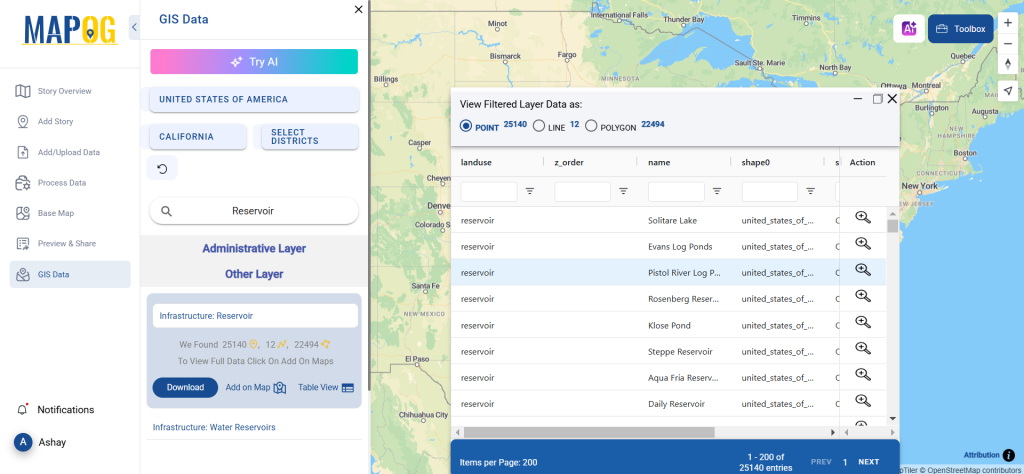
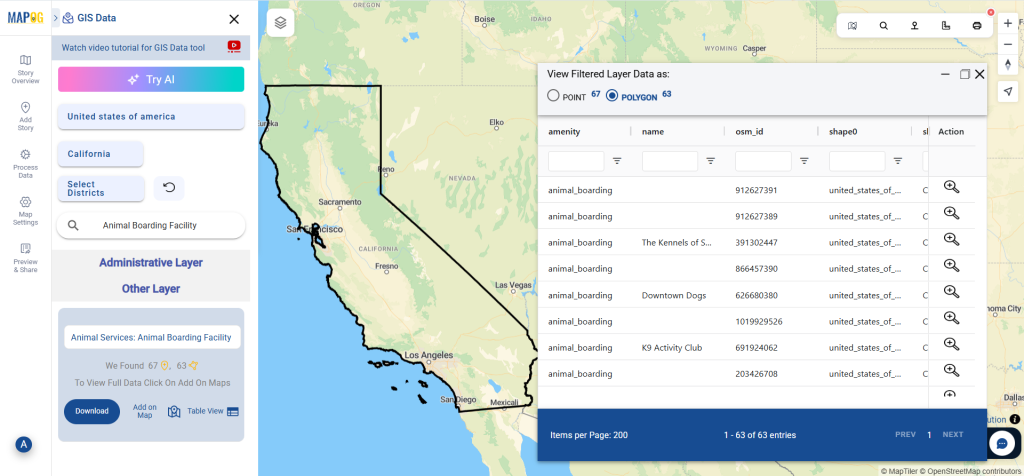
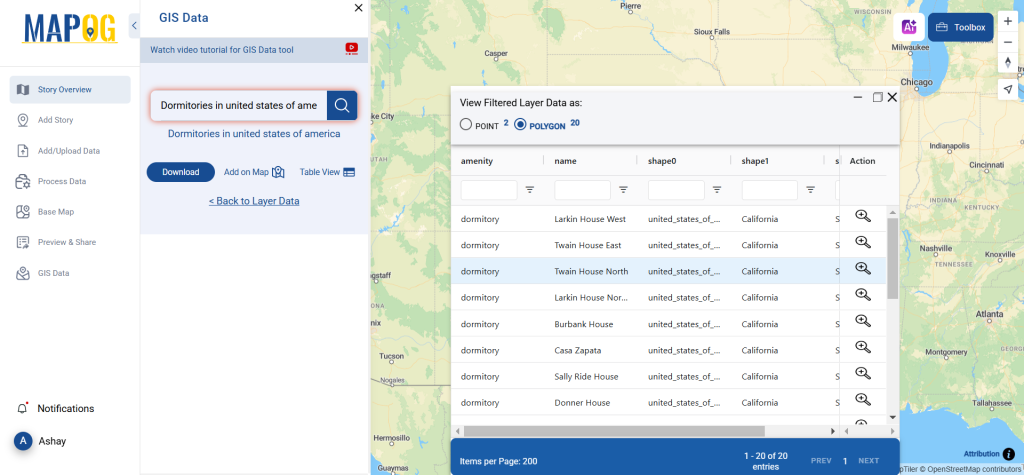
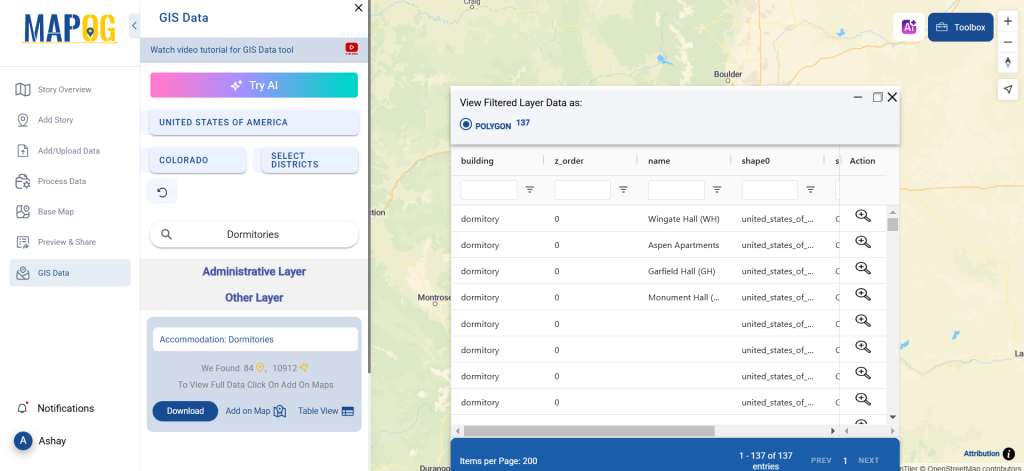
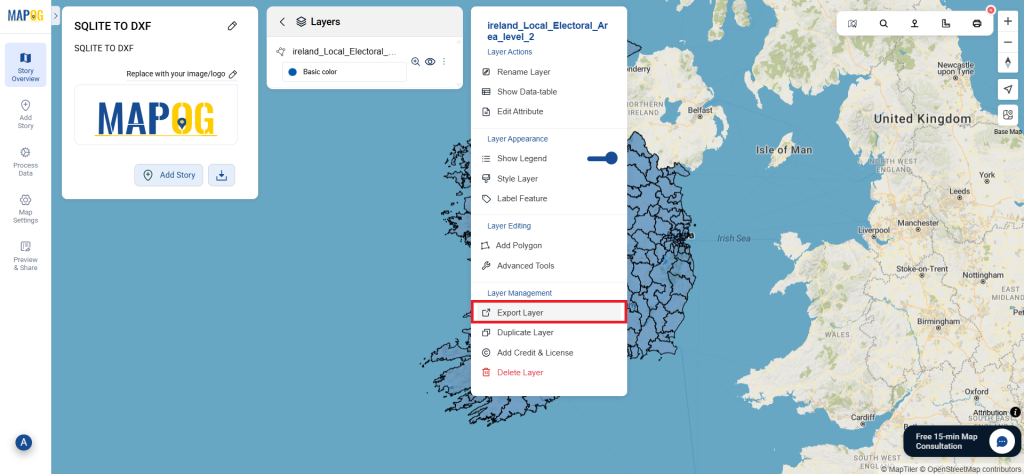
Step 4: Add Data to Map
Enhance your GIS project by adding optometrist data to the map. Click on ‘Add on Map’ to visualize optometry centers within the chosen area, aiding spatial analysis and decision-making.
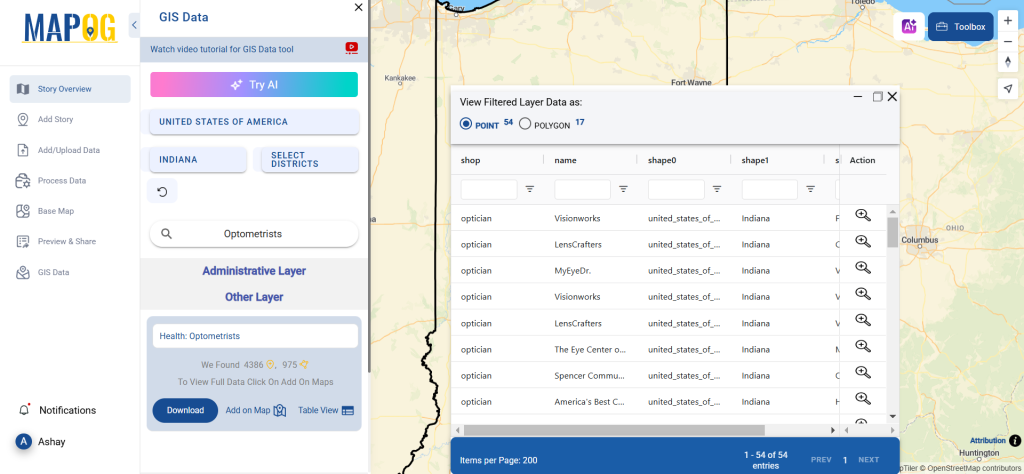
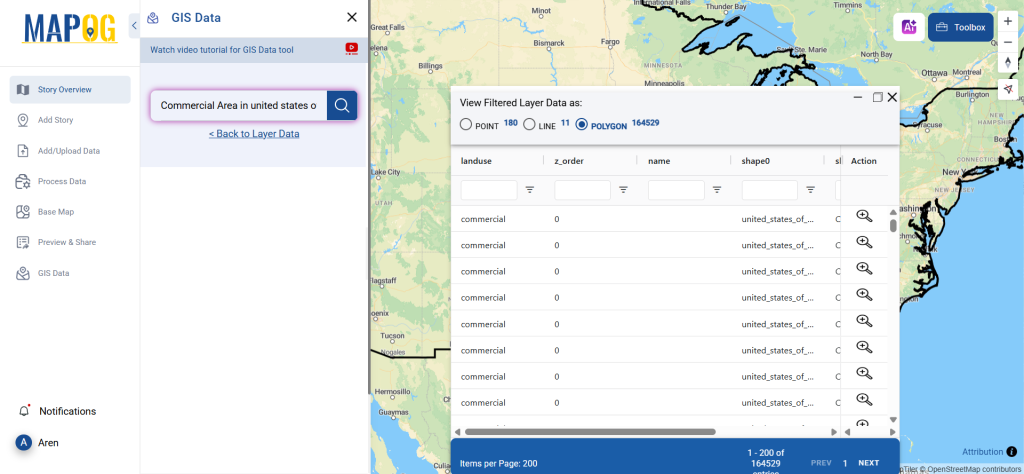
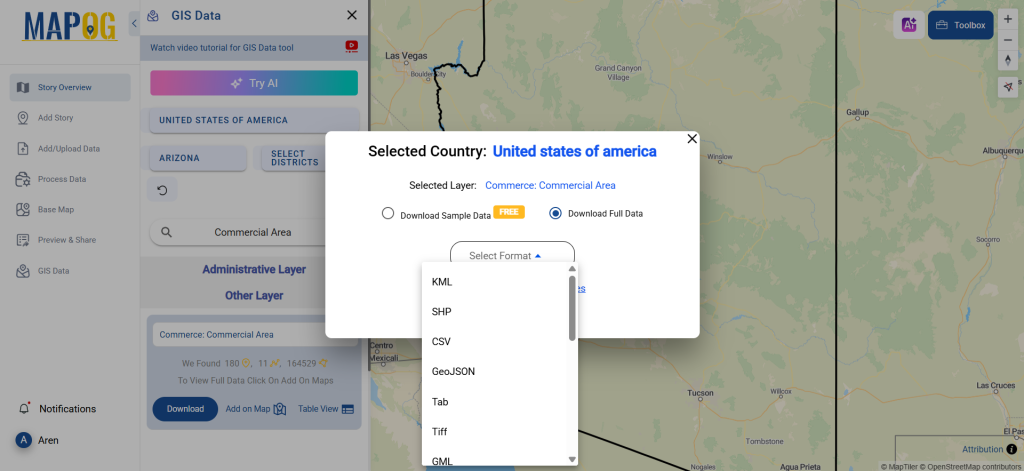
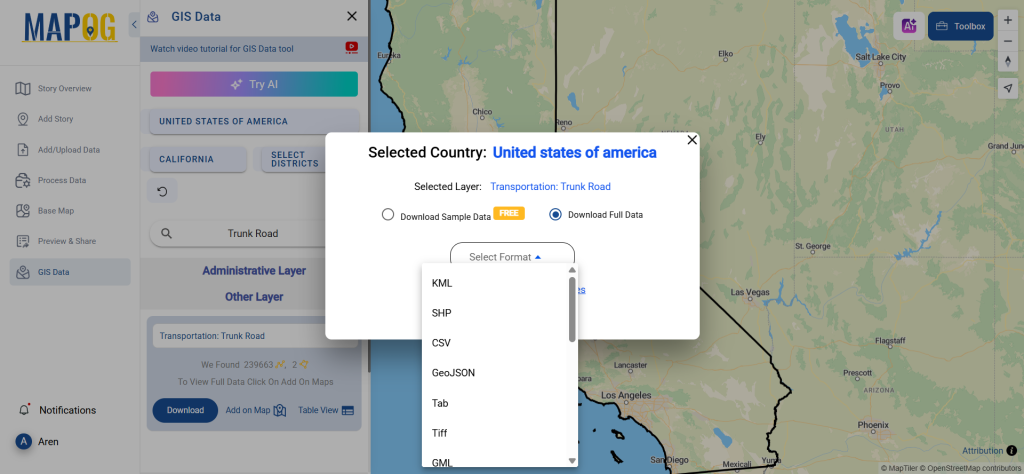
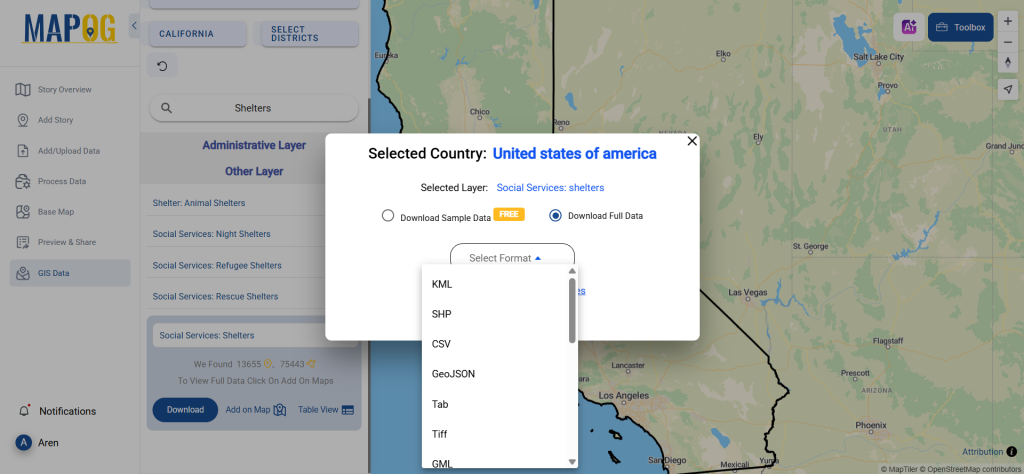
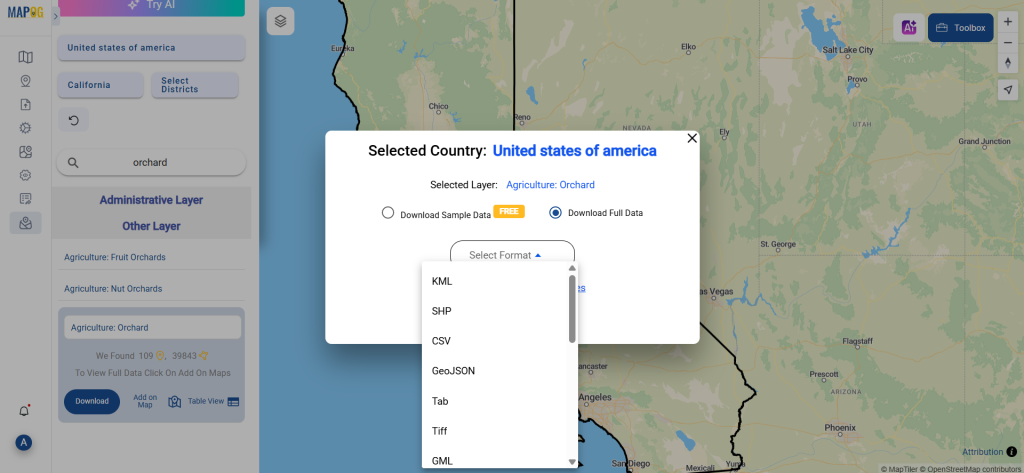
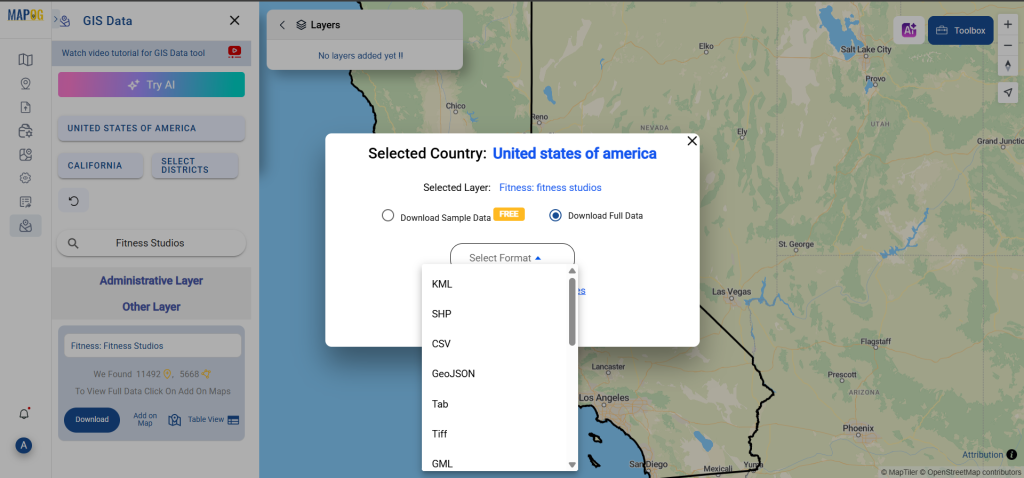
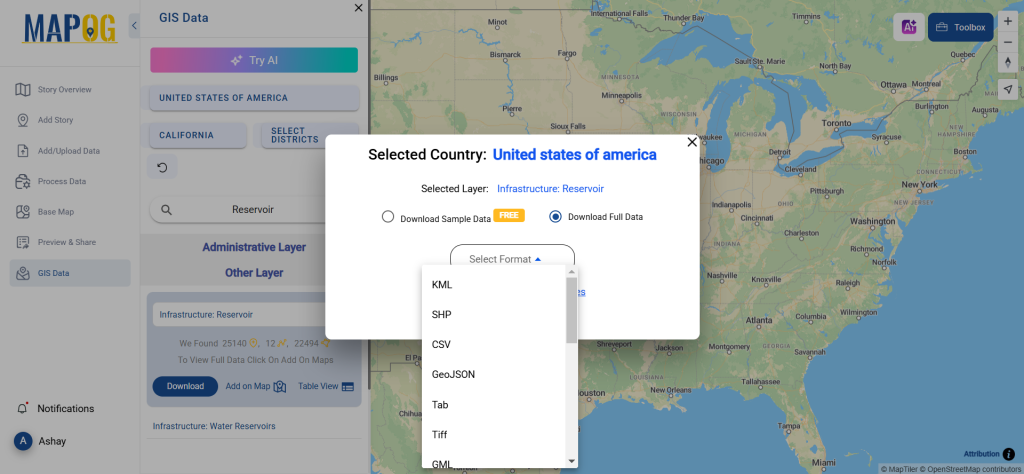
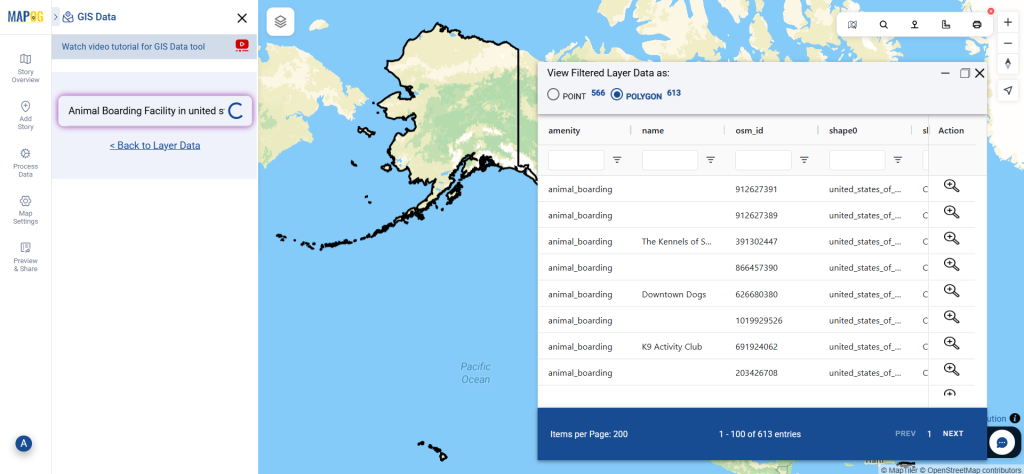
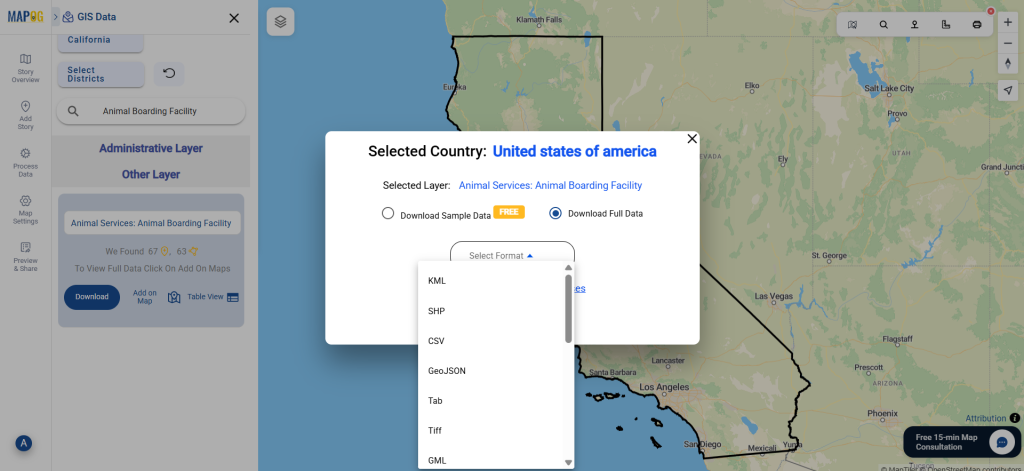
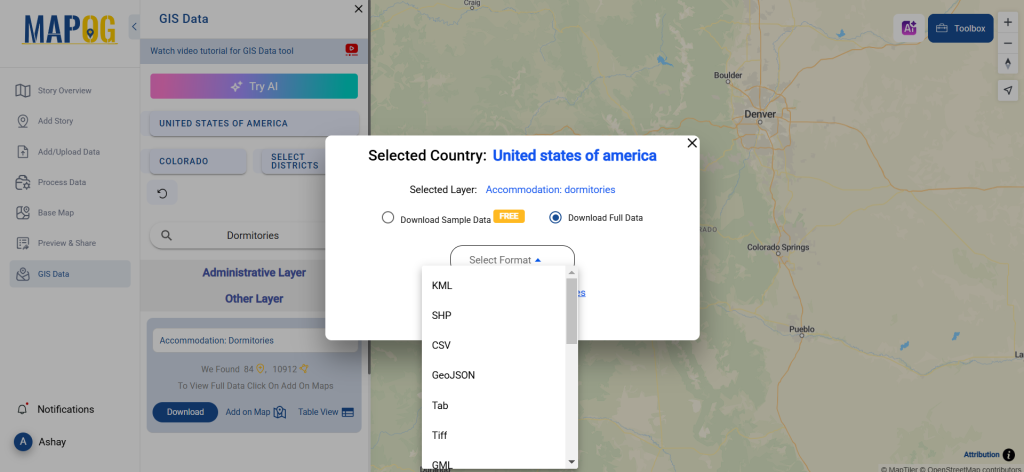
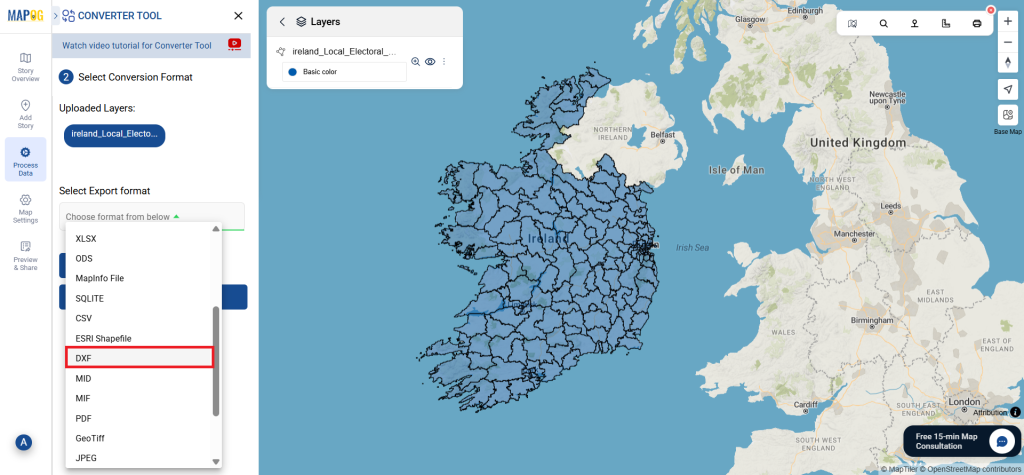
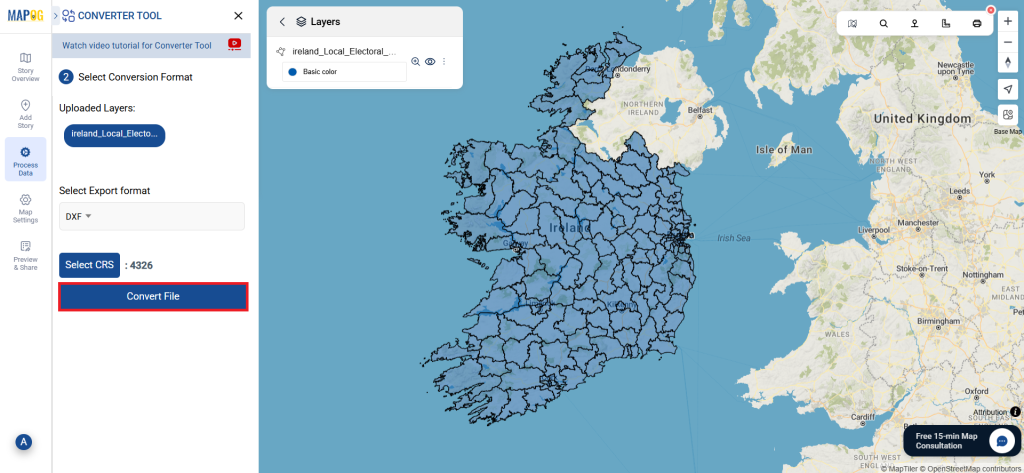
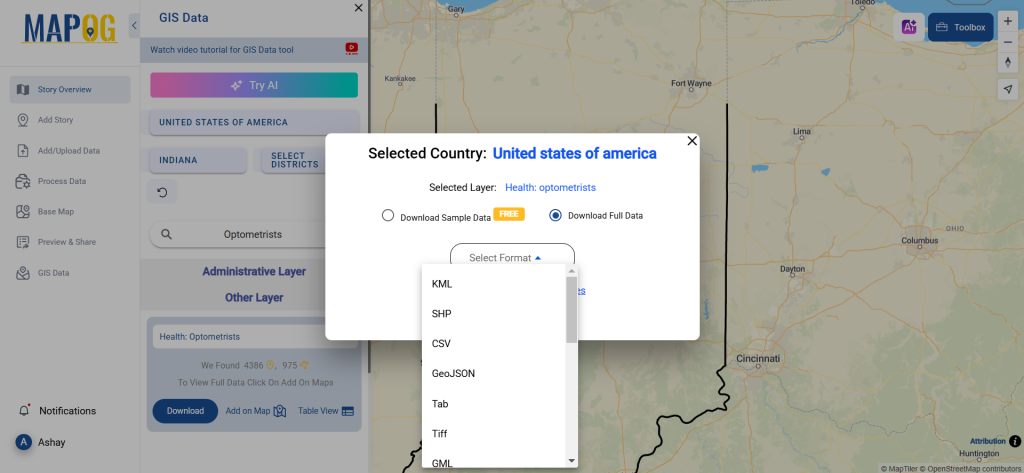
Step 5: Download Optometrists Data
Click ‘Download Data’ and choose between sample or full datasets. Pick from over 15+ GIS formats like Shapefile (SHP), KML, GeoJSON, MID, MIF, CSV, XLSX, and more. Agree to the terms and conditions before finalizing your download.
Conclusion
With GIS Data by MAPOG, accessing and downloading Optometrists Data is straightforward. Whether for healthcare analysis, urban planning, or business intelligence, having detailed optometry location data in multiple GIS formats enhances decision-making. Start your search today and unlock valuable insights into optometry services worldwide!
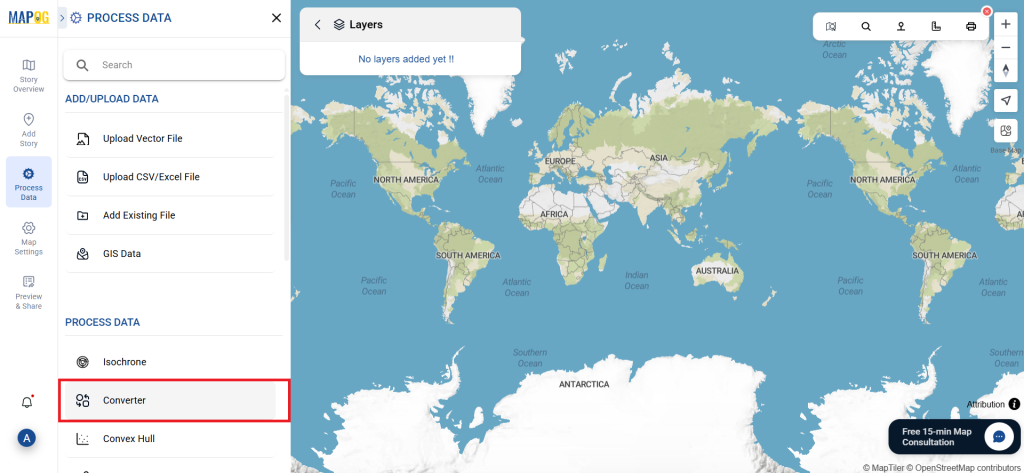
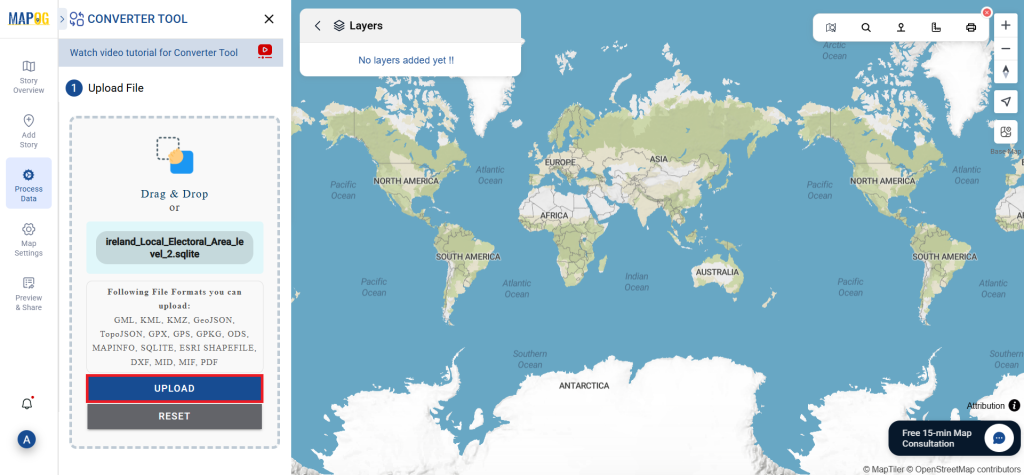
With MAPOG’s versatile toolkit, you can effortlessly upload vector and upload Excel or CSV data, incorporate existing layers, perform polyline splitting, use the converter for various formats, calculate isochrones, and utilize the Export Tool.
For any questions or further assistance, feel free to reach out to us at support@mapog.com. We’re here to help you make the most of your GIS data.
Download Shapefile for the following:
- World Countries Shapefile
- Australia
- Argentina
- Austria
- Belgium
- Brazil
- Canada
- Denmark
- Fiji
- Finland
- Germany
- Greece
- India
- Indonesia
- Ireland
- Italy
- Japan
- Kenya
- Lebanon
- Madagascar
- Malaysia
- Mexico
- Mongolia
- Netherlands
- New Zealand
- Nigeria
- Papua New Guinea
- Philippines
- Poland
- Russia
- Singapore
- South Africa
- South Korea
- Spain
- Switzerland
- Tunisia
- United Kingdom Shapefile
- United States of America
- Vietnam
- Croatia
- Chile
- Norway
- Maldives
- Bhutan
- Colombia
- Libya
- Comoros
- Hungary
- Laos
- Estonia
- Iraq
- Portugal
- Azerbaijan
- Macedonia
- Romania
- Peru
- Marshall Islands
- Slovenia
- Nauru
- Guatemala
- El Salvador
- Afghanistan
- Cyprus
- Syria
- Slovakia
- Luxembourg
- Jordan
- Armenia
- Haiti And Dominican Republic
- Malta
- Djibouti
- East Timor
- Micronesia
- Morocco
- Liberia
- Kosovo
- Isle Of Man
- Paraguay
- Tokelau
- Palau
- Ile De Clipperton
- Mauritius
- Equatorial Guinea
- Tonga
- Myanmar
- Thailand
- New Caledonia
- Niger
- Nicaragua
- Pakistan
- Nepal
- Seychelles
- Democratic Republic of the Congo
- China
- Kenya
- Kyrgyzstan
- Bosnia Herzegovina
- Burkina Faso
- Canary Island
- Togo
- Israel And Palestine
- Algeria
- Suriname
- Angola
- Cape Verde
- Liechtenstein
- Taiwan
- Turkmenistan
- Tuvalu
- Ivory Coast
- Moldova
- Somalia
- Belize
- Swaziland
- Solomon Islands
- North Korea
- Sao Tome And Principe
- Guyana
- Serbia
- Senegal And Gambia
- Faroe Islands
- Guernsey Jersey
- Monaco
- Tajikistan
- Pitcairn
Disclaimer : The GIS data provided for download in this article was initially sourced from OpenStreetMap (OSM) and further modified to enhance its usability. Please note that the original data is licensed under the Open Database License (ODbL) by the OpenStreetMap contributors. While modifications have been made to improve the data, any use, redistribution, or modification of this data must comply with the ODbL license terms. For more information on the ODbL, please visit OpenStreetMap’s License Page.
Here are some blogs you might be interested in:
- Download Airport data in Shapefile, KML , MIf +15 GIS format – Filter and download
- Download Bank Data in Shapefile, KML, GeoJSON, and More – Filter and Download
- Download Railway data in Shapefile, KML, GeojSON +15 GIS format
- Download Farmland Data in Shapefile, KML, GeoJSON, and More – Filter and Download
- Download Pharmacy Data in Shapefile, KML, GeoJSON, and More – Filter and Download
- Download ATM Data in Shapefile, KML, MID +15 GIS Formats Using GIS Data by MAPOG
- Download Road Data in Shapefile, KML, GeoJSON, and 15+ GIS Form